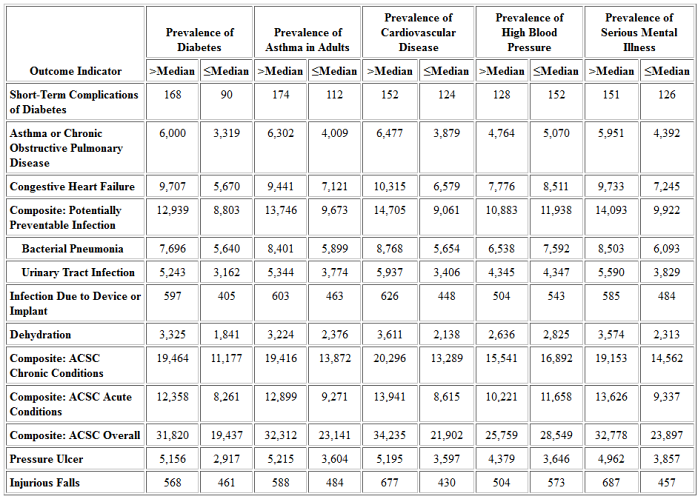
Table 17: Outcome Indicators by State Prevalence of Chronic Conditions, 2005a
Select for:
- Table 17A: National HCBS Population.
- Table 17B: Dually Eligible HCBS Participants.
- Table 17C: Medicaid-Only HCBS Participants.
- Table 17D: I/DD Subpopulation.
- Table 17E: SMI Subpopulation.
- Table 17F: HCBS Population Ages 18-64 Without I/DD or SMI.
Select the table to go to the text version. ↓
| Outcome Indicator | Prevalence of Diabetes |
Prevalence of Asthma in Adults |
Prevalence of Cardiovascular Disease |
|||
|---|---|---|---|---|---|---|
| >Median | ≤Median | >Median | ≤Median | >Median | ≤Median | |
| Short-Term Complications of Diabetes | 168 | 90 | 174 | 112 | 152 | 124 |
| Asthma or Chronic Obstructive Pulmonary Disease | 6,000 | 3,319 | 6,302 | 4,009 | 6,477 | 3,879 |
| Congestive Heart Failure | 9,707 | 5,670 | 9,441 | 7,121 | 10,315 | 6,579 |
| Composite: Potentially Preventable Infection | 12,939 | 8,803 | 13,746 | 9,673 | 14,705 | 9,061 |
| Bacterial Pneumonia | 7,696 | 5,640 | 8,401 | 5,899 | 8,768 | 5,654 |
| Urinary Tract Infection | 5,243 | 3,162 | 5,344 | 3,774 | 5,937 | 3,406 |
| Infection Due to Device or Implant | 597 | 405 | 603 | 463 | 626 | 448 |
| Dehydration | 3,325 | 1,841 | 3,224 | 2,376 | 3,611 | 2,138 |
| Composite: ACSC Chronic Conditions | 19,464 | 11,177 | 19,416 | 13,872 | 20,296 | 13,289 |
| Composite: ACSC Acute Conditions | 12,358 | 8,261 | 12,899 | 9,271 | 13,941 | 8,615 |
| Composite: ACSC Overall | 31,820 | 19,437 | 32,312 | 23,141 | 34,235 | 21,902 |
| Pressure Ulcer | 5,156 | 2,917 | 5,215 | 3,604 | 5,195 | 3,597 |
| Injurious Falls | 568 | 461 | 588 | 484 | 677 | 430 |
| Outcome Indicator | Prevalence of High Blood Pressure |
Prevalence of Serious Mental Illness |
||
|---|---|---|---|---|
| >Median | ≤Median | >Median | ≤Median | |
| Short-Term Complications of Diabetes | 128 | 152 | 151 | 126 |
| Asthma or Chronic Obstructive Pulmonary Disease | 4,764 | 5,070 | 5,951 | 4,392 |
| Congestive Heart Failure | 7,776 | 8,511 | 9,733 | 7,245 |
| Composite: Potentially Preventable Infection | 10,883 | 11,938 | 14,093 | 9,922 |
| Bacterial Pneumonia | 6,538 | 7,592 | 8,503 | 6,093 |
| Urinary Tract Infection | 4,345 | 4,347 | 5,590 | 3,829 |
| Infection Due to Device or Implant | 504 | 543 | 585 | 484 |
| Dehydration | 2,636 | 2,825 | 3,574 | 2,313 |
| Composite: ACSC Chronic Conditions | 15,541 | 16,892 | 19,153 | 14,562 |
| Composite: ACSC Acute Conditions | 10,221 | 11,658 | 13,626 | 9,337 |
| Composite: ACSC Overall | 25,759 | 28,549 | 32,778 | 23,897 |
| Pressure Ulcer | 4,379 | 3,646 | 4,962 | 3,857 |
| Injurious Falls | 504 | 573 | 687 | 457 |
ACSC = ambulatory care-sensitive condition; HCBS = home and community-based services; I/DD = intellectual and development disabilities; SMI = serious mental illness.
a. All outcome indicators expressed as potentially avoidable hospital stays per 100,000 persons in the HCBS population. HCBS population for outcome indicators excludes: individuals under age 18; people with only institutional use in a given quarter; people on managed care plans; and persons in the States of Arizona, Maine, Washington, and Wisconsin.
Dually eligible = dually eligible for Medicaid and Medicare. Eligibility for Medicare defined as inclusion in Medicare denominator file.
Medicaid only = part of Medicaid HCBS population but not enrolled in Medicare.
HCBS subpopulations of I/DD, SMI, Under 65 Without I/DD or SMI, and 65+ are defined as in the Appendix.
Median is defined as the value at which half of States are below and half of States are above.
Source for Outcome Indicators: Agency for Healthcare Research and Quality (AHRQ), Medicaid Analytic eXtract (MAX) data, and Medicare Provider Analysis and Review (MedPAR) data.
Sources for column heading data are described in the Appendix.


