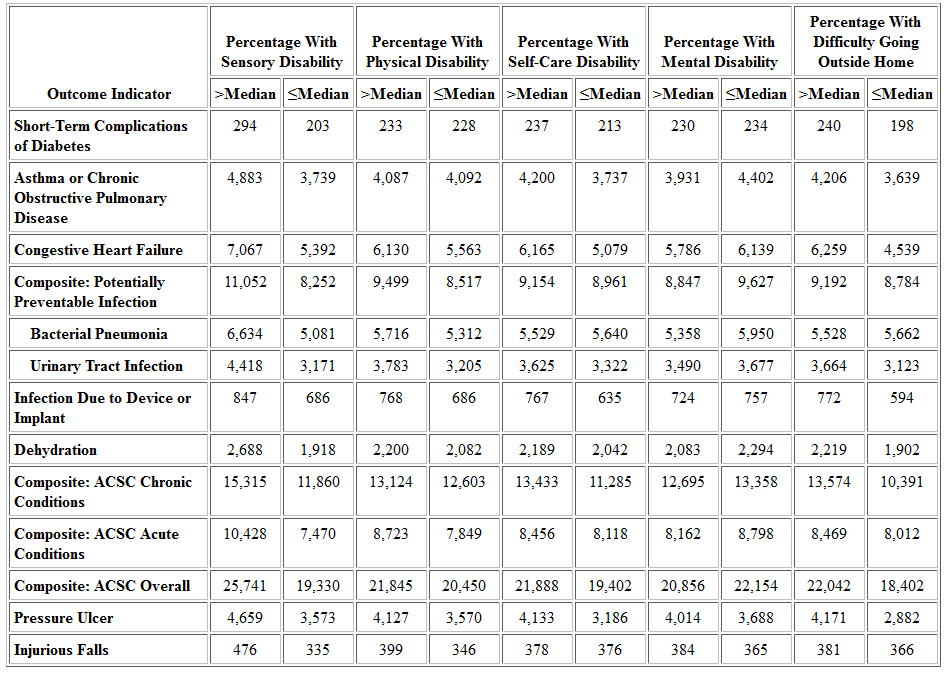
Table 19: Outcome Indicators by State Prevalence of Specific Disabilities, Age 65+, 2005a
Select for:
- Table 19A: National HCBS Population
- Table 19C: Medicaid-Only HCBS Participants.
- Table 19D: I/DD Subpopulation.
- Table 19E: SMI Subpopulation.
- Table 19F: HCBS Population Ages 18-64 Without I/DD or SMI.
- Table 19G: HCBS Population Age 65+.
Select the table to go to the text version. ↓
| Outcome Indicator | Percentage With Sensory Disability |
Percentage With Physical Disability |
Percentage With Self-Care Disability |
|||
|---|---|---|---|---|---|---|
| >Median | ≤Median | >Median | ≤Median | >Median | ≤Median | |
| Short-Term Complications of Diabetes | 294 | 203 | 233 | 228 | 237 | 213 |
| Asthma or Chronic Obstructive Pulmonary Disease | 4,883 | 3,739 | 4,087 | 4,092 | 4,200 | 3,737 |
| Congestive Heart Failure | 7,067 | 5,392 | 6,130 | 5,563 | 6,165 | 5,079 |
| Composite: Potentially Preventable Infection | 11,052 | 8,252 | 9,499 | 8,517 | 9,154 | 8,961 |
| Bacterial Pneumonia | 6,634 | 5,081 | 5,716 | 5,312 | 5,529 | 5,640 |
| Urinary Tract Infection | 4,418 | 3,171 | 3,783 | 3,205 | 3,625 | 3,322 |
| Infection Due to Device or Implant | 847 | 686 | 768 | 686 | 767 | 635 |
| Dehydration | 2,688 | 1,918 | 2,200 | 2,082 | 2,189 | 2,042 |
| Composite: ACSC Chronic Conditions | 15,315 | 11,860 | 13,124 | 12,603 | 13,433 | 11,285 |
| Composite: ACSC Acute Conditions | 10,428 | 7,470 | 8,723 | 7,849 | 8,456 | 8,118 |
| Composite: ACSC Overall | 25,741 | 19,330 | 21,845 | 20,450 | 21,888 | 19,402 |
| Pressure Ulcer | 4,659 | 3,573 | 4,127 | 3,570 | 4,133 | 3,186 |
| Injurious Falls | 476 | 335 | 399 | 346 | 378 | 376 |
| Outcome Indicator | Percentage With Mental Disability |
Percentage With Difficulty Going Outside Home |
||
|---|---|---|---|---|
| >Median | ≤Median | >Median | ≤Median | |
| Short-Term Complications of Diabetes | 230 | 234 | 240 | 198 |
| Asthma or Chronic Obstructive Pulmonary Disease | 3,931 | 4,402 | 4,206 | 3,639 |
| Congestive Heart Failure | 5,786 | 6,139 | 6,259 | 4,539 |
| Composite: Potentially Preventable Infection | 8,847 | 9,627 | 9,192 | 8,784 |
| Bacterial Pneumonia | 5,358 | 5,950 | 5,528 | 5,662 |
| Urinary Tract Infection | 3,490 | 3,677 | 3,664 | 3,123 |
| Infection Due to Device or Implant | 724 | 757 | 772 | 594 |
| Dehydration | 2,083 | 2,294 | 2,219 | 1,902 |
| Composite: ACSC Chronic Conditions | 12,695 | 13,358 | 13,574 | 10,391 |
| Composite: ACSC Acute Conditions | 8,162 | 8,798 | 8,469 | 8,012 |
| Composite: ACSC Overall | 20,856 | 22,154 | 22,042 | 18,402 |
| Pressure Ulcer | 4,014 | 3,688 | 4,171 | 2,882 |
| Injurious Falls | 384 | 365 | 381 | 366 |
ACSC = ambulatory care-sensitive condition; HCBS = home and community-based services; I/DD = intellectual and development disabilities; SMI = serious mental illness.
a. All outcome indicators expressed as potentially avoidable hospital stays per 100,000 persons in the HCBS population. HCBS population for outcome indicators excludes: individuals under age 18; people with only institutional use in a given quarter; people on managed care plans; and persons in the States of Arizona, Maine, Washington, and Wisconsin.
Dually eligible = dually eligible for Medicaid and Medicare. Eligibility for Medicare defined as inclusion in Medicare denominator file.
Medicaid only = part of Medicaid HCBS population but not enrolled in Medicare.
HCBS subpopulations of I/DD, SMI, Under 65 Without I/DD or SMI, and 65+ are defined as in the Appendix.
Median is defined as the value at which half of States are below and half of States are above.
Source for Outcome Indicators: Agency for Healthcare Research and Quality (AHRQ), Medicaid Analytic eXtract (MAX) data, and Medicare Provider Analysis and Review (MedPAR) data.
Sources for column heading data are described in the Appendix.


