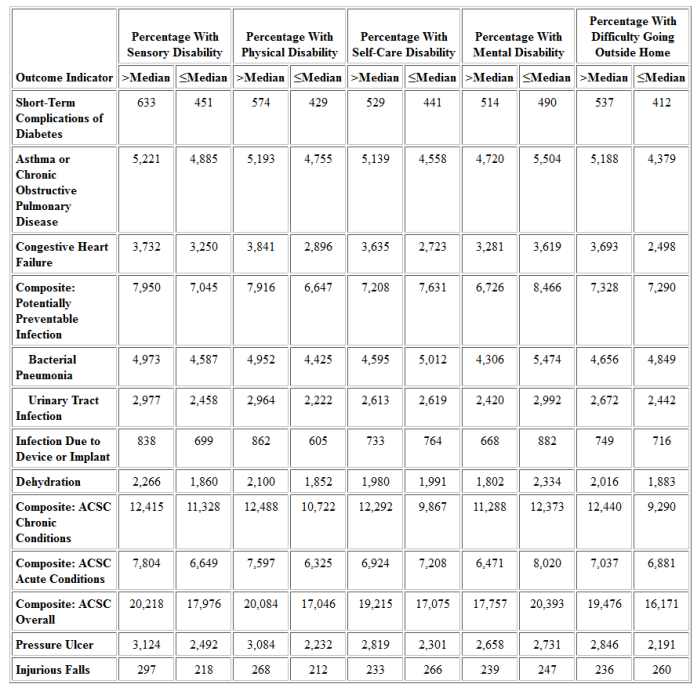
Table 19: Outcome Indicators by State Prevalence of Specific Disabilities, Age 65+, 2005a
Select for:
- Table 19A: National HCBS Population.
- Table 19B: Dually Eligible HCBS Participants.
- Table 19C: Medicaid-Only HCBS Participants.
- Table 19D: I/DD Subpopulation.
- Table 19F: HCBS Population Ages 18-64 Without I/DD or SMI.
- Table 19G: HCBS Population Age 65+.
Select the table to go to the text version. ↓
| Outcome Indicator | Percentage With Sensory Disability |
Percentage With Physical Disability |
Percentage With Self-Care Disability |
|||
|---|---|---|---|---|---|---|
| >Median | ≤Median | >Median | ≤Median | >Median | ≤Median | |
| Short-Term Complications of Diabetes | 633 | 451 | 574 | 429 | 529 | 441 |
| Asthma or Chronic Obstructive Pulmonary Disease | 5,221 | 4,885 | 5,193 | 4,755 | 5,139 | 4,558 |
| Congestive Heart Failure | 3,732 | 3,250 | 3,841 | 2,896 | 3,635 | 2,723 |
| Composite: Potentially Preventable Infection | 7,950 | 7,045 | 7,916 | 6,647 | 7,208 | 7,631 |
| Bacterial Pneumonia | 4,973 | 4,587 | 4,952 | 4,425 | 4,595 | 5,012 |
| Urinary Tract Infection | 2,977 | 2,458 | 2,964 | 2,222 | 2,613 | 2,619 |
| Infection Due to Device or Implant | 838 | 699 | 862 | 605 | 733 | 764 |
| Dehydration | 2,266 | 1,860 | 2,100 | 1,852 | 1,980 | 1,991 |
| Composite: ACSC Chronic Conditions | 12,415 | 11,328 | 12,488 | 10,722 | 12,292 | 9,867 |
| Composite: ACSC Acute Conditions | 7,804 | 6,649 | 7,597 | 6,325 | 6,924 | 7,208 |
| Composite: ACSC Overall | 20,218 | 17,976 | 20,084 | 17,046 | 19,215 | 17,075 |
| Pressure Ulcer | 3,124 | 2,492 | 3,084 | 2,232 | 2,819 | 2,301 |
| Injurious Falls | 297 | 218 | 268 | 212 | 233 | 266 |
| Outcome Indicator | Percentage With Mental Disability |
Percentage With Difficulty Going Outside Home |
||
|---|---|---|---|---|
| >Median | ≤Median | >Median | ≤Median | |
| Short-Term Complications of Diabetes | 514 | 490 | 537 | 412 |
| Asthma or Chronic Obstructive Pulmonary Disease | 4,720 | 5,504 | 5,188 | 4,379 |
| Congestive Heart Failure | 3,281 | 3,619 | 3,693 | 2,498 |
| Composite: Potentially Preventable Infection | 6,726 | 8,466 | 7,328 | 7,290 |
| Bacterial Pneumonia | 4,306 | 5,474 | 4,656 | 4,849 |
| Urinary Tract Infection | 2,420 | 2,992 | 2,672 | 2,442 |
| Infection Due to Device or Implant | 668 | 882 | 749 | 716 |
| Dehydration | 1,802 | 2,334 | 2,016 | 1,883 |
| Composite: ACSC Chronic Conditions | 11,288 | 12,373 | 12,440 | 9,290 |
| Composite: ACSC Acute Conditions | 6,471 | 8,020 | 7,037 | 6,881 |
| Composite: ACSC Overall | 17,757 | 20,393 | 19,476 | 16,171 |
| Pressure Ulcer | 2,658 | 2,731 | 2,846 | 2,191 |
| Injurious Falls | 239 | 247 | 236 | 260 |
ACSC = ambulatory care-sensitive condition; HCBS = home and community-based services; I/DD = intellectual and development disabilities; SMI = serious mental illness.
a. All outcome indicators expressed as potentially avoidable hospital stays per 100,000 persons in the HCBS population. HCBS population for outcome indicators excludes: individuals under age 18; people with only institutional use in a given quarter; people on managed care plans; and persons in the States of Arizona, Maine, Washington, and Wisconsin.
Dually eligible = dually eligible for Medicaid and Medicare. Eligibility for Medicare defined as inclusion in Medicare denominator file.
Medicaid only = part of Medicaid HCBS population but not enrolled in Medicare.
HCBS subpopulations of I/DD, SMI, Under 65 Without I/DD or SMI, and 65+ are defined as in the Appendix.
Median is defined as the value at which half of States are below and half of States are above.
Source for Outcome Indicators: Agency for Healthcare Research and Quality (AHRQ), Medicaid Analytic eXtract (MAX) data, and Medicare Provider Analysis and Review (MedPAR) data.
Sources for column heading data are described in the Appendix.


