Sustaining Zero CLABSIs
The Virginia Experience
Contents
Slide 1. Getting to Zero and Sustaining Success: The Virginia Experience
Slide 2. Learning Objectives
Slide 3. Why Virginia?
Slide 4. Virginia and the National Collaborative;
Slide 5. National CLABSI Collaborative: Challenges Every State Faced
Slide 6. Challenge #1: Data Submission VA CLABSI Data Submission, Cohort 3
Slide 7. Challenge #1: Data Submission VA CLABSI Data Submission, Cohort 6
Slide 8. Challenge #1: Data Submission VA TCT Submission, Cohort 3
Slide 9. Challenge #1: Data Submission VA TCT Submission, Cohort 6
Slide 10. Getting the Data Submitted: How did VA do it?
Slide 11. Challenge #2: Reducing CLABSI Rates VA Cohort 3 CLABSI Rate Down 46%
Slide 12. Challenge #2: Reducing CLABSI Rates VA Cohort 6 CLABSI Rate Down 27%
Slide 13. Challenge #2: Rate Up for 2 Quarters; Reducing CLABSI Rates Not Smooth
Slide 14. Challenge #2: Reducing CLABSI Rates Trend Line Not Smooth
Slide 15. Challenge #2: Reducing CLABSI Rates Trend Line Not Smooth (cont.)
Slide 16. Challenge #2: Reducing CLABSI Rates Using TCT Data: C3 Technical Work
Slide 17. Challenge #2: Reducing CLABSI Rates Using TCT Data: C3 Technical Work
Slide 18. Challenge #2: Reducing CLABSI Rates Using TCT Data: Technical Work
Slide 19. Challenge #2: Improving Patient Safety Using TCT Data: C3 CUSP Work
Slide 20. Challenge #2: Improving Patient Safety Using TCT Data: CUSP Work
Slide 21. Challenge #2: Improving Patient Safety
Slide 22. Challenge #2: Improving Patient Safety CUSP in action
Slide 23. Challenge #2: Reducing CLABSI Rates Using TCT Data: C3 Barriers
Slide 24. Challenge #2: Reducing CLABSI Rates Using TCT Data: Barriers
Slide 25. Challenge #3: Sustainability: Where do we go from here?
Slide 26. Challenge #3: Sustainability: Where do we go from here? (cont.)
Slide 1. Getting to Zero and Sustaining Success: The Virginia Experience
Barbara Brown, Vice President
Virginia Hospital and Healthcare Association
May 8, 2012
Slide 2. Learning Objectives
To understand the challenges and successes the Commonwealth of Virginia experienced during the national collaborative in
- Reducing and sustaining its CLABSI rate
- Implementing the Comprehensive Unit-based Safety Program (CUSP)
Slide 3. Why Virginia?

- Maintained data submission rates well above others in the project
- Demonstrated sustained drop in CLABSI rates in both its cohorts
- Demonstrated improved adoption of CLABSI reduction strategies and CUSP steps over the course of the project
Slide 4. Virginia and the National Collaborative
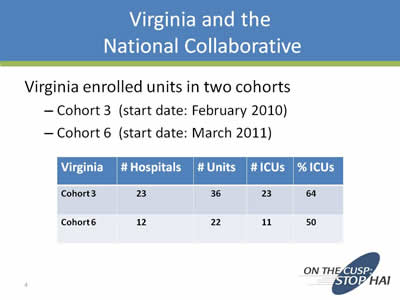
Virginia enrolled units in two cohorts
- Cohort 3 (start date: February 2010)
- Cohort 6 (start date: March 2011)
| Virginia | # Hospitals | # Units | # ICUs | % ICUs |
|---|---|---|---|---|
| Cohort 3 | 23 | 36 | 23 | 64 |
| Cohort 6 | 12 | 22 | 11 | 50 |
Slide 5. National CLABSI Collaborative: Challenges Every State Faced
- Getting the data submitted from your teams
- CLABSI data
- Team Checkup Tool data
- Reducing CLABSI rates and improving safety depends on
- Implementing technical changes
- Implementing CUSP to change culture
- Sustainability
Slide 6. Challenge #1: Data Submission VA CLABSI Data Submission, Cohort 3
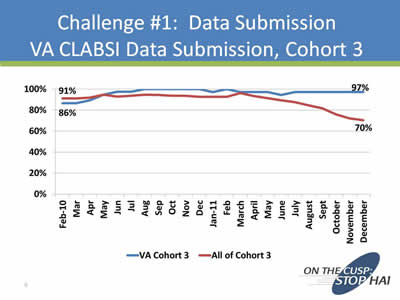
While data submission for all of Cohort 3 fell somewhat, moving from 90 percent in February 2010 to 70 percent in December 2011, data submission among Virginia Cohort 3 units remained high In February 2010, 86 percent of Virginia's Cohort 3 units submitted data, and the rates increased through 2010 and by December 2011 had remained high, at 97 percent.
Slide 7. Challenge #1: Data Submission VA CLABSI Data Submission, Cohort 6
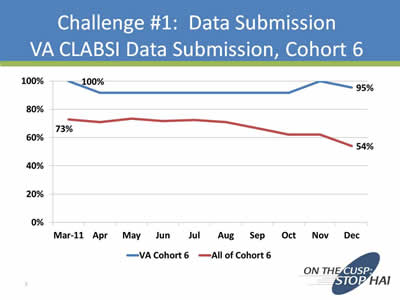
Rates of data submission among Virginia's Cohort 6 units remained consistently higher than the rest of the Cohort for March through December 2011 Virginia's Cohort 6 units achieved 100 percent data submission in March 2011 while the rate for all of Cohort 6 was only 73 percent In December 2011, 95 percent of Virginia's Cohort 6 teams submitted data, compared to a Cohort-wide rate of 54 percent.
Slide 8. Challenge #1: Data Submission VA TCT Submission, Cohort 3
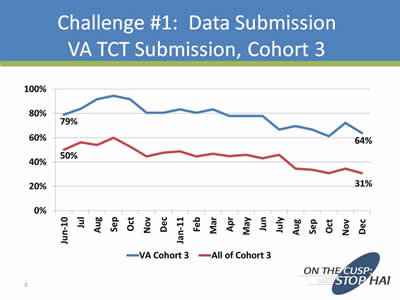
Team Checkup Tool submission proved to be challenging among all of Cohort 3, falling slightly from June 2010 to December 2011 While the slight, prolonged decrease is similar to trends across all of Cohort 3, Virginia's Cohort 3 Team Checkup Tool submission rates were consistently higher than those of Cohort 3 overall.
Slide 9. Challenge #1: Data Submission VA TCT Submission, Cohort 6
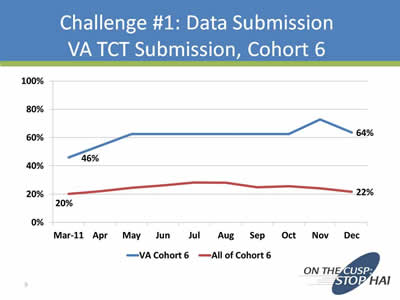
From March to December 2011, rates of Team Checkup Tool data submission among Virginia's Cohort 6 teams increased steadily from 46 percent to 64 percent Among the rest of Cohort 6, Team Checkup Tool data submission was at 20 percent in March 2011, increased slightly until August, and decreased slightly to end up at 22 percent in December.
Slide 10. Getting the Data Submitted: How did VA do it?
- Review of care counts submission reports
- Follow up with individual teams not submitting
- Identification of barriers
- Care counts training issues
- Staff changes on unit
- Not sure how to do Team Checkup Tool
Slide 11. Challenge #2: Reducing CLABSI Rates VA Cohort 3 CLABSI Rate Down 46%
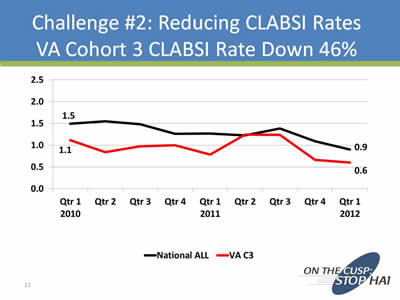
Among Virginia's Cohort 3 units, CLABSI rates decreased from 1.1 per 1,000 line days in the first quarter of 2010 to 0.6 per 1,000 line days in the first quarter of 2012 This is in line with a similar nationwide trend, in which rates dropped from 1.5 in the first quarter of 2010 to 0.9 by the first quarter of 2012.
Slide 12. Challenge #2: Reducing CLABSI Rates VA Cohort 6 CLABSI Rate Down 27%
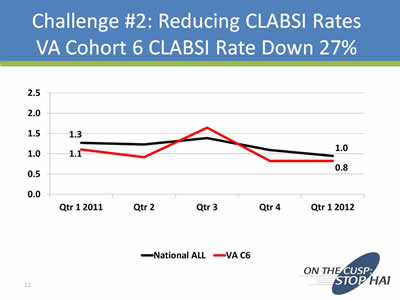
CLABSI rates among Virginia's Cohort 6 CLABSI teams fell 27 percent from 1.1 per 1,000 line days in the first quarter of 2011 to 0.8 in the first quarter of 2012 This echoed a similar nationwide decrease from 1.3 per 1,000 line days in the first quarter of 2011 to 1.0 in the first quarter of 2012.
Slide 13. Challenge #2: Rate Up for 2 Quarters; Reducing CLABSI Rates Not Smooth
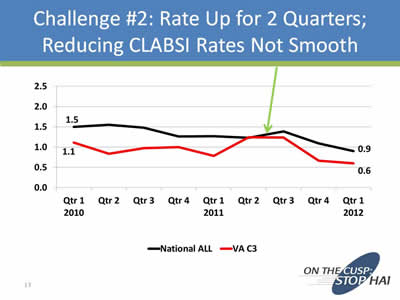
The decrease in CLABSI rates among Virginia's Cohort 3 teams from early 2010 to early 2012 had a bump along the way In the second and third quarters in 2011, there was a slight increase in CLABSIs.
Slide 14. Challenge #2: Reducing CLABSI Rates Trend Line Not Smooth
- What worked to get rates back on track?
- Identified and contacted “hot spot” units with more than one CLABSI in the past 6 months (e.g., one unit accounted for 25% of all CLABSI’s in a 6-month look back)
- Encouraged use of Learning from Defects Tool for individual CAUTI events
Slide 15. Challenge #2: Reducing CLABSI Rates Trend Line Not Smooth (cont.)
- What worked to get rates back on track?
- Team presentations of success stories (e.g., changing physician and nursing behavior)
- Looked at Team Checkup Tool data: What does the data tell us about our technical work with central lines?
Slide 16. Challenge #2: Reducing CLABSI Rates Using TCT Data: C3 Technical Work
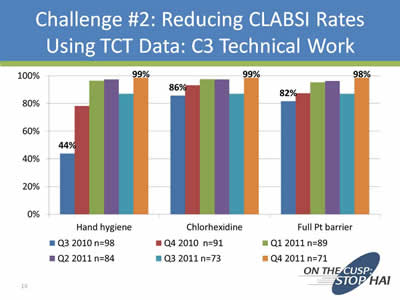
Virginia's Cohort 3 teams reviewed compliance on a quarterly basis with technical work toward reducing CLABSI, tracking data on hand hygiene, proper use of chlorhexidine, and full patient barriers.
Slide 17. Challenge #2: Reducing CLABSI Rates Using TCT Data: C3 Technical Work
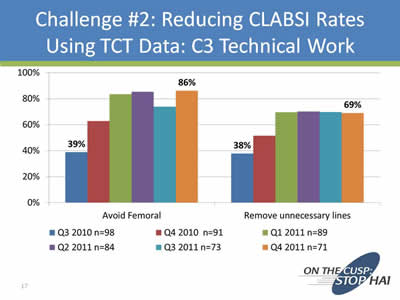
Virginia's Cohort 3 teams reviewed compliance on a quarterly basis with technical work toward reducing CLABSI, tracking data on avoidance of the femoral site and removal of unnecessary lines.
Slide 18. Challenge #2: Reducing CLABSI Rates Using TCT Data: Technical Work
- Data was robust: Excellent Team Checkup Tool submission
- Data was shared on coaching calls
- Opportunities were apparent
- Avoiding femoral insertion site
- Daily rounding for line necessity
Slide 19. Challenge #2: Improving Patient Safety Using TCT Data: C3 CUSP Work
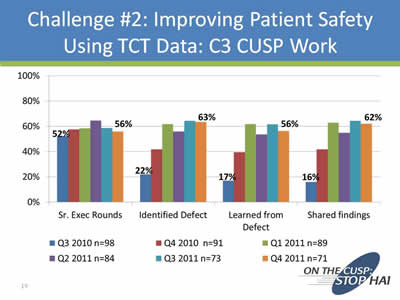
Virginia's Cohort 3 teams reviewed quarterly team check-up tool data on adaptive work toward reducing CLABSI, tracking data on use of senior executive rounds, identifying defects, learning from defects, and sharing findings of the LFD process.
Slide 20. Challenge #2: Improving Patient Safety Using TCT Data: CUSP Work
- Data was robust: Excellent Team Checkup Tool submission
- Data was shared on coaching calls
- Teams modeled CUSP on the calls
- Shared what defects they identified
- Shared how they implemented the Learning from Defects process
- Shared what they learned from drill down
Slide 21. Challenge #2: Improving Patient Safety
- Examples of team sharing
- Encouraging senior exec rounding
- Engaging nurses as patient advocates
- Educating patients and families re: HAIs in special populations (e.g., NICU)
- Sharing model checklists
- Rolling out project across disciplines (med staff, nursing staff, house officers, med students)
Slide 22. Challenge #2: Improving Patient Safety CUSP in action
Team Sharing Example: Shenandoah Hospital’s “Good Catch” Program
- Hospital leadership gives “good catch” pins to staff who identify and correct a patient safety near miss
- Wrong medication from contract pharmacy caught before delivery to patient
- Wheelchair assists booked in advance for unstable ambulatory patients
- Stretcher-locking mechanism failure noted and prevented patient fall
Slide 23. Challenge #2: Reducing CLABSI Rates Using TCT Data: C3 Barriers
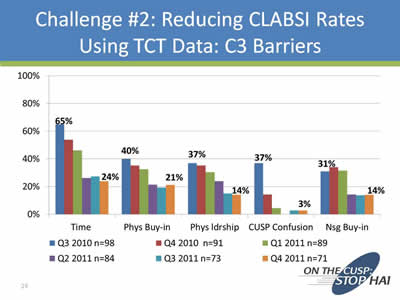
Quarterly Team Check-up Tool data collected from Virginia's Cohort 3 teams tracked a range of barriers in reducing CLABSI rates, including lack of time, lack of physician buy-in, lack of physician leadership, confusion around CUSP, and lack of nursing buy-in.
Slide 24. Challenge #2: Reducing CLABSI Rates Using TCT Data: Barriers
- Data was robust: Excellent TCT submission
- Data was shared on coaching calls
- “Barrier breakthroughs” shared:
- Teams informally shared strategies on calls
- Faculty shared tips on calls
- Formal presentations by model teams and faculty to address specific barriers
Slide 25 Challenge #3: Sustainability: Where do we go from here?
- Keep CLABSI reduction/patient safety on your radar
- Continue calls if possible
- Make it easy for teams to stay in touch
- Maintain a common site to share best practices, resources, FAQs, national updates
- Continue to share data trends
- Fold this work into your other quality/patient safety meetings (e.g., HEN work)
Slide 26 Challenge #3: Sustainability: Where do we go from here? (cont.)

- Remember: CUSP is the foundation that can drive all your improvement initiatives
- Not an “add-on” but a way of making care safer
- Steps and tools are applicable to any project


