Saving Lives and Saving Money: Hospital-Acquired Conditions Update
Final Data From National Efforts To Make Care Safer, 2010–2014
Summary
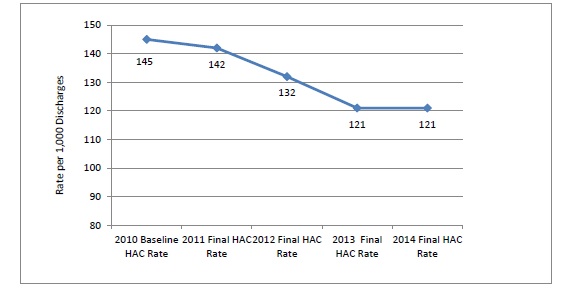
Final estimates for 2014 show a sustained 17 percent decline in hospital-acquired conditions (HACs) since 2010. A cumulative total of 2.1 million fewer HACs were experienced by hospital patients over the 4 years (2011, 2012, 2013, and 2014) relative to the number of HACs that would have occurred if rates had remained steady at the 2010 level. The measured final rate for 2014 held steady from 2013 at 121 HACs per 1,000 discharges, down from 145 in 2010. We estimate that nearly 87,000 fewer patients died in the hospital as a result of the reduction in HACs and that approximately $19.9 billion in health care costs were saved from 2010 to 2014.
Although the precise causes of the decline in patient harm are not fully understood, the increase in safety has occurred during a period of concerted attention by hospitals throughout the country to reduce adverse events. This effort has been spurred in part by Medicare payment incentives and catalyzed by the U.S. Department of Health and Human Services (HHS) Partnership for Patients (PfP) initiative.
Results
The methods for this 2014 update on the rates and counts of HACs and associated costs and deaths averted are unchanged from those previously described for 2010 to 2013. The details of these methods and the resulting data for the prior periods are online.1
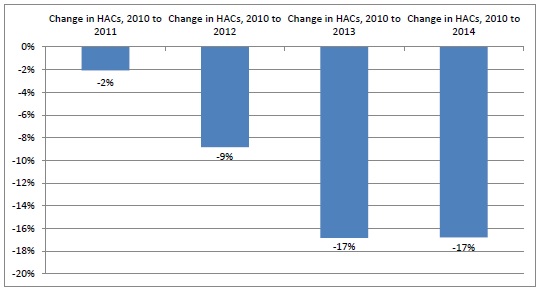
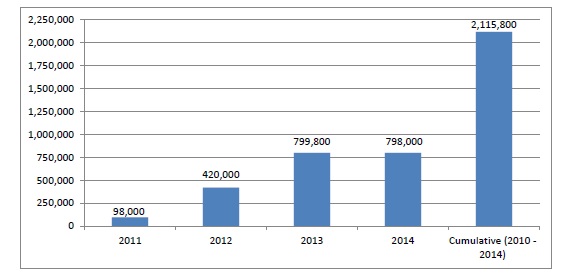
Final estimates for 2014 show the national HAC rate as being steady from 2013 to 2014 and 17 percent lower than in 2010 (see Exhibits 1 and 2). As a result of the reduction in the rate of HACs, we estimate that approximately 798,000 fewer incidents of harm occurred in 2014 than would have occurred if the rate of HACs had remained steady at the 2010 level (Exhibit 3).
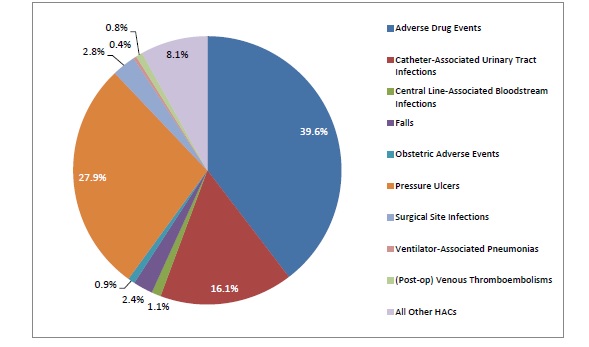
Cumulatively, approximately 2.1 million fewer incidents of harm occurred in 2011, 2012, 2013, and 2014 (compared with 2010). The data on the specific HACs included in this final 2014 summary are provided in Exhibit A1. About 40 percent of the overall reduction is from adverse drug events, about 28 percent from pressure ulcers, and about 16 percent from catheter-associated urinary tract infections (CAUTIs) (Exhibit 4). These HACs constituted about 34 percent, 27 percent, and 8 percent, respectively, of the HACs measured in the 2010 baseline rate (approximately 1.62 million, 1.3 million, and 400,000, respectively, out of approximately 4.76 million HACs, as seen in Exhibit A2).
Exhibit 2. Annual and Cumulative Changes in HACs, 2010 to 2014
Source: AHRQ National Scorecard Estimates from Medicare Patient Safety Monitoring System, National Healthcare Safety Network, and Healthcare Cost and Utilization Project.
Note: Percentages are rounded.
Exhibit 3. Total Annual and Cumulative HAC Reductions (Compared With 2010 Baseline)
Source: AHRQ National Scorecard Estimates from Medicare Patient Safety Monitoring System, National Healthcare Safety Network, and Healthcare Cost and Utilization Project.
Exhibit 4. Change in HACs, 2011–2014 (Total = 2,115,800)
Source: AHRQ National Scorecard Estimates from Medicare Patient Safety Monitoring System, National Healthcare Safety Network, and Healthcare Cost and Utilization Project.
Final 2014 estimates indicate that more than 36,000 fewer patients died in hospitals in 2014 as a result of the decline in HACs compared with the number of deaths that would have occurred if the rate of HACs had remained steady at the 2010 level (Exhibit 5). Most of the deaths averted occurred as a result of reductions in the rates of pressure ulcers and adverse drug events (ADEs), although declines in other HACs also contributed significantly to deaths averted (Exhibit 6).
Cumulative deaths averted from 2010 through 2014 are estimated at nearly 87,000. As shown in Exhibit A3, there is variation across types of HACs in the cost savings per HAC averted and in the level of increased mortality associated with the HAC. As a result of this variation, costs associated and deaths averted by HAC type, as shown in Exhibits 6 and 7, are not directly proportional to the HAC reductions shown in Exhibit 4.
Exhibit 5. Total Annual and Cumulative Deaths Averted (Compared With 2010 Baseline)
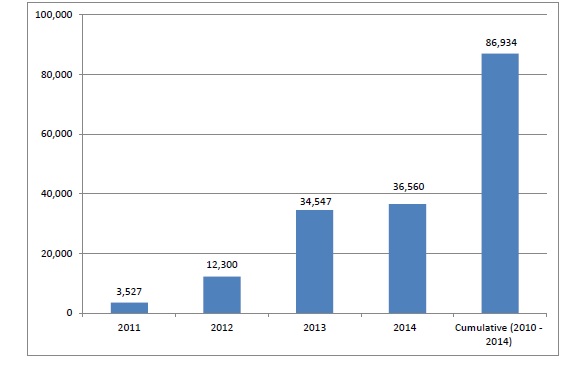
Exhibit 6. Estimated Deaths Averted by Hospital Acquired Condition (HAC), 2011–2014
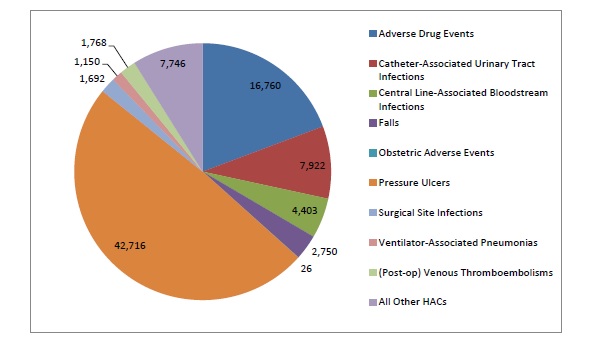
Note: The sum of the categories here differs slightly from the total shown in Exhibit 5 due to rounding.
Exhibit 7. Estimated Cost Savings, by Hospital-Acquired Condition (HAC), 2011–2014
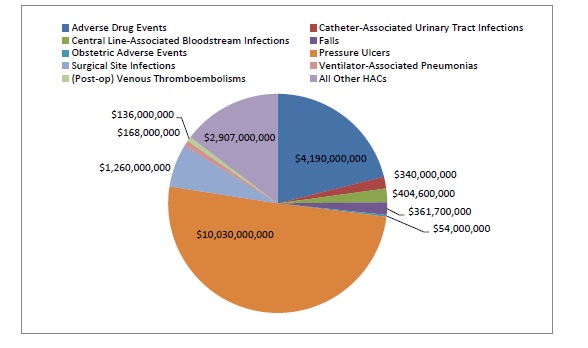
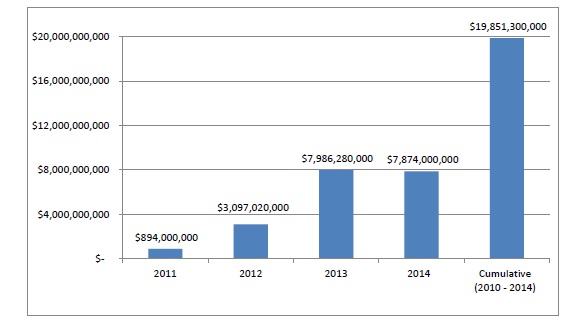
Final 2014 estimates show that the decline in HACs resulted in estimated cost savings of approximately $7.9 billion in 2014, about the same as in 2013. Estimated cumulative savings for 2011, 2012, and 2013 are approximately $19.9 billion (Exhibit 8).
Exhibit 8. Total Annual and Cumulative Cost Savings (Compared With 2010 Baseline), in Billions
Discussion
The estimated 17 percent reduction in HACs from 2010 to 2014 indicates that hospitals have made substantial progress in improving safety. An estimated 2.1 million fewer HACs were experienced by patients from 2010 to 2014 than would have occurred if the HAC rate had remained at the 2010 level.
The reasons for this progress are not fully understood. Likely contributing causes are financial incentives created by CMS and other payers’ payment policies, public reporting of hospital-level results, technical assistance offered by the QIO program to hospitals, and technical assistance and catalytic efforts of the HHS PfP initiative led by CMS.
Numerous other public and private initiatives to improve healthcare quality and patient safety were implemented during these years; for example, the widespread implementation and improved use of electronic health records at hospitals.2 And crucially, the progress was made possible by the results of investments made by the Agency for Healthcare Research and Quality in producing evidence about how to make care safer, investing in tools and training to catalyze improvement, and investing in data and measures to be able to track change.
Much more work still remains, even with the 17 percent decline in the HACs we have measured for the PfP since 2010. The final 2014 HAC rate of 121 HACs per 1,000 discharges is the same as was seen in 2013, and it means that in 2013 and 2014 almost 10 percent3 of hospitalized patients experienced one or more of the HACs we measured. That rate is still too high.
Prevention of approximately 87,000 deaths in the 2011 to 2014 period as a result of the decline in HACs, with approximately 70,000 of these deaths averted in 2013 and 2014 alone, is encouraging. As indicated in the results section in the Final 2013 report,4 the estimate of deaths averted is less precise than the estimated reduction in HAC rates. We directly estimate the size of the reduction in HAC rates but rely on analysis from other researchers of the complex relationship between HACs and mortality to extrapolate the impact of the reduction in HACs on deaths averted.
The estimates used in our analysis originate from a variety of sources and methodologies. Similarly, we estimate an associated reduction of $19.9 billion in health care costs from 2011 to 2014 as a result of the reduction in HACs, with nearly $16 billion of those cost savings occurring in 2013 and 2014. As is the case for the estimate of deaths averted, there is less precision regarding the cost savings estimates than there is about the estimates of the magnitude of reduction in HACs. Even with less precision, the estimates of deaths averted and cost savings are compelling.
Despite the progress to date in reducing HACs, much work remains to be done to ensure that the U.S. health care system is as safe as it can possibly be. The HAC rate for 2014 is 17 percent less than 2010, but it is also unchanged from 2013. HHS and other public and private partners are continuing to work to improve patient safety. These data from 2013 and 2014 indicate that it is possible to make substantial progress in reducing virtually all types of HACs simultaneously.
CMS and HHS leaders have termed this objective as achieving "Safety Across the Board" and believe it should be a national goal. In September 2015, a new group of Hospital Engagement Networks was selected for funding by CMS and their work following up on the Partnership for Patients has begun.5 CMS has funded a new initiative focusing on improving the quality of outpatient health care, which is named the Transforming Clinical Practices Initiative,6 and its work promises to make improvements in this area.
AHRQ’s patient safety programs continue to enable and guide improvements in health care delivery. In addition to sustaining further improvements in the safety of hospital care, the Agency has substantially expanded its efforts in order to extend the success that hospitals have achieved to all health care settings. As part of this initiative, AHRQ is actively targeting current challenges such as diagnostic error and antibiotic resistance, and creating knowledge that will sustain national progress in making health care safer.
Appendix: Incidence of Hospital-Acquired Conditions in the Partnership for Patients: Estimates and Projected and Measured Impact
Exhibit A1 provides the 2014 data on HACs. The HACs that are the focus of the PfP initiative are shown, as well as the source of the data and the corresponding measures related to each HAC. The rate for 2014 is 121 HACs per 1,000 discharges, which is a 17 percent reduction from the 2010 baseline of 145 HACs per 1,000 discharges before the start of the PfP initiative.7
Exhibit A1. Final 2014 AHRQ National Scorecard Data on HACs
| PfP Hospital-Acquired Conditions | Final 2014 PFP HACs | |||
|---|---|---|---|---|
| Partnership for Patients Hospital-Acquired Condition | Source (and Data Year) | Measure | PfP HACs (Normalized to 32,750,000 Discharges—Based on 2010 Baseline) | PfP Measured HACs per 1,000 Discharges |
| ADEs | MPSMS (2014) | ADE Associated With Digoxin | 10,000 | 0.32 |
| MPSMS (2014) | ADE Associated With Hypoglycemic Agents | 780,000 | 23.8 | |
| MPSMS (2014) | ADE Associated With IV Heparin | 200,000 | 6.0 | |
| MPSMS (2014) | ADE Associated With Low Molecular Weight Heparin and Factor Xa Inhibitor | 250,000 | 7.6 | |
| MPSMS (2014) | ADE Associated With Warfarin | 120,000 | 3.7 | |
| MPSMS (2014) | Total ADE (rounded sum of above 5 measures) | 1,360,000 | 41.4 | |
| CAUTIs | MPSMS (2014) | Catheter-Associated Urinary Tract Infections | 250,000 | 7.6 |
| CLABSIs | MPSMS (2014) | Blood Stream Infections Associated With Central Venous Catheters | 5,000 | 0.2 |
| Falls | MPSMS (2014) | In-Hospital Patient Falls | 260,000 | 7.9 |
| Obstetric Adverse Events | PSI (2014) | OB Trauma in Vaginal Delivery With (PSI 18) and Without Instrument (PSI 19) | 74,000 | 2.3 |
| Pressure Ulcers | MPSMS (2014) | Hospital-Acquired Pressure Ulcers | 1,010,000 | 30.9 |
| Surgical Site Infections | NHSN (2014) | SSIs for 17 selected procedures | 81,000 |
2.5 |
| VAPs | MPSMS (2014) | Ventilator-Associated Pneumonia | 38,000 | 1.2 |
| VTEs | MPSMS (2014) | Postoperative Venous Thromboembolic Events | 16,000 | 0.49 |
| All Other Hospital-Acquired Conditions | MPSMS (2014) | Femoral Artery Puncture for Catheter Angiographic Procedures | 74,000 | 2.3 |
| MPSMS (2014) | Adverse Events Associated With Hip Joint Replacements | 19,000 | 0.59 | |
| MPSMS (2014) | Adverse Events Associated With Knee Joint Replacements | 16,000 | 0.50 | |
| MPSMS (2014) | Contrast Nephropathy Associated With Catheter Angiography | 270,000 | 8.3 | |
| MPSMS (2014) | Hospital-Acquired MRSA | 17,000 | 0.52 | |
| MPSMS (2014) | Hospital-Acquired VRE | 11,000 | 0.34 | |
| MPSMS (2014) | Hospital-Acquired Antibiotic-Associated C. difficile | 93,000 | 2.8 | |
| MPSMS (2014) | Mechanical Complications Associated With Central Venous Catheters | 120,000 | 3.6 | |
| MPSMS (2014) | Postoperative Cardiac Events for Cardiac and Non-Cardiac Surgeries | 34,000 | 1.0 | |
| MPSMS (2014) | Postoperative Pneumonia | 71,000 | 2.2 | |
| PSI (2014) | Iatrogenic Pneumothorax (PSI 6) | 12,000 | 0.36 | |
| PSI (2014) | Post-Op Hemorrhage or Hematoma (PSI 9) | 19,000 | 0.59 | |
| PSI (2014) | Post-Op Respiratory Failure (PSI 11) | 53,000 | 1.6 | |
| PSI (2014) | Accidental Puncture or Laceration (PSI 15) | 56,000 | 1.7 | |
| MPSMS (2014) and PSI (2014) | Total All Other HACs (sum of above 14 measures) | 865,000 | 26.4 | |
|
Final Total 2014 PfP HACs and HACs per 1,000 discharges (rounded) |
3,959,000 | 121 | ||
Source: AHRQ National Scorecard Estimates from Medicare Patient Safety Monitoring System, National Healthcare Safety Network, and Healthcare Cost and Utilization Project.
Exhibit A2 shows the summary results for 2010 and 2014 after measurement of HACs was implemented and measured values replaced the baseline estimates shown in Exhibit A1 for 2010.
The final cost savings and death reductions estimated for 2014 in Exhibit A2 are based on the measured 2010 and 2014 HACs and the estimated rates shown in Exhibit A3 as to the additional cost per HAC and the additional inpatient mortality per HAC.
As noted in the 2013 final report (see footnote 7), the overall measurement strategy for the PfP was published in the Journal of Patient Safety in September 2014,8 and specific details as to how the HAC data and rates shown were acquired and calculated was posted starting in May 2014 on the AHRQ Web site; methods and data are online (see footnote 1).
Exhibit A3 contains projections of the estimated impact of the initiative that would be launched in April 2011 as the Partnership for Patients. Several projections were needed for each of the types of hospital-acquired conditions (HACs) that were selected for special focus. For each HAC, the incidence, preventability, cost, and additional mortality were assessed and a goal was set as to the percentage of preventable HACs to be prevented.9
The basis of the derivation of the overall 44 percent preventability estimate (which corresponds to the previously referenced 2010 Office of Inspector General estimate) is shown in Exhibit A3, as is the basis for the PfP goal of a 40 percent reduction in preventable HACs. Also shown is the estimate that, if 44 percent were considered preventable, the overall PfP goal to prevent 40 percent of preventable HACs would result in reducing the overall rate of HACs by approximately 17.6 percent.
Complete references to the documents accessed to make these assessments and projections, organized by HAC type, are provided at the end of the 2013 final report (see footnote 7).
Exhibit A2. AHRQ National Scorecard HACs for 2014 vs. 2010, and Projected 2014 Cost Savings and Reductions in Deaths Associated With HACs
|
PfP Hospital-Acquired Condition |
2010 Measured Baseline for HACs (Rounded) |
Final 2014 Measured HACs (Rounded) |
Measured Reduction in HACs (2010 vs. 2014) |
Percent Reduction in Measured HACs (From 2010 to 2014) |
Final Projection of Cost Savings in 2014: Based on Measured Reductions of HACs in 2014 vs. 2010, and Baseline Projections Made in 2011 on the Additional Cost per HAC |
Final Projection of Reductions in Deaths in 2014: Based on Measured Reductions of HACs in 2014 vs. 2010, and Baseline Projections Made in 2011 on the Additional Inpatient Mortality per HAC |
|---|---|---|---|---|---|---|
|
Adverse Drug Events |
1,621,000 |
1,360,000 |
261,000 |
16% |
$1,305,000,000 |
5,220 |
|
Catheter-Associated Urinary Tract Infections |
400,000 |
250,000 |
150,000 |
38% |
$150,000,000 |
3,495 |
|
Central Line-Associated Bloodstream Infections |
18,000 |
5,000 |
13,000 |
72% |
$221,000,000 |
2,405 |
|
Falls |
260,000 |
260,000 |
0 |
0% |
$0 |
0 |
|
Obstetric Adverse Events |
82,000 |
74,000 |
8,000 |
10% |
$24,000,000 |
12 |
|
Pressure Ulcers |
1,320,000 |
1,010,000 |
310,000 |
23% |
$5,270,000,000 |
22,444 |
|
Surgical Site Infections |
96,000 |
81,000 |
15,000 |
16% |
$315,000,000 |
423 |
|
Ventilator- Associated Pneumonias |
38,000 |
38,000 |
0 |
0% |
$0 |
0 |
|
(Post-op) Venous Thromboembolisms |
28,000 |
16,000 |
12,000 |
43% |
$96,000,000 |
1,248 |
|
All Other HACs |
894,000 |
865,000 |
29,000 |
3% |
$493,000,000 |
1,314 |
|
Totals |
4,757,000 |
3,959,000 |
798,000 |
17% |
$7,874,000,000 |
36,560 |
Note: For Final Projection of Reductions in Deaths in 2014, the sum of the categories does not add exactly to the total shown due to rounding.
Exhibit A3. Estimates, Goals, and Projections for HACs at the Launch of PfP initiative in 2011
|
PfP Hospital- Acquired Condition |
Estimated U.S. National Incidence of HACs (2010) |
Estimated HAC Preventability as of 2010/2011 |
PfP Goal at Launch of Program (Percentage of Preventable HACs) |
Combined Goal for HAC Reduction (Preventability x Goal) |
PfP HAC Reduction Goal (Fewer HACs in 2014* vs. 2010 Baseline) |
Estimated PfP Additional Cost* per HAC |
Estimated PfP Additional Inpatient Mortality per HAC |
Projected PfP Cost Savings in 2014 if 2014 Goal Met |
Projected Reductions in Deaths Associated With HACs in 2014 if 2014 Goal Met |
|---|---|---|---|---|---|---|---|---|---|
|
Adverse Drug Events |
1,900,000 |
50% |
50% |
25% |
475,000 |
$5,000 |
.020 |
$2,375,000,000 |
9,500 |
|
Catheter-Associated Urinary Tract Infections |
530,000 |
40% |
50% |
20% |
106,000 |
$1,000 |
.023 |
$106,000,000 |
2,470 |
|
Central Line-Associated Bloodstream Infections |
40,000 |
50% |
50% |
25% |
10,000 |
$17,000 |
.185 |
$170,000,000 |
1,850 |
|
Falls |
200,000 |
25% |
50% |
12.5% |
25,000 |
$7,234 |
.055 |
$180,850,000 |
1,375 |
|
Obstetric Adverse Events |
380,000 |
30% |
50% |
15% |
57,000 |
$3,000 |
.0015 |
$171,000,000 |
84 |
|
Pressure Ulcers |
250,000 |
50% |
50% |
25% |
62,500 |
$17,000 |
.072 |
$1,062,500,000 |
4,525 |
|
Surgical Site Infections |
110,000 |
35% |
20% |
7% |
7,700 |
$21,000 |
.028 |
$161,700,000 |
217 |
|
Ventilator- Associated Pneumonias |
40,000 |
50% |
50% |
25% |
10,000 |
$21,000 |
.144 |
$210,000,000 |
1,438 |
|
(Post-op) Venous Thrombo- embolisms |
100,000 |
40% |
50% |
20% |
20,000 |
$8,000 |
.104 |
$160,000,000 |
2,080 |
|
All Other HACs |
2,430,000 |
44% |
25% |
11% |
267,300 |
$17,000 |
.045 |
$4,544,100,000 |
12,109 |
|
Totals |
5,980,000 |
44.1% |
39.3% |
17.4% |
1,040,500 |
NA |
NA |
$9,141,150,000 |
35,647 |
1 AHRQ Partnership for Patients Web page for methods and data.
2 A paper by Furukawa, et al. indicated that in 2012 and 2013, adverse events were less frequent at hospitals that have implemented a full EHR. Although the paper did not study trends in EHR adoption or trends in adverse event rates, one may hypothesize that part of the HAC reduction seen from 2010 to 2013 and 2014 could have been partially due to increased EHR adoption and increases and improvements in EHR use.
3 The rate of 121 HACs per 1,000 discharges does not equate to 12.1% of patients experiencing HACs because some patients experience more than one HAC during an inpatient hospital stay. Based on prior experience reviewing HAC data, the 121 HACs per 1,000 discharges are probably experienced by fewer than 100 patients among 1,000 discharges (10 percent of inpatients).
4 2013 Annual Hospital-Acquired Condition Rate and Estimates available online.
7 2010 baseline data is online.
8 Abstract is available.
9 In 2011, this work was completed using the best available information to generate 2010 incidences and other information regarding the HACs. The sources of the estimates were identified based primarily on peer-reviewed articles published through early 2011. Other sources included reports and other information from HHS and other federally sponsored programs, as well as expert opinions. After these estimates were made, processes were established to measure and estimate national HACs starting with a 2010 measured baseline (4,757,000 HACs). In order to produce consistent estimates of cost savings and deaths averted for 2010 to 2013, the per-HAC estimates established for the costs and deaths associated with HACs in 2011 have not been modified.


