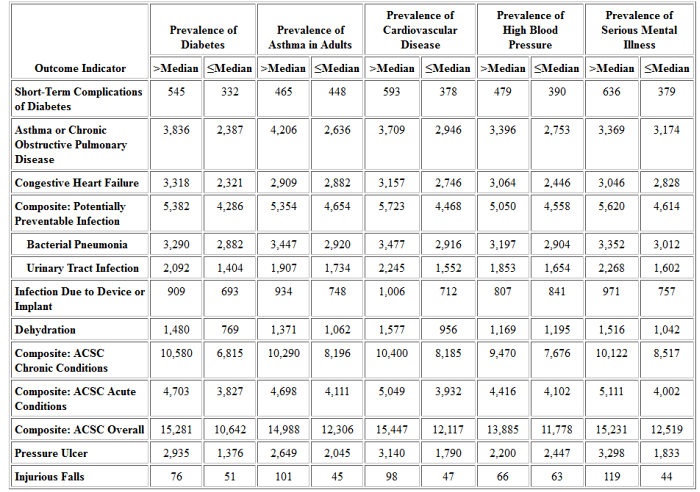
Table 17: Outcome Indicators by State Prevalence of Chronic Conditions, 2005a
Select for:
- Table 17A: National HCBS Population.
- Table 17B: Dually Eligible HCBS Participants.
- Table 17D: I/DD Subpopulation.
- Table 17E: SMI Subpopulation.
- Table 17F: HCBS Population Ages 18-64 Without I/DD or SMI.
- Table 17G: HCBS Population Age 65+.
Select the table to go to the text version. ↓
| Outcome Indicator | Prevalence of Diabetes |
Prevalence of Asthma in Adults |
Prevalence of Cardiovascular Disease |
|||
|---|---|---|---|---|---|---|
| >Median | ≤Median | >Median | ≤Median | >Median | ≤Median | |
| Short-Term Complications of Diabetes | 545 | 332 | 465 | 448 | 593 | 378 |
| Asthma or Chronic Obstructive Pulmonary Disease | 3,836 | 2,387 | 4,206 | 2,636 | 3,709 | 2,946 |
| Congestive Heart Failure | 3,318 | 2,321 | 2,909 | 2,882 | 3,157 | 2,746 |
| Composite: Potentially Preventable Infection | 5,382 | 4,286 | 5,354 | 4,654 | 5,723 | 4,468 |
| Bacterial Pneumonia | 3,290 | 2,882 | 3,447 | 2,920 | 3,477 | 2,916 |
| Urinary Tract Infection | 2,092 | 1,404 | 1,907 | 1,734 | 2,245 | 1,552 |
| Infection Due to Device or Implant | 909 | 693 | 934 | 748 | 1,006 | 712 |
| Dehydration | 1,480 | 769 | 1,371 | 1,062 | 1,577 | 956 |
| Composite: ACSC Chronic Conditions | 10,580 | 6,815 | 10,290 | 8,196 | 10,400 | 8,185 |
| Composite: ACSC Acute Conditions | 4,703 | 3,827 | 4,698 | 4,111 | 5,049 | 3,932 |
| Composite: ACSC Overall | 15,281 | 10,642 | 14,988 | 12,306 | 15,447 | 12,117 |
| Pressure Ulcer | 2,935 | 1,376 | 2,649 | 2,045 | 3,140 | 1,790 |
| Injurious Falls | 76 | 51 | 101 | 45 | 98 | 47 |
| Outcome Indicator | Prevalence of High Blood Pressure |
Prevalence of Serious Mental Illness |
||
|---|---|---|---|---|
| >Median | ≤Median | >Median | ≤Median | |
| Short-Term Complications of Diabetes | 479 | 390 | 636 | 379 |
| Asthma or Chronic Obstructive Pulmonary Disease | 3,396 | 2,753 | 3,369 | 3,174 |
| Congestive Heart Failure | 3,064 | 2,446 | 3,046 | 2,828 |
| Composite: Potentially Preventable Infection | 5,050 | 4,558 | 5,620 | 4,614 |
| Bacterial Pneumonia | 3,197 | 2,904 | 3,352 | 3,012 |
| Urinary Tract Infection | 1,853 | 1,654 | 2,268 | 1,602 |
| Infection Due to Device or Implant | 807 | 841 | 971 | 757 |
| Dehydration | 1,169 | 1,195 | 1,516 | 1,042 |
| Composite: ACSC Chronic Conditions | 9,470 | 7,676 | 10,122 | 8,517 |
| Composite: ACSC Acute Conditions | 4,416 | 4,102 | 5,111 | 4,002 |
| Composite: ACSC Overall | 13,885 | 11,778 | 15,231 | 12,519 |
| Pressure Ulcer | 2,200 | 2,447 | 3,298 | 1,833 |
| Injurious Falls | 66 | 63 | 119 | 44 |
ACSC = ambulatory care-sensitive condition; HCBS = home and community-based services; I/DD = intellectual and development disabilities; SMI = serious mental illness.
a. All outcome indicators expressed as potentially avoidable hospital stays per 100,000 persons in the HCBS population. HCBS population for outcome indicators excludes: individuals under age 18; people with only institutional use in a given quarter; people on managed care plans; and persons in the States of Arizona, Maine, Washington, and Wisconsin.
Dually eligible = dually eligible for Medicaid and Medicare. Eligibility for Medicare defined as inclusion in Medicare denominator file.
Medicaid only = part of Medicaid HCBS population but not enrolled in Medicare.
HCBS subpopulations of I/DD, SMI, Under 65 Without I/DD or SMI, and 65+ are defined as in the Appendix.
Median is defined as the value at which half of States are below and half of States are above.
Source for Outcome Indicators: Agency for Healthcare Research and Quality (AHRQ), Medicaid Analytic eXtract (MAX) data, and Medicare Provider Analysis and Review (MedPAR) data.
Sources for column heading data are described in the Appendix.


