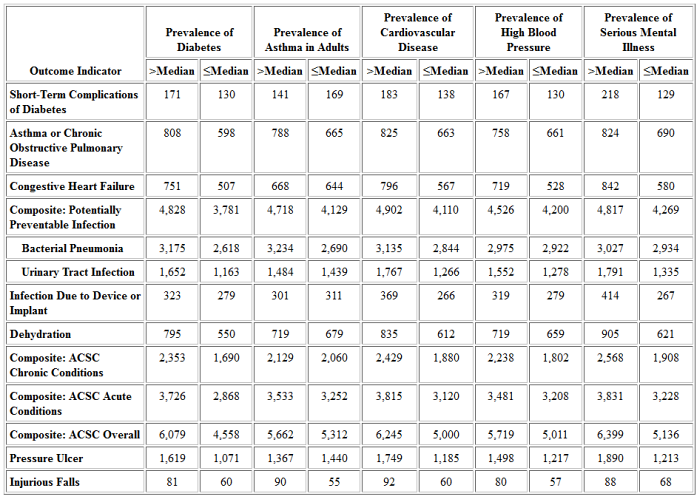
Table 17: Outcome Indicators by State Prevalence of Chronic Conditions, 2005a
Select for:
- Table 17A: National HCBS Population.
- Table 17B: Dually Eligible HCBS Participants.
- Table 17C: Medicaid-Only HCBS Participants.
- Table 17E: SMI Subpopulation.
- Table 17F: HCBS Population Ages 18-64 Without I/DD or SMI.
- Table 17G: HCBS Population Age 65+.
Select the table to go to the text version. ↓
| Outcome Indicator | Prevalence of Diabetes |
Prevalence of Asthma in Adults |
Prevalence of Cardiovascular Disease |
|||
|---|---|---|---|---|---|---|
| >Median | ≤Median | >Median | ≤Median | >Median | ≤Median | |
| Short-Term Complications of Diabetes | 171 | 130 | 141 | 169 | 183 | 138 |
| Asthma or Chronic Obstructive Pulmonary Disease | 808 | 598 | 788 | 665 | 825 | 663 |
| Congestive Heart Failure | 751 | 507 | 668 | 644 | 796 | 567 |
| Composite: Potentially Preventable Infection | 4,828 | 3,781 | 4,718 | 4,129 | 4,902 | 4,110 |
| Bacterial Pneumonia | 3,175 | 2,618 | 3,234 | 2,690 | 3,135 | 2,844 |
| Urinary Tract Infection | 1,652 | 1,163 | 1,484 | 1,439 | 1,767 | 1,266 |
| Infection Due to Device or Implant | 323 | 279 | 301 | 311 | 369 | 266 |
| Dehydration | 795 | 550 | 719 | 679 | 835 | 612 |
| Composite: ACSC Chronic Conditions | 2,353 | 1,690 | 2,129 | 2,060 | 2,429 | 1,880 |
| Composite: ACSC Acute Conditions | 3,726 | 2,868 | 3,533 | 3,252 | 3,815 | 3,120 |
| Composite: ACSC Overall | 6,079 | 4,558 | 5,662 | 5,312 | 6,245 | 5,000 |
| Pressure Ulcer | 1,619 | 1,071 | 1,367 | 1,440 | 1,749 | 1,185 |
| Injurious Falls | 81 | 60 | 90 | 55 | 92 | 60 |
| Outcome Indicator | Prevalence of High Blood Pressure |
Prevalence of Serious Mental Illness |
||
|---|---|---|---|---|
| >Median | ≤Median | >Median | ≤Median | |
| Short-Term Complications of Diabetes | 167 | 130 | 218 | 129 |
| Asthma or Chronic Obstructive Pulmonary Disease | 758 | 661 | 824 | 690 |
| Congestive Heart Failure | 719 | 528 | 842 | 580 |
| Composite: Potentially Preventable Infection | 4,526 | 4,200 | 4,817 | 4,269 |
| Bacterial Pneumonia | 2,975 | 2,922 | 3,027 | 2,934 |
| Urinary Tract Infection | 1,552 | 1,278 | 1,791 | 1,335 |
| Infection Due to Device or Implant | 319 | 279 | 414 | 267 |
| Dehydration | 719 | 659 | 905 | 621 |
| Composite: ACSC Chronic Conditions | 2,238 | 1,802 | 2,568 | 1,908 |
| Composite: ACSC Acute Conditions | 3,481 | 3,208 | 3,831 | 3,228 |
| Composite: ACSC Overall | 5,719 | 5,011 | 6,399 | 5,136 |
| Pressure Ulcer | 1,498 | 1,217 | 1,890 | 1,213 |
| Injurious Falls | 80 | 57 | 88 | 68 |
ACSC = ambulatory care-sensitive condition; HCBS = home and community-based services; I/DD = intellectual and development disabilities; SMI = serious mental illness.
a. All outcome indicators expressed as potentially avoidable hospital stays per 100,000 persons in the HCBS population. HCBS population for outcome indicators excludes: individuals under age 18; people with only institutional use in a given quarter; people on managed care plans; and persons in the States of Arizona, Maine, Washington, and Wisconsin.
Dually eligible = dually eligible for Medicaid and Medicare. Eligibility for Medicare defined as inclusion in Medicare denominator file.
Medicaid only = part of Medicaid HCBS population but not enrolled in Medicare.
HCBS subpopulations of I/DD, SMI, Under 65 Without I/DD or SMI, and 65+ are defined as in the Appendix.
Median is defined as the value at which half of States are below and half of States are above.
Source for Outcome Indicators: Agency for Healthcare Research and Quality (AHRQ), Medicaid Analytic eXtract (MAX) data, and Medicare Provider Analysis and Review (MedPAR) data.
Sources for column heading data are described in the Appendix.


