Using Quality Measures to Drive Improvement: Lessons from the CHIPRA Quality Demonstration
Presentation for the National Academy of State Health Policy’s Vanguard Network and CHIP Directors
Slide 1

Using Quality Measures to Drive Improvement: Lessons from the CHIPRA Quality Demonstration
Presentation for the National Academy of State Health Policy's Vanguard Network and CHIP Directors
September 21, 2015
Cindy Brach, MPP • Grace Anglin, MPH • Kyra Chamberlain, MS, RN • David Kelley, MD, MPA
Slide 2

Agenda
- Welcome and introductions
- Cindy Brach, MPP, Senior Health Policy Researcher, Agency for Healthcare Research and Quality.
- Overview of states' strategies and lessons learned
- Grace Anglin, MPH, Researcher, Mathematica Policy Research Inc.
- Maine's approach
- Kyra Chamberlain, MS, RN, CHIPRA Project Director, University of Southern Maine.
- Pennsylvania's approach
- David Kelley, MD, MPA, Chief Medical Officer, Pennsylvania Department of Public Welfare.
- Q&A session.
Slide 3

Housekeeping
- Please mute your phone.
- Do not put us on hold; hang up and dial back in if you need to take another call.
- Ask questions
- Submit questions throughout the presentation via the chat feature.
- During the Q&A, feel free to jump in with questions or "raise your hand".
Slide 4

Overview of States' Strategies and Lessons Learned
Slide 5

CHIPRA Quality Demonstration Program
- Congressionally mandated in 2009
- $100 million program.
- One of the largest federal efforts to focus on child health care.
- Five-year grants awarded by CMS
- February 2010 - February 2015, with some extensions.
- 6 grants: Multi-state partnerships.
- National evaluation
- CMS funding, AHRQ oversight.
- August 2010 – September 2015.
- Mathematica, Urban Institute, AcademyHealth.
Slide 6

Demonstration grantees* and partnering states implemented 52 projects across 5 topic areas
The chart shows the projects implemented by 18 States (the 10 CHIPRA demonstration grantee States and their partners) in rows across five topic areas: measures, health information technology, service delivery, EHR model format, and other.
Slide 7

States' Quality Measure and Reporting Strategies
Calculate measures
↓
Use measures to drive QI:
- Report results to stakeholders.
- Align QI priorities.
- Support provider-level improvement.
↓
Improve quality of care
This figure illustrates that states aimed to calculate measures then use those measures to drive quality improvement and, as a result, improve the quality of care. The figure also indicates that states used measures to drive quality improvement by (1) reporting results to stakeholders, (2) aligning quality improvement priorities, and (3) supporting provider-level improvement.
Slide 8

Reporting Results to Stakeholders
- Goals
- Document and be transparent about performance.
- Allow comparisons across states, regions, and health plans.
- Identify QI priorities and track improvement over time.
- CHIPRA state strategies
- Produce reports from various sources.
- Administrative data (Medicaid claims, immunization registries).
- Practice data (manual chart reviews, EHRs)
- Develop reports for different audiences: policymakers, health plans, providers, public.
Slide 9

Reporting Results to Stakeholders
- Lessons learned
- Seek feedback from intended audience during design phase.
- Short reports that use graphics to display information are easier to digest.
- Budget adequate resources to adjust specifications for practice-level reporting.
"Measure reports [have] been useful for disseminating information about what's going on and what needs to be worked on. [Performance on] all of the measures hasn't been great, so bringing awareness to those areas has been a great opportunity for the State." —Florida Demonstration Staff
Slide 10

Aligning QI Priorities
- Goals
- Foster system-level reflection.
- Set the stage for collective action.
- Create a powerful incentive for providers to improve care.
- CHIPRA state strategies
- Formed multistakeholder quality improvement workgroups.
- Encouraged consistent quality reporting standards across programs.
- Required managed care organizations to meet quality benchmarks.
Slide 11

Aligning QI Priorities
- Lessons learned
- Familiarizing stakeholders with the measures and gaining consensus on priorities sometimes proved challenging.
- Focusing discussions and reports on state priorities and context helped facilitate conversations.
- Several factors influenced QI priorities.
- Measure alignment with existing initiatives and priorities.
- Room for improvement.
- Data quality.
- Cost and burden of tracking performance.
Slide 12

Supporting Provider-Level Improvement
- Goals
- Help providers interpret quality reports and track performance.
- Help providers identify QI priorities and design QI activities.
- Encourage behavior change and use of evidence-based practices among providers.
- CHIPRA state strategies
- Technical support
- Hosted learning collaboratives.
- Provided individualized technical assistance.
- Financial support
- Provided stipends or embedded staff.
- Paid providers for reporting measures and demonstrating improvement.
- Changed reimbursement to support improvements.
- Technical support
Slide 13

Supporting Provider Improvement
- Lessons learned
- Disappointing initial results were common; may have reflected performance and/or documentation.
- State-produced reports are helpful for identifying QI priorities but less useful for guiding and assessing QI projects
- Long delays in claims processing.
- Infrequent reporting periods.
- Helping practices run reports from their charts or EHRs provided them more real time information to track QI efforts.
"Getting feedback from someone outside [of the practice] is really the only way you can improve . . . When it comes to ourselves, we have tunnel vision." — North Carolina Practice Manager
Slide 14

Supporting Provider Improvement
- Lessons learned
- Several factors encouraged providers to make and sustain meaningful changes
- Choosing their own QI topics.
- Focusing on one or just a few measures at a time.
- Engaging the entire care team in reviewing measures and planning changes.
- Fostering a healthy rivalry between providers.
- Receiving reimbursement for related services.
- Several factors encouraged providers to make and sustain meaningful changes
"Everybody has to understand that change is not one person's job, it is the practice's job." — South Carolina Physician
Slide 15

Maine's Approach: Using Multistakeholder Groups to Engage Policymakers and Practices
Slide 16

Project Context
- Measurement work of Maine's CHIPRA Grant built off longstanding cooperative agreement between Maine DHHS and University of Southern Maine's Muskie School of Public Service
- Technical assistance and data analytic support using longitudinal data warehouse.
- Program evaluation and monitoring for Maine's Medicaid program.
- Calculating CMS-416 measures and producing periodic, practice-level Utilization Review and Primary Care Performance Incentive Program (PCPIP) reports.
- CHIPRA supported the collaboration of health systems, providers, State agencies, non-profit groups, and consumers to build an infrastructure for meaningful and robust child health quality measurement.
Slide 17

Project Overview
- Original multi-stakeholder Measures and Practice Improvement Committee formed to explore and obtain feedback on child health quality measures.
- Maine Child Health Improvement Partnership formed to identify and coordinate efforts to use measures to drive quality improvement
- Workgroup structure
- Comprised of health systems, practices, child advocacy organizations, professional associations, public and private payers, and the public health system.
- Met every 6 months.
- Workgroup structure
- CHIPRA activities
- Developed and periodically revised Master List of Pediatric Measures.
- Disseminated annual reports on statewide performance on child-focused measures.
- Encouraged measure alignment.
- Identified QI priorities and potential solutions.
Slide 18

Project Overview
- Supported the Maine Child Health Improvement Partnership
- Member of the National Improvement Partnership Network.
- Mission is to initiate and support measurement-based activities to enhance child health care improvement.
- CHIPRA activities
- Hosted 3 rounds of 9-month learning collaboratives to improve performance on measures related to immunizations, developmental screening, oral health, and healthy weight.
- Advised Maine's public reporting program on child-health priorities and measures.
Slide 19

Project Outputs
- Increased monitoring of child-focused measures.
- Changed billing policies to support quality improvement
- PCPs can bill for oral health evaluations.
- Relaxed frequency providers can bill for oral health evaluations.
- New billing modifier distinguishes between global developmental and autism screenings.
- Engaged 12-34 practices in each learning collaborative
- Practices demonstrated improvements, most notably on developmental screening and immunizations.
Slide 20

Project Outcomes
Increases in developmental screening rates for practices participating in Maine's developmental screening learning collaborative.
The figure shows increases in developmental screening rates for practices participating in Maine's developmental screening learning collaborative. The seven practices submitting data for children ages 6 to 12 months increased their rates from 46 percent in May 2012 to 97 percent in November 2012. Nine practices submitting data for children ages 18 to 23 months increased their rates from 22 percent in May 2012 to 71 percent in November 2012. Nine practices submitting data for children ages 24 to 35 months increased their rates from 22 percent in May 2012 to 58 percent in November 2012.
Note: Maine analyzed data for participating practices that submitted chart data for review.
Slide 21

Project Outcomes
Changes in standardized screenings for developmental, behavioral, and social delays for all children enrolled in Medicaid and CHIP.
The figure shows changes in standardized screenings for developmental, behavioral, and social delays for all children enrolled in Medicaid and CHIP in Maine. The screening rates for children from birth to year one increased from 2 percent in 2011 to 3 percent in 2012 to 13 percent in 2013 and to 19 percent in 2014. The screening rates for children aged one to two years increased from 3 percent in 2011 to 6 percent in 2012 to 17 percent in 2013 and to 26 percent in 2014. The screening rates for children aged two to three years increased from 1 percent in 2011 to 2 percent in 2012 to 12 percent in 2013 and remained constant at 12 percent in 2014.
Slide 22

Project Outcomes
Increases in immunization rates for practices participating in Maine's First STEPS Phase 1 learning collaborative from August 2011 to November 2013.
The figure shows increases in immunization rates for practices participating in Maine's First STEPS Phase 1 learning collaborative from August 2011 to November 2013. During this period, the immunization rate increased gradually from 74.2 percent in August 2011 to 77.2 percent in April 2012, 79.3 percent in September 2012, 81.3 percent in December 2012, 81.5 percent in June 2013, and to 85.3 percent in November 2013.
Slide 23

Lessons Learned
- Statewide improvement on quality measures required:
- Broad stakeholder involvement.
- Variety of strategies.
- Broad stakeholder involvement in priority-setting increased buy in for QI activities.
- Changes in quality measures may reflect:
- Improvements in quality of care.
- Improvements in documentation and billing of services.
- Billing changes or clarifications improved data quality and encouraged practice change.
Slide 24

Lessons Learned
- Measures to assess practice QI activities were selected based on:
- Relevance to the QI topic and project objectives.
- Availability of baseline data.
- Feasibility of reliably collecting data.
- Providers must trust and understand data to use it for QI
- Explain differences in measure specifications and rate calculations.
- Educate practices on how and when to use each type of data or quality measure.
- Help practices read, interpret, and use practice-level reports for QI efforts.
- Piloting changes with a subset of practices led to statewide changes
- Statewide rates for developmental screening continued to rise after 2011.
- Maine rose from #16 to #1 nationally for 2 Year Old Vaccine Rates (NIS 2014).
Slide 25

Pennsylvania's Approach: Paying providers for reporting measures and demonstrating improvement
Slide 26

Pennsylvania Medical Assistance
- Mandatory managed care.
- Over 1.1 million children covered by Medicaid.
- Managed Care Organizations reporting both HEDIS® and Pennsylvania Performance measures.
- Quality measures and consumer report card published annually http://www.dhs.state.pa.us/publications/healthchoicespublications/
- Over 5,800 providers participating in Medicaid Meaningful Use electronic health record (EHR) program.
- CHIPRA grantees included five high volume pediatric serving health systems, one small rural health system, and a FQHC.
- Grantees were at widely different phases of EHR implementation.
Slide 27

Project Overview
- Two health systems worked with PA Department of Human Services to establish process of extraction and reporting of quality measures.
- Based on a standardized process, five other provider organizations reported measures annually to PA.
- Measures had to be reported directly from the provider organization's EHR.
| Performance year | Requirement for payment | Payment level | Annual cap | Qualifying measures |
|---|---|---|---|---|
| Base year | Reporting | $10,000 per measure | $180,000 per provider | Any Child Core Set measure |
| Subsequent years | Demonstrate improvement | $5,000 per percentage point improvement | $25,000 per measure; $100,000 per provider | 8 high priority measures |
Slide 28

Project Overview
| High priority measures | |
|---|---|
| Childhood immunization status | Adolescent immunization status |
| Well-child visits in the first 15 months of life | Well-child visits in the 3rd, 4th, 5th, and 6th years of life |
| Developmental screening in the first 3 years of life | Adolescent well-care visit |
| Percentage of eligibles that received preventive dental services | Weight assessment and counseling for nutrition and physical activity for children/adolescents: Body mass index assessment for children/ adolescents |
Slide 29

Project Outcomes
- PA paid $935,000 in incentive payments, ranging from $65,000 to $260,000 per provider organization
- Participating provider organizations
- Reported on 10 to 18 Child Core Set Measures.
- Demonstrated improvement on measures.
- Childhood immunization status.
- Body mass index assessment.
- Well-child visits.
- Dental preventive care.
- Participating provider organizations
- Providers were engaged in quality reporting and QI.
Slide 30

Project Outcomes
| Pay for Performance Measure | Average rate of improvement across grantees |
|---|---|
| Immunizations | |
| Childhood | 10.5% |
| Adolescent | 3.1% |
| Developmental screening in the first three years of life | 13.8% |
| Body Mass Index Assessment | 5.0% |
| Well Child Visits | |
| First fifteen months of life | 8.65% |
| Children aged 3-6 years | 5.0% |
| Adolescents | 3.5% |
| Preventive dental services | 10.2% |
Slide 31

Project Outcomes
Child-serving Physicians' Reported Experiences with and Attitudes Toward Quality Reporting
The figure shows that child-serving physicians in participating health systems (n = 52) report more experience with and more positive attitudes toward quality reporting than physicians outside participating health systems. Among physicians in participating systems, 76 percent reported generating internal quality reports, 86 percent felt that quality reports are effective, 92 percent reported receiving external quality reports, and 88 percent reported pursuing quality improvement efforts in the previous 2 years, compared with 42 percent, 72 percent, 87 percent, and 78 percent, respectively, for practices outside participating systems.
* = statistically significant difference (p < 0.05)
Source: Survey of child-serving physicians
Slide 32

Lessons Learned
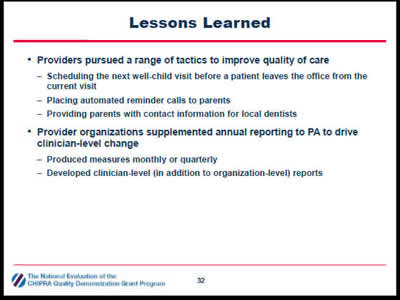
- Providers pursued a range of tactics to improve quality of care
- Scheduling the next well-child visit before a patient leaves the office from the current visit.
- Placing automated reminder calls to parents.
- Providing parents with contact information for local dentists.
- Provider organizations supplemented annual reporting to PA to drive clinician-level change
- Produced measures monthly or quarterly.
- Developed clinician-level (in addition to organization-level) reports.
Slide 33

Lessons Learned
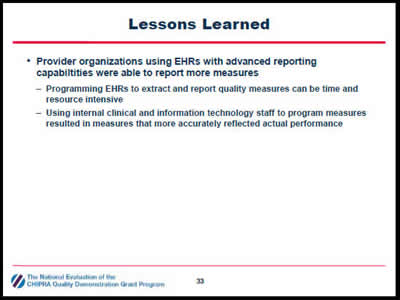
- Provider organizations using EHRs with advanced reporting capabiltities were able to report more measures
- Programming EHRs to extract and report quality measures can be time and resource intensive.
- Using internal clinical and information technology staff to program measures resulted in measures that more accurately reflected actual performance.
Slide 34

Q&A
Slide 35

For More Information
- Visit the National Evaluation website
- Contact the speakers
- Cindy Brach (patientsafety@dha.mil)
- Grace Anglin (GAnglin@mathematica-mpr.com)
- Kyra Chamberlain (kyra.chamberlain@maine.edu)
- David Kelley (c-dakelley@pa.gov)


