Putting Quality Measures to Work: Lessons from the CHIPRA Quality Demonstration Grant Program
Presentation for the Association of Medicaid Medical Directors
Slide 1

Putting Quality Measures to Work: Lessons from the CHIPRA Quality Demonstration Grant Program
Presentation for the Association of Medicaid Medical Directors
September 24, 2015
Cindy Brach, M.P.P. • Joe Zickafoose, M.D., M.S. • Francis Rushton, M.D., F.A.A.P. • David Kelley, M.D., M.P.A.
Slide 2

Agenda
- Welcome and introductions
- Cindy Brach, M.P.P., Senior Health Policy Researcher, Agency for Healthcare Research and Quality (AHRQ).
- Overview of states' strategies and lessons learned
- Joe Zickafoose, M.D., M.S., Senior Researcher, Mathematica Policy Research.
- South Carolina's approach
- Francis E. Rushton, Jr., M.D., F.A.A.P., Medical Director, South Carolina Quality Through Technology and Innovation in Pediatrics (QTIP).
- Pennsylvania's approach
- David Kelley, M.D., M.P.A., Chief Medical Officer, Pennsylvania Department of Public Welfare.
- Q&A session.
Slide 3

CHIPRA Quality Demonstration Grant Program
- Congressionally mandated by the Children's Health Insurance Program Reauthorization Act of 2009 (CHIPRA)
- $100 million program
- One of the largest federally funded efforts to focus on health care for children
- Five-year grants awarded by CMS
- 10 grants, including multi-State partnerships (18 States total)
- February 2010–February 2015, with some extensions
- $9 to $11 million per grantee
- National evaluation
- CMS funding, AHRQ oversight
- August 2010–September 2015
- Mathematica, Urban Institute, AcademyHealth
Slide 4

Overview of States' Strategies and Lessons Learned
Joe Zickafoose
Slide 5

Demonstration Grantees* and Partnering States
The chart shows the projects implemented by 18 States (the 10 CHIPRA demonstration grantee States and their partners) in rows across five topic areas: measures, health information technology, service delivery, EHR model format, and other.
Slide 6

States' Measurement and Reporting Strategies
- Report results to stakeholders
- Align QI priorities
- Support provider-level improvement
The figure illustrates that states aimed to calculate measures then use those measures to drive quality improvement and, as a result, improve the quality of care. The figure also indicates that states used measures to drive quality improvement by (1) reporting results to stakeholders, (2) aligning quality improvement priorities, and (3) supporting provider-level improvement.
Slide 7

Reporting Results to Stakeholders
- Goals
- Document and be transparent about performance
- Make it possible to compare states, regions, and health plans
- Identify QI priorities and track improvement over time
- CHIPRA state strategies
- Produce reports from:
- Administrative data (Medicaid claims, immunization registries)
- Practice data (manual chart reviews, EHRs)
- Develop reports for different audiences: policymakers, health plans, providers, the public
- Produce reports from:
Slide 8

Reporting Results to Stakeholders
- Lessons learned
- Adjusting specifications for practice-level reporting takes significant time and resources
- Seek feedback from the intended audience during the design phase
- Short reports with graphic display of information are easier to interpret
Slide 9

Aligning QI Priorities
- Goals
- Foster reflection across agencies and departments
- Set the stage for collective action
- Create a powerful incentive for providers to improve care
- CHIPRA state strategies
- Formed multi-stakeholder quality improvement workgroups
- Encouraged consistent quality reporting standards across programs
- Required managed care organizations to meet quality benchmarks
Slide 10

Aligning QI Priorities
- Lessons learned
- Challenging to familiarize stakeholders with the measures and gain consensus on priorities
- Helped to focus discussions and reports on State priorities & context
- Several factors influenced QI priorities
- How well measures aligned with existing initiatives and priorities
- How much room for improvement on a measure
- Quality of data needed to produce measures
- How much time and funding was needed to track performance
Slide 11

Supporting Provider-Level Improvement
- Goals
- Help providers interpret quality reports and track performance
- Help providers identify QI priorities and design QI activities
- Encourage behavior change and use of evidence-based practices
- CHIPRA State strategies
- Technical support
- Learning collaboratives
- Individualized technical assistance
- Technical support
- Financial support
- Paid providers for reporting measures and demonstrating improvement
- Changed reimbursement practices to support improvements
Slide 12

Helping Providers Improve
- Lessons learned
- It was common for practices to have disappointing results at first
- May have reflected performance, documentation, or both
- State-produced reports are helpful for identifying QI priorities, but less useful for guiding and assessing QI projects
- Long delays in claims processing
- Infrequent reporting periods
- Helping practices run reports from their charts or EHRs gave them more real-time information they could use to track QI efforts
- Accurate reports require accurate documentation
- It was common for practices to have disappointing results at first
Slide 13

Supporting Provider Improvement
- Lessons learned
- Several factors encouraged providers to make and sustain meaningful changes
- Choosing their own QI topics
- Focusing on one or just a few measures at a time
- Engaging entire care team in reviewing quality measures and planning changes
- Fostering a healthy rivalry within and between practices
- Receiving reimbursement for related services
- Several factors encouraged providers to make and sustain meaningful changes
Slide 14

Q&A
Slide 15

South Carolina's Approach: Engaging pediatric practices in quality improvement
Francis Rushton
Slide 16

Engaging Pediatricians in Quality: The South Carolina Experience
SC QTIP
Quality through Technology and Innovation in Pediatrics
Lynn Martin
Francis Rushton
Slide 17

How QTIP Worked with Practices and Stakeholders
Pediatric Practices
- 18 practices selected
- Each practice identified a QI team lead: practitioner, nurse and office manager
- 4 year commitment
Plan-Do-Study-Act Cycles
- Practices document quality improvement work
Maintenance of Certification
- Physicians can earn Part IV MOC credit on QI work
Regular Contact
- Monthly conference calls
- Blog (where data and QI minutes are also posted)
Learning Collaborative
- Semiannual sessions attended by QI team
- All 24 Original CHIPRA Core measures addressed over 4 years
- Quality measures presented, expert speakers, PCMH and behavioral health concepts, information sharing, etc.
Site Visits
- QTIP team technical assistance site visits
- Peer reviewer participation
- Academic detailing
- Mental Health education and community resource meetings
- Quality Improvement coaching
Slide 18

CHIPRA Core Measures
- ADHD management.
- Development screening.
- Well-Child visit completion early.
- Well-Child visit completion middle.
- Well-Child visit completion Adol.
- Adol vaccines (HPV).
- Chlamydia screening.
- Dental visits.
- Preventive dental visits.
- BMI.
- Mental health follow up.
- Access.
- Family centered care/ family experience.
- Central line infections.
- Childhood vaccine rates.
- Use of strep test for pharyngitis.
- C-Section rate.
- Less than 2,500 gm birthweight.
- Freq. of perinatal care.
- Onset of prenatal care.
- ER visitation rates.
- Asthma ER visitation rates.
- Asthma medication.
- Suicide evaluation in depressed patients.
Slide 19

Documentation of work on core measures
Image: This bar chart displays counts of plan-do-study-act (PDSA) cycles documented by pediatric primary care practices participating in the South Carolina demonstration project focused on quality improvement for the Core Set of Child Health Care Quality Measures. The y-axis represents counts. The x-axis displays time from January 2011 through December 2014, and each bar represents counts for a specific PDSA cycle topic. The total number of PDSA cycles was 1,545.
Slide 20

Core Quality Measures Questionnaire: Rated Most Useful by Providers
| Core Measure | Usefulness |
|---|---|
| Adolescent Well-Care Visits | 100.00% |
| Follow-Up Care for Children Prescribed ADHD Medication | 100.00% |
| Preventive Dental Services | 100.00% |
| BMI Assessment for Children/Adolescents | 100.00% |
| Developmental Screening in First Three Years | 96.67% |
| Immunization Status-Childhood and Adolescents | 96.67% |
| Well-Child Visits—15 months and 3rd–6th Years | 96.67% |
| Children’s and Adolescents’ Access to Primary Care | 93.33% |
| Dental Treatment Services | 93.33% |
| Chlamydia Screening | 90.00% |
| Ambulatory Care-Emergency Department Visits | 86.60% |
The table displays percentages of physicians who responded to the South Carolina "Core quality Measures Questionnaire" and rated the listed measures as "useful." 86 percent or more of respondents considered the 11 quality measures in the table useful.
Slide 21

Significant Trends-in Selected CHIPRA Core Measures from CY2011–2013 Within Intervention Practices
Significance: *p-value < 0.05, ** p-value < 0.01, *** p-value < 0.001
| Measure | Category | 2011 Rate | 2012 Rate | 2013 Rate | p-value |
|---|---|---|---|---|---|
| Annual Dental Visits | ADV - Rate - Total | 71.4 | 72.3 | 72.2 | 0.0420* |
| Adolescent Well-Care Visits | AWC - Reported Rate | 50.7 | 54.9 | 60.9 | 0.0000*** |
| Weight Assessment and Counseling for Nutrition and Physical Activity for Children/Adolescents | Reported Rate - BMI Percentile- Total | 1.2 | 1.9 | 12.7 | 0.0000*** |
| Children and Adolescents' Access to Primary Care Practitioners | CAP - Rate – 7-11 Years | 93.6 | 94.8 | 94.8 | 0.0045** |
| Children and Adolescents' Access to Primary Care Practitioners | CAP - Rate - 12-19 Years | 95.8 | 96.3 | 97.3 | 0.0000*** |
| Developmental Screening -screened by 12 months of age | DSC1 - Reported Rate | 12.6 | 17.9 | 27.7 | 0.0000*** |
| Developmental Screening -screened by 24 months of age | DSC2 - Reported Rate | 9.4 | 16.3 | 31.8 | 0.0000*** |
| Developmental Screening -screened by 36 months of age | DSC3 - Reported Rate | 1.6 | 3.6 | 10.6 | 0.0000*** |
| Total Eligible Who Received Preventive Dental Services | PDS - Reported Rate | 57.3 | 59.6 | 58.8 | 0.0000*** |
| Well-Child Visits in the First 15 Months of Life | W15 - Six or More Visits Rate | 41.9 | 41.8 | 53.0 | 0.0000*** |
| Well-Child Visits in the Third, Fourth, Fifth and Sixth Years of Life | W34 - Reported Rate | 65.6 | 67.6 | 70.5 | 0.0000*** |
The table displays trends for performance on quality measures by South Carolina primary care practices participating in the demonstration for the years 2011, 2012, and 2013. For the 11 measures included in the table, there were statistically significant increases in the level of performance.
Slide 22

Proactive Vision for Pediatric Quality
If you could only have 10 parameters
- Be able to identify a Primary Care Provider
- Be ready for school upon entry to kindergarten
- Screened for developmental delays
- Linked to a dental home and receiving basic oral health services
- Up to date in receiving pediatric well-child care
- Screened and evaluated for obesity
- Screened for mental health conditions including substance abuse, domestic violence and family mental illness
- Receive mental health services when indicated
- With special health care needs will have their care coordinated
- With asthma will be managed effectively and control maximized
Slide 23

Broad Focus on Quality
- Simultaneously focusing on acute, chronic, preventive
- 24 Core CHIPRA Indicators topically are a pretty good list
- We added Behavioral Health Issues and PCMH
- Plan to introduce all of these indicators to our practices over 4 years. Have the opportunity to work with the same 18 practices for 4 years
- Grassroots control, they don't have to work on every indicator and how they work on them is up to each practice
- About half of the CHIPRA CORE Measures achieve resonance with our practices
Slide 24

Broad Focus on Quality
- CHIPRA core measures topically work well, but individually most have to be adapted for outpatient pediatric QI
- What can be measured at the state level is not necessarily what practices need for outpatient QI
- Focusing on multiple QI indicators at one time is stressful for our practices, but we think in the long run it is achieving better improvements in practice and greater interest in the process
- NCQA PCMH process is very cumbersome and we have had difficulty addressing this need in a learning collaborative format
Slide 25

Significant Investment Needed to Start Statewide Pediatric QI in SC
Skill Building
- Teaching model for improvement
- Developing QI teams at the same level
- Multiple contacts
- Twice a year learning collaborative session
- Twice a year technical assistance visits
- Ongoing blog conversation
- Monthly conference calls
- Twice a year academic detailing
- Stipends
- ABP MOC IV credit. We have portfolio status, given over 200 certifications to date
- Lays groundwork for NCQA PCMH Standard 6
- CME credit for winter learning session
- Networking opportunity
- Provide data
Slide 26

Partnership with State AAP Chapter
- Essential. SC AAP was very helpful in engaging pediatricians
- SC AAP helps with academic oversight, allows us to use some of their meetings for information sharing
- Our learning collaborative sessions are linked to state chapter meetings where pediatricians usually congregate
- Working on a workshop with AAP for practice staff
Slide 27

Who do I ask for more information?
- More information at https://msp.scdhhs.gov/qtip/
Or contact
Lynn Martin, LMSW
Project Director
803 898 0093 martinly@scdhhs.gov
Francis Rushton, MD, FAAP
Medical Director
843 441 3368; 205 290 5557 ferushton@gmail.com; frushton@aap.net
Kristine Hobbs, LMSW
Mental Health Coordinator
803 898 2719 hobbs@scdhhs.gov
Donna Strong, MPH, PCMH CCE
Quality Improvement Specialist 803 898 2043 strongd@scdhhs.gov
Slide 28

Q&A
Slide 29

Pennsylvania's Approach: Paying providers for reporting measures and demonstrating improvement
David Kelley
Slide 30

Pennsylvania Medical Assistance
- Mandatory managed care.
- Over 1.1 million children covered by Medicaid.
- Managed Care Organizations reporting both HEDIS® and Pennsylvania Performance measures.
- Quality measures and consumer report card published annually http://www.dhs.state.pa.us/publications/healthchoicespublications/
- Over 5,800 providers participating in Medicaid Meaningful Use electronic health record (EHR) program.
- CHIPRA grantees included five high volume pediatric serving health systems, one small rural health system, and a FQHC.
- Grantees were at widely different phases of EHR implementation.
Slide 31

Project Overview
- Two health systems worked with PA Department of Human Services to establish process of extraction and reporting of quality measures.
- Based on a standardized process, five other provider organizations reported measures annually to PA.
- Measures had to be reported directly from the provider organization's EHR.
| Performance year | Requirement for payment | Payment level | Annual cap | Qualifying measures |
|---|---|---|---|---|
| Base year | Reporting | $10,000 per measure | $180,000 per provider | Any Child Core Set measure |
| Subsequent years | Demonstrate improvement | $5,000 per percentage point improvement | $25,000 per measure; $100,000 per provider | 8 high priority measures |
The table at the bottom of the slide displays a summary of Pennsylvania's requirements for the quality measure pay-for-reporting and pay-for-improvement program, including the performance year, requirement for payment, payment level, annual cap, and qualifying measures.
Slide 32
Project Overview
| High priority measures | |
|---|---|
| Childhood immunization status | Adolescent immunization status |
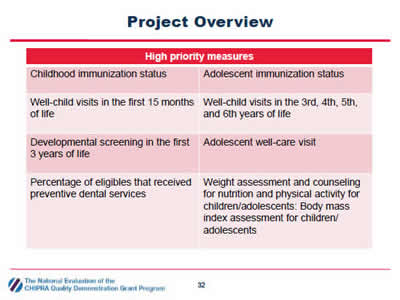
| Well-child visits in the first 15 months of life | Well-child visits in the 3rd, 4th, 5th, and 6th years of life |
| Developmental screening in the first 3 years of life | Adolescent well-care visit |
| Percentage of eligibles that received preventive dental services | Weight assessment and counseling for nutrition and physical activity for children/adolescents: Body mass index assessment for children/ adolescents |
The table lists the 8 child health care quality measures targeted by Pennsylvania's pay-for-improvement program.
Slide 33
Project Outcomes
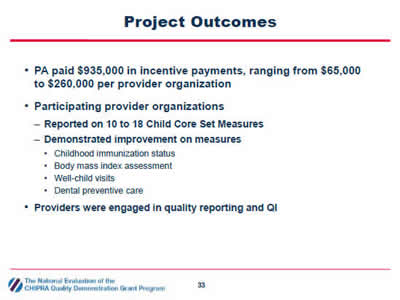
- PA paid $935,000 in incentive payments, ranging from $65,000 to $260,000 per provider organization
- Participating provider organizations
- Reported on 10 to 18 Child Core Set Measures
- Demonstrated improvement on measures
- Childhood immunization status
- Body mass index assessment
- Well-child visits
- Dental preventive care
- Providers were engaged in quality reporting and QI
Slide 34
Project Outcomes
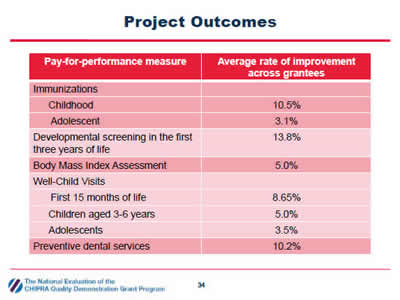
| Pay-for-performance measure | Average rate of improvement across grantees |
|---|---|
| Immunizations | |
| Childhood | 10.5% |
| Adolescent | 3.1% |
| Developmental screening in the first three years of life | 13.8% |
| Body Mass Index Assessment | 5.0% |
| Well Child Visits | |
| First 15 months of life | 8.65% |
| Children aged 3-6 years | 5.0% |
| Adolescents | 3.5% |
| Preventive dental services | 10.2% |
The table displays the average improvement on the 8 priority child health care quality measures by participating health systems.
Slide 35

Project Outcomes
Child-Serving Physicians' Reported Experiences with and Attitudes Toward Quality Reporting
Image: The bar chart displays results from a survey of child-serving physicians in Pennsylvania about experiences and attitudes toward quality reporting. The y-axis displays the percent response ranging from 0 to 100 percent. The bars compare survey responses from physicians in health systems that participated in Pennsylvania's demonstration project (n=52) with physicians outside participating health systems (n=178).
- 75.7 percent of physicians in participating health systems reported generating internal quality reports compared to 42.2 percent of physicians outside participating health systems.
- 85.2 percent of physicians in participating health systems felt quality reports are effective for improving quality of care compared to 72.2 percent of physicians outside participating health systems.
- 88.3 percent of physicians in participating health systems reported a quality improvement effort in the last 2 years compared to 78.4 percent of physicians outside participating health systems.
* = Statistically significant difference (p < 0.05).
Source: Survey of child-serving physicians.
Slide 36
Lessons Learned
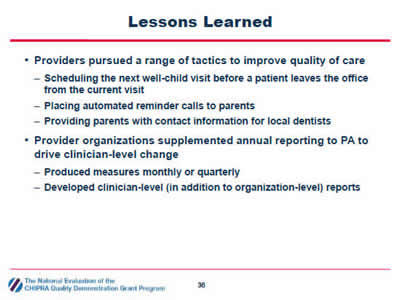
- Providers pursued a range of tactics to improve quality of care
- Scheduling the next well-child visit before a patient leaves the office from the current visit
- Placing automated reminder calls to parents
- Providing parents with contact information for local dentists
- Provider organizations supplemented annual reporting to PA to drive clinician-level change
- Produced measures monthly or quarterly
- Developed clinician-level (in addition to organization-level) reports
Slide 37
Lessons Learned
- Provider organizations that used EHRs with advanced reporting capabilities were able to report more measures
- Programming EHRs to extract and report quality measures can be time- and resource-intensive
- Using internal clinical and information technology staff to program measures resulted in measures that more accurately reflected actual performance
Slide 38
Q&A
Slide 39
National Evaluation Website
http://www.ahrq.gov/policymakers/chipra/demoeval/index.html
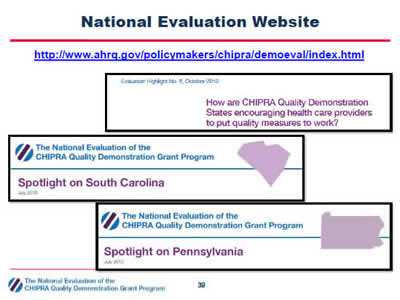
This slide displays the internet URL for the national evaluation web page and images from the title pages of three documents posted on the web page relevant to this presentation: an issue brief titled "How are CHIPRA Quality Demonstration States encouraging health care providers to put quality measures to work?" and summaries ("spotlights") on the demonstration activities in South Carolina and Pennsylvania.
Slide 40

For More Information
- Contact the speakers
- Cindy Brach (Cindy.Brach@ahrq.hhs.gov)
- Joe Zickafoose (JZickafoose@mathematica-mpr.com)
- Francis Rushton (ferushton@gmail.com)
- David Kelley (c-dakelley@pa.gov)


