Advanced Methods in Delivery System Research - Planning, Executing, Analyzing, and Reporting Research on Delivery System Improvement
Webinar #3: Logic Models (Slide Presentation)
Presenter: Dana Petersen, PhD
Discussant: Todd Gilmer, PhD
Moderator: Michael I. Harrison, PhD
Sponsored by AHRQ's Delivery System Initiative in partnership with the AHRQ PCMH program.
Slide 1
Advanced Methods in Delivery System Research –Planning, Executing, Analyzing, and Reporting Research on Delivery System Improvement
Webinar #3: Logic Models
Presenter: Dana Petersen, PhD
Discussant: Todd Gilmer, PhD
Moderator: Michael I. Harrison, PhD
Sponsored by AHRQ's Delivery System Initiative in partnership with the AHRQ PCMH program.
June 4, 2013
Slide 2
Speaker Introductions
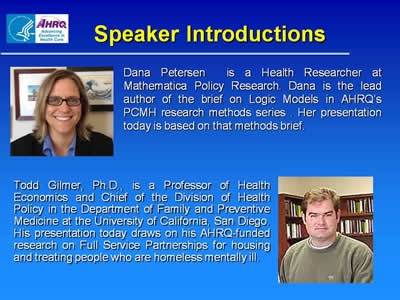
Dana Petersen is a Health Researcher at Mathematica Policy Research. Dana is the lead author of the brief on Logic Models in AHRQ’s PCMH research methods series. Her presentation today is based on that methods brief.
Todd Gilmer, Ph.D., is a Professor of Health Economics and Chief of the Division of Health Policy in the Department of Family and Preventive Medicine at the University of California, San Diego. His presentation today draws on his AHRQ-funded research on Full Service Partnerships for housing and treating people who are homeless mentally ill.
Images of Dr. Petersen and Dr. Gilmer are also shown on this slide.
Slide 3
The Logic Model: A Foundation to Implement, Study, and Refine Patient-Centered Medical Home (PCMH) Models
June 4, 2013
AHRQ Advanced Methods Webinar
Dana Petersen -- Erin Fries Taylor -- Deborah Peikes
Mathematica Policy Research
Slide 4
Acknowledgements
- David Meyers and Jan Genevro (AHRQ) for commissioning the methods brief from which this presentation is derived.
- Source – Petersen D, Taylor EF, Peikes D. Logic Models: The Foundation to Implement, Study, and Refine Patient-Centered Medical Home Models. Rockville, MD: Agency for Healthcare Research and Quality, February 2013. AHRQ Publication No. 13-0029-EF.
- Available for download from pcmh.ahrq.gov.
Slide 5
Outline of Presentation
- Definition and Elements
- Purposes and Users
- How to Build a Logic Model
- Applicability to PCMH (Medical Home) Models
- Advantages and Limitations
Slide 6
Definition: What is a Logic Model?
- A graphical depiction that shows:
- Necessary resources and inputs.
- Intervention activities and processes.
- Intermediate and ultimate outcomes of the intervention and the pathways through which it produces those outcomes.
- Interrelationships among intervention components.
- Contextual factors that may influence the intervention’s ability to produce results.
- Shows the links in the chain of reasoning about “what causes what”.
- Can vary in complexity and take many forms.
Slide 7
Elements of a Basic Logic Model
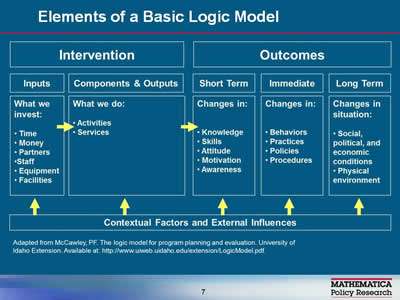
Image of a flow chart illustrating the elements of a basic logic model. Adapted from McCawley, PF. The logic model for program planning and evaluation. University of Idaho Extension. Available at: http://www.uiweb.uidaho.edu/extension/LogicModel.pdf.
Slide 8
Purposes and Users of Logic Models
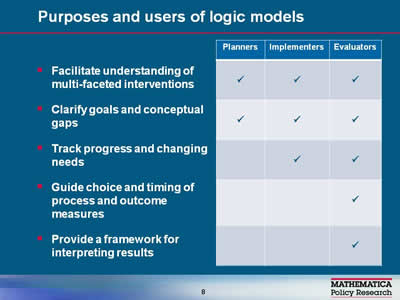
| Planners | Implementers | Evaluators | |
|---|---|---|---|
| Facilitate understanding of multi-faceted interventions | √ | √ | √ |
| Clarify goals and conceptual gaps | √ | √ | √ |
| Track progress and changing needs | √ | √ | |
| Guide choice and timing of process and outcome measures | √ | ||
| Provide a framework for interpreting results | √ |
Slide 9
Building a Logic Model
- There is no single right way:
- Depends on purpose and preference.
- Discuss these questions:
- What problem are you trying to solve?
- What outcomes would represent success?
- What intervention is required to achieve these outcomes?
- What inputs and resources are needed to deliver the intervention?
- What contextual factors are likely to affect the process?
- Graphically illustrate answers and relationships.
Slide 10
Applicability to Medical Home Studies
- Medical home models are multifaceted interventions:
- Consist of multiple and interrelated components.
- Affect change on multiple levels (patients, providers, practices, health systems).
- Include synergies and iterative feedback loops based on a continuous quality improvement framework.
- Are tested in complex health systems contexts.
- Using logic models helps to overcome evaluation challenges raised by these complexities.
Slide 11
Example: Overarching Medical Home Logic Model
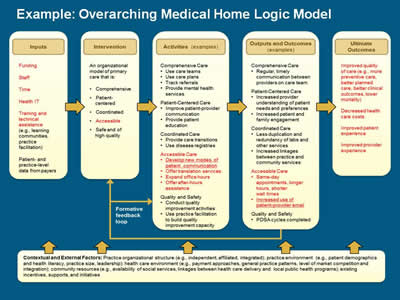
Image of a flowchart showing the medical home logic model.
Slide 12
Example: Logic Model Related to Accessible Services
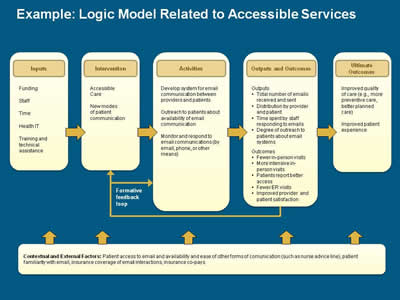
Image of a flowchart showing a logic model related to accessible services.
Slide 13
Advantages of Logic Models
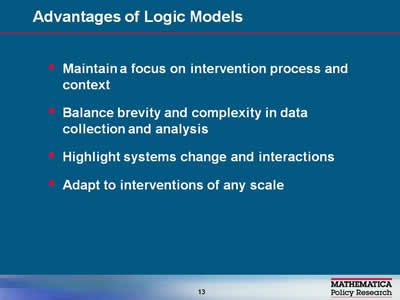
- Maintain a focus on intervention process and context.
- Balance brevity and complexity in data collection and analysis.
- Highlight systems change and interactions.
- Adapt to interventions of any scale.
Slide 14
Limitations of Logic Models
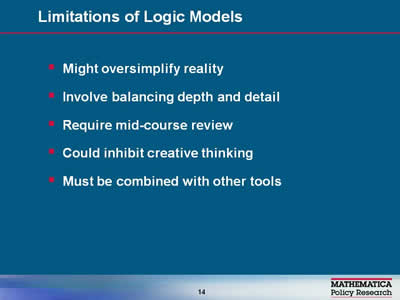
- Might oversimplify reality.
- Involve balancing depth and detail.
- Require mid-course review.
- Could inhibit creative thinking.
- Must be combined with other tools.
Slide 15
More Information
- The full brief contains a list of useful resources:
- General guides for developing logic models.
- Examples of logic models for the medical home.
- The logic model brief and companion briefs in the series are available for download:
Slide 16
Using Logic Models to Understand Variation in Implementation of Full Service Partnerships
June 4, 2013
AHRQ Advanced Methods Webinar
Todd Gilmer, PhD
Department of Family and Preventive Medicine
University of California, San Diego
AHRQ R01 HS01986-1
Slide 17
Overview
- Background on the Mental Health Services Act and our study of Full Service Partnerships.
- Using a logic model to understand variation in implementation of FSPs.
- Using a logic model to explore how implementation factors related to fidelity relate to fidelity domains.
- Using a logic model to describe how one implementation factor is related to outcomes.
Slide 18
Mental Health Services Act
- In 2004, California voters approved proposition 63, which was signed into law as the MHSA.
- Policy history included AB3777 (1988), AB34 (1999), and AB2034 (2000) which funded integrated models 1% tax on incomes > $ million to fund public mental health services in specific areas:
- 1% tax on incomes > $ million to fund public mental health services in specific areas:
- Community Services and Supports:
- Recovery oriented programs targeting the underserved: homeless, Latinos, Asians, older adults, transitional age youth.
- 28% of CSS funding to Full Service Partnerships.
- Prevention and Early Intervention (e.g. stigma, suicide).
- Innovations (integrated mental and physical health).
- Community Services and Supports:
Slide 19
Full Service Partnerships
- FSPs provide supported housing and team based services with a focus on rehabilitation and recovery.
- FSPs are client centered and recovery oriented programs that do ‘whatever it takes’ to improve residential stability and mental health outcomes.
- FSPs were implemented with substantial stakeholder input, and were adapted to local environments, resulting in a wide diversity in approaches to both housing and services.
Slide 20
Housing First
- Developed in New York City by Pathways to Housing.
- Traditional housing model required treatment adherence and sobriety before placement.
- Housing first model emphasized immediate housing in scatter site apartments with tenancy rights.
- Adherence to the Housing First model can be measured using a fidelity scale:
- Choice/affordability, scatter site housing, separation of housing and treatment, service philosophy, service array, team structure.
Slide 21
Why Use a Fidelity Scale to Study FSPs?
- FSPs provide a natural experiment to study various approaches to housing and services.
- Housing First model provides a gold standard.
- Fidelity to Housing First provides a method of mapping FSP practices.
- Opportunity to identify both best practices among FSPs and the important elements of Housing First.
Slide 22
Figure 2. Modified Gelberg-Andersen Behavioral Model for Clients of Full Service Partnerships
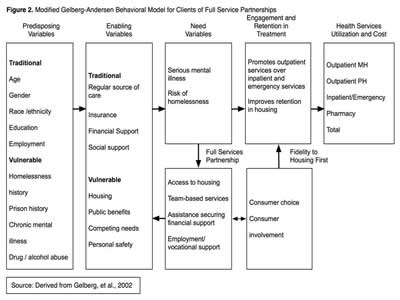
Image of a flowchart showing predisposing variables such as age, gender, and homelessness leading to enabling variables, such as insurance and housing leading to need variables, such as serious mental illness. The Full Services Partnership addresses needs and risks. Engagement and retention in treatment improves retention in housing and improves outcomes.
Source: Derived from Gelberg, et al., 2002.
Slide 23
Mixed Methods Study
- Quantitative data:
- Administrative data (N=8,553, 60% schizophrenia).
- Provides information on housing, service utilization and costs.
- Difference-in-difference analysis.
- Propensity score matched control group.
- Fidelity to Housing First obtained through a survey of 94 FSP practices:
- Survey based on the HF Fidelity Scale.
- Respondents were FSP teams + clients.
- Allows us to link practices to outcomes.
- Administrative data (N=8,553, 60% schizophrenia).
- Qualitative data:
- Fidelity to Housing First obtained through 20 site visits.
Slide 24
FSP Survey Psychometrics Reveal a Two Factor Model of Fidelity
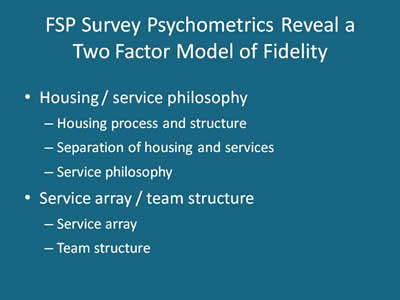
- Housing / service philosophy:
- Housing process and structure.
- Separation of housing and services.
- Service philosophy.
- Service array / team structure:
- Service array.
- Team structure.
Slide 25
Qualitative Analysis Reveal Implementation Factors
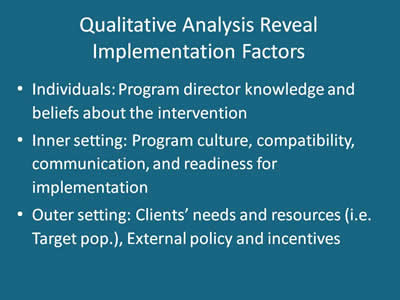
- Individuals: Program director knowledge and beliefs about the intervention.
- Inner setting: Program culture, compatibility, communication, and readiness for implementation.
- Outer setting: Clients’ needs and resources (i.e. Target pop.), External policy and incentives.
Slide 26
Image of a Flowchart
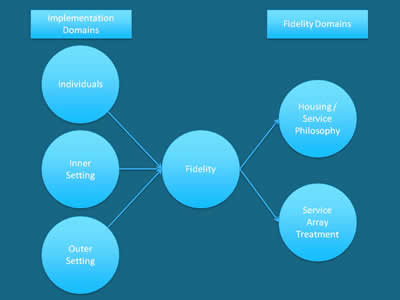
Image of a flowchart. It shows two domains: implementation and fidelity. The Implementation Domain has three elements: Individuals, Inner Setting and Outer Setting; all leading to Fidelity. Fidelity leads to the Fidelity Domains: Housing/Service Philosophy and Service Array Treatment.
Slide 27
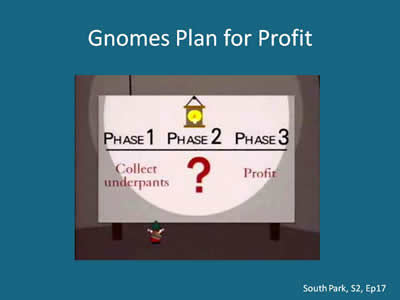
Gnomes Plan for Profit
Screen shot from the South Park cartoon series. It shows a poster with three phases on it. Phase 1 says Collect underpants underneath. Phase 2 says "?" underneath; and Phase 3 says Profit underneath. From South Park, S2, Ep17.
Slide 28
Image of a Flowchart
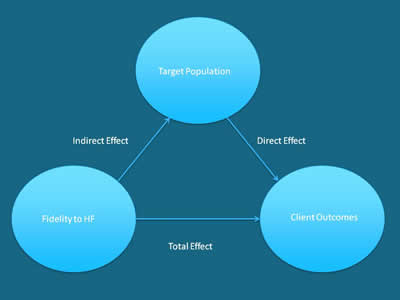
Image of a flow chart. It shows the direct, indirect, and total effect of fidelity to HF. There are three ovals with text in them. The top oval says Target Population with an arrow to Client Outcomes as a direct effect. The left oval says Fidelity to HF with an arrow to Target Population as an indirect effect, and an arrow to the right oval Client Outcomes as a total effect.
Slide 29
Changes in Days Homeless Over One Year by Quintiles of Fidelity, Adjusted and Unadjusted
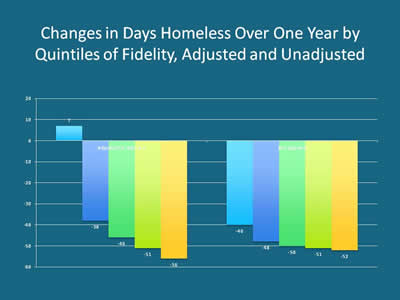
Image of a bar chart showing homelessness decreasing over one year.
Slide 30
Difference in Difference Estimates of Costs by Quintile of Propensity Score
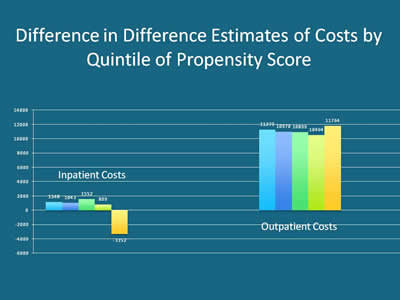
Image of two bar charts. One shows inpatient costs staying fairly steady over the first four quintiles, then dropping dramatically the last quintile. Outpatient costs are also shown as fairly steady with the last quintile going up slightly.
Slide 31
Conclusions
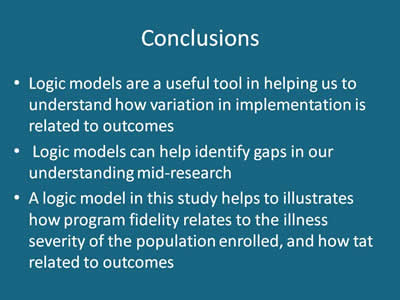
- Logic models are a useful tool in helping us to understand how variation in implementation is related to outcomes.
- Logic models can help identify gaps in our understanding mid-research.
- A logic model in this study helps to illustrates how program fidelity relates to the illness severity of the population enrolled, and how that related to outcomes.
Slide 32
Thank You for Attending!
Webinar #4: Formative Evaluation
Presenter: Jeffrey Smith, PhD
Discussant: Cheryl McDonnell, PhD
Moderator: Michael I. Harrison, PhD
Sponsored by AHRQ’s Delivery System Initiative in partnership with the AHRQ PCMH program
July 15, 2013 1 p.m.
Register for this and other events in our series on advanced methods in delivery system research, here: http://bit.ly/EconometricaAHRQ
Slide 33
For More Information...
For more information about the AHRQ PCMH Research Methods briefs, please visit:
http://www.pcmh.ahrq.gov/portal/server.pt/community/pcmh__home/1483/pcmh_evidence___evaluation_v2


