Advanced Methods in Delivery System Research - Planning, Executing, Analyzing, and Reporting Research on Delivery System Improvement
Webinar #5: Mixed Methods (Slide Presentation)
Slide 1

Advanced Methods Webinars: Integrating Mixed Methods in Health Services and Delivery System Research
Presenters:
Benjamin Crabtree, PhD
Michael K. Magill, MD
Debra L. Scammon, PhD
Andrada Tomoaia-Cotisel, MHA, PhD(c)
Moderator: Michael I. Harrison, PhD
Sponsored by AHRQ’s Delivery System Initiative in partnership with the AHRQ PCMH program
December 3, 2013
Slide 2

Speaker Introductions
Ben Crabtree is a medical anthropologist. He is Professor and Director of Research at the Department of Family Medicine and Community Health, Rutgers-Robert Wood Johnson Medical School.
Michael Magill is Chairman of the University of Utah School of Medicine Department of Family and Preventive Medicine; Executive Medical Director, University of Utah Health Plans; and Director of Research, University of Utah Community Clinics/Community Physicians Group.
Debra Scammon is Emma Eccles Jones Professor of Marketing; Director, Masters of Healthcare Administration, David Eccles School of Business; and Adjunct Professor, Department of Family and Preventive Medicine, School of Medicine at the University of Utah.
Andrada Tomoaia-Cotisel is a Research Associate, Department of Family and Preventive Medicine, School of Medicine, University of Utah; and a Doctoral candidate, Department of Health Services Research and Policy, Faculty of Public Health Policy, London School of Hygiene and Tropical Medicine.
To the left of each description is an image of the speaker.
Slide 3

Integrating Mixed Methods in Health Services and Research
Benjamin F. Crabtree, PhD
(Rutgers Robert Wood Johnson Medical School)
William L. Miller, MD, MA
(Lehigh Valley Health Network)
Advanced Methods Webinar
December 3, 2013
On the upper left of the slide is the seal and logo for the Rutgers Robert Wood Johnson Medical School.
Slide 4

Attributes of Mixed Methods Research
- Rigorous collection and analysis of both qualitative and quantitative data.
- Qualitative and quantitative data are mixed (integrate or link) by combining them sequentially or by embedding.
- Can be incorporated in a single study or in multiple phases of a program of research.
- Designs are framed within a broader framework or theoretical lens.
- Data are combined or integrated into specific mixed methods research designs that direct the study.
See: Creswell J, Plano-Clark V. Designing and Conducting Mixed Methods Research, 2nd Edition. Sage Pubs, 2011.
Slide 5

FYI: Qualitative Data Collection
Include:
- Interviews (e.g. key informant, depth, focus group).
- Observations (e.g. unstructured, structured, participant).
- Recordings (e.g. video and audio).
- Existing documents (e.g. memos, reports, charts, etc.).
Slide 6

Lots of Mixed Methods Resources – Journal Articles
- Curry, L. A., H. M. Krumholz, A. O’Cathain, V. L. Plano Clark, E. Cherlin, and E. H. Bradley. 2013. “Mixed Methods in Biomedical and Health Services Research.” Circulation 6 (1): 119–23.
- Palinkas, L. A., S. M. Horwitz, P. Chamberlain, M. S. Hurlburt, and J. Landsverk. 2011. “Mixed-Methods Designs in Mental Health Services Research: A Review.” Psychiatric Services 62 (3): 255–63.
- Zhang, W., and S. Watanabe-Galloway. 2013. “Using Mixed Methods Effectively in Prevention Science: Designs, Procedures, and Examples.” Prevention Science: The Official Journal of the Society for Prevention Research [Epub ahead of print].
Above the journal article citations are images of the front covers of the Journal of Mixed Methods Research and HSR.
Slide 7

Lots of Mixed Methods Resources – Books
Images of the covers of 5 different books on mixed methods.
Slide 8

Best Practices for Mixed Methods Research in the Health Sciences
http://obssr.od.nih.gov/mixed_methods_research/pdf/Best_Practices_for_Mixed_Methods_Research.pdf
Commissioned by: Office of Behavioral and Social Sciences Research (OBSSR).
Image of the participants in an NIH workshop on best practices in mixed methods research.
Slide 9

A New Resource:
Image of the front cover of the December 2013 issue of HSR devoted to mixed methods research.
Slide 10

Health Services Research Theme Issue
Vol. 48, No. 6, Part II December 2013
- Miller WL, Crabtree BF, Harrison MI, Fennell ML. Integrating Mixed Methods in Health Services and Delivery Systems Research (Editorial).
- Fetters MD, Curry LA, Creswell JW. Achieving Integration in Mixed Methods Designs – Principles and Practices.
- Bowers B, Cohen LW, Elliot AE, et al. Creating and Supporting a Mixed Methods Health Services Research Team.
- Scammon DL, Tomoaia-Cotisel A, Day, RL, et al. Connecting the Dots and Merging Meaning: Using Mixed Methods to Study Primary Care Delivery Transformation.
- Zickmund SL, Yang S. Mulvey EP, et al. Predicting Cancer Mortality: Developing a New Cancer Care Variable Using Mixed Methods and the Quasi-Statistical Approach.
- Hamilton AB, Cohen AN, Glover DL, et al. Implementation of Evidence-Based Employment Services in Specialty Mental Health.
- Gilmer TP, Katz ML, Stefancic A, Palinkas LA. Variation in the Implementation of California’s Full Service Partnerships for Persons with Serious Mental Illness.
Slide 11

Three Basic Designs
- Sequential Exploratory
- Sequential Explanatory
- Convergent
To the left of the text is an image of the beginning of the HSR article by Michael D. Fetters, et al.
Slide 12

Sequential Exploratory Mixed Methods Design
Image of a flowchart:
Qualitative Data and Results → Quantitative Data and Results → Interpretation
Slide 13

Sequential Explanatory Mixed Methods Design
Image of a flowchart:
Quantitative Data and Results → Qualitative Data and Results → Interpretation
Slide 14

Convergent Mixed Methods Design
Image of a flowchart:
Quantitative data collection and analysis and Qualitative data collection & analysis both lead to Compare or relate, which leads to Interpretation.
Slide 15

Four Advanced Frameworks
- Multistage
- Intervention
- Case Study
- Participatory
Methods Level Integration
- Connecting
- Building
- Merging
- Embedding
Interpretation & Reporting Level Integration
- Narrative weaving
- Data transformation
- Joint display
To the left of the text is an image of the journal article titled "Achieving Interation in Mixed Methods Designs-Principles and Practices".
Slide 16

HSR Theme Issue Includes Diverse Content!
- Miller WL, Crabtree BF, Harrison MI, Fennell ML. Integrating Mixed Methods in Health Services and Delivery Systems Research (Editorial).
- Fetters MD, Curry LA, Creswell JW. Achieving Integration in Mixed Methods Designs – Principles and Practices.
- Bowers B, Cohen LW, Elliot AE, et al. Creating and Supporting a Mixed Methods Health Services Research Team.
- Scammon DL, Tomoaia-Cotisel A, Day, RL, et al. Connecting the Dots and Merging Meaning: Using Mixed Methods to Study Primary Care Delivery Transformation.
- Zickmund SL, Yang S. Mulvey EP, et al. Predicting Cancer Mortality: Developing a New Cancer Care Variable Using Mixed Methods and the Quasi-Statistical Approach.
- Hamilton AB, Cohen AN, Glover DL, et al. Implementation of Evidence-Based Employment Services in Specialty Mental Health.
- Gilmer TP, Katz ML, Stefancic A, Palinkas LA. Variation in the Implementation of California’s Full Service Partnerships for Persons with Serious Mental Illness.
Slide 17

Crabtree & Miller Lessons from 20 Years of Mixed Methods Research
- Remember the research questions!
- Mixed methods research is best done in collaborative teams.
- Collaborative teams take time and relationship building (see Bowers, et al. and Scammon, et al. in HSR Theme Issue).
- Think of both individual projects, but also a program of research with multiple projects.
- Reporting stories to accompany numbers provides an effective means for engaging readers and policy makers.
- Too often, quantitative approaches are misapplied to phenomena requiring qualitative or mixed methods.
- Ensure the strengths and weaknesses of each selected method complement each other.
- Continually evaluate methodology throughout the study.
Slide 18
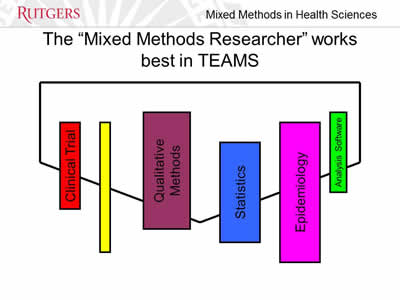
The "Mixed Methods Research" Works Best in Teams
Image showing the different member specialties of a research team.
Slide 19
HSR Theme Issue Article by Scammon, et al. illustrates many of the core attributes of mixed methods designs.
Image of the beginning of the Scammon, et al. journal article.
Slide 20
Connecting the Dots and Merging Meaning: Using Mixed Methods to Study Primary Care Delivery Transformation
Advanced Methods Webinar
December 3, 2013
Debra L. Scammon, Ph.D.
Andrada Tomoaia-Cotisel, M.P.H., M.H.A., Ph.D. Candidate
Michael K. Magill, M.D.
Health Services Research
Vol. 48, No 6, Part II, December 2013
At the top of the slide and thereafter for the Scammon set it displays University of Utah.
Slide 21

Acknowledgements
This project was supported by grants R18HS019136 and R18HS020106 from the Agency for Health Care Research and Quality (AHRQ).
The content of this presentation is solely the responsibility of the authors and does not necessarily represent the official views of the AHRQ.
Slide 22
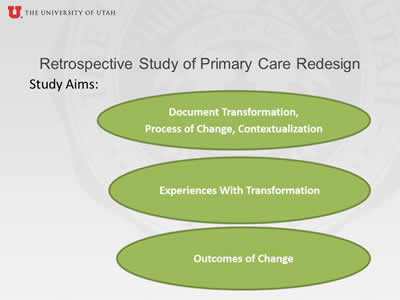
Retrospective Study of Primary Care Redesign
Study Aims:
Image of three different ovals. The top oval has text in it stating: Document Transformation, Process of Change, Contextualization. The middle oval states: Experiences With Transformation. The bottom oval states: Outcomes of Change.
Slide 23

Trans-disciplinary Team
- Debra Scammon, Ph.D., Marketing and Consumer Behavior Researcher.
- Andrada Tomoaia-Cotisel, M.P.H., M.H.A., doctoral candidate in Public Health .
- Julie Day, M.D., Family Medicine Physician and Quality Medical Director, Community Clinics.
- Rachel Day, Research Associate and Technical Writer.
- Jaewhan Kim, Ph.D., Biostatician and Health Economist.
- Norman Waitzman, Ph.D., Health Economist.
- Timothy Farrell, M.D., Geriatrician and Family Medicine Physician.
- Michael Magill, M.D., Family Medicine Physician and Executive Medical Director University of Utah Health Plans (PI)
Slide 24
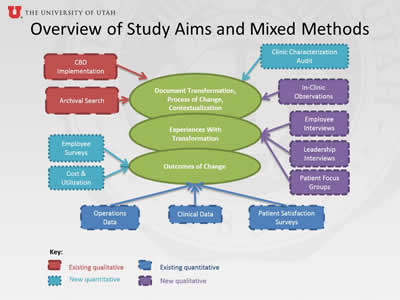
Overview of Study Aims and Mixed Methods
Flowchart showing the different methods that are used to achieve the study aims that are also illustrated in Slide 22.
Slide 25
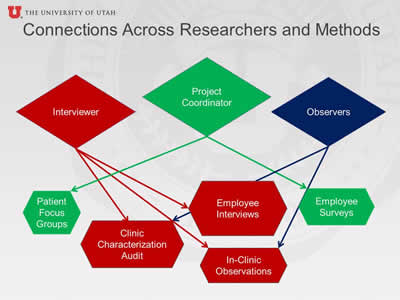
Connections Across Researchers and Methods
Flowchart showing the relations between the different researchers and methods.
Interviewer: Clinic Characterization Audit, Employee Interviews, and In-Clinic Observations.
Project Coordinator: Patient Focus Groups and Employee Surveys.
Observers: Clinic Characterization Audit and In-Clinic Observations.
Slide 26
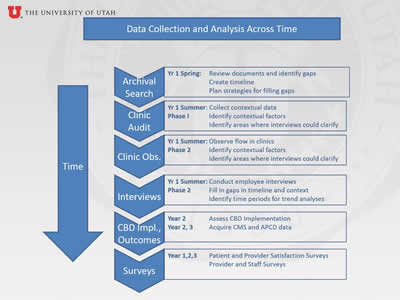
Data Collection and Analysis Across Time
Flowchart showing the data collection and analysis timeline.
Slide 27
Capitalize Upon Existing Data
- Operations data already collected by the organization we were studying.
- Infrastructure for collecting and reporting these data was already in place.
- Consider nature of operations data.
- Consider realities of extracting necessary data
Slide 28
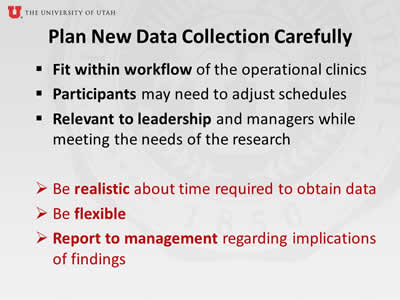
Plan New Data Collection Carefully
- Fit within workflow of the operational clinics.
- Participants may need to adjust schedules.
- Relevant to leadership and managers while meeting the needs of the research.
- Be realistic about time required to obtain data.
- Be flexible.
- Report to management regarding implications of findings.
Slide 29

Merging Data to Make Meaning
An example...
Slide 30
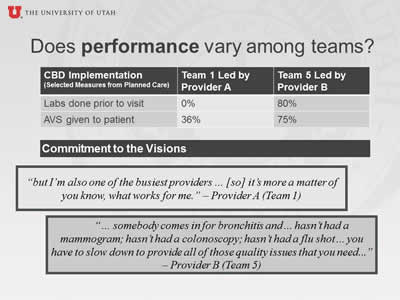
Does Performance Vary Among Teams?
| CBD Implementation (Selected Measures from Planned Care) |
Team 1 Led by Provider A | Team 5 Led by Provider B |
|---|---|---|
| Labs done prior to visit | 0% | 80% |
| AVS given to patient | 36% | 75% |
Commitment to the Visions
| “but I’m also one of the busiest providers … [so] it’s more a matter of you know, what works for me.” – Provider A (Team 1) |
| “… somebody comes in for bronchitis and… hasn’t had a mammogram; hasn’t had a colonoscopy; hasn’t had a flu shot… you have to slow down to provide all of those quality issues that you need...” – Provider B (Team 5) |
Slide 31
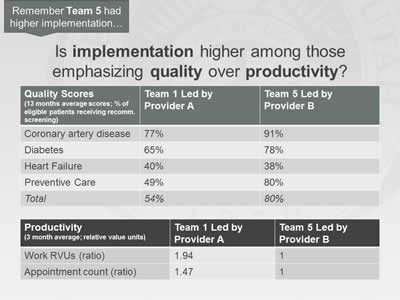
Is Implementation Higher Among Those Emphasizing Quality Over Productivity?
Remember Team 5 had higher implementation...
| Quality Scores (13 months average scores; % of eligible patients receiving recommended screening) |
Team 1 Led by Provider A | Team 5 Led by Provider B |
|---|---|---|
| Coronary artery disease | 77% | 91% |
| Diabetes | 65% | 78% |
| Heart Failure | 40% | 38% |
| Preventive Care | 49% | 80% |
| Total | 54% | 80% |
| Productivity (3 months average; relative value units) |
Team 1 Led by Provider A | Team 5 Led by Provider B |
|---|---|---|
| Work RVUs (ratio) | 1.94 | 1 |
| Appointment count (ratio) | 1.47 | 1 |
Slide 32
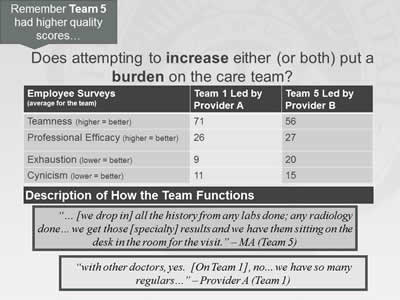
Does Attempting to Increase Either (or Both) Put a Burden on the Care Team?
Remember Team 5 had higher quality scores...
| Employee Surveys (average for the team) |
Team 1 Led by Provider A | Team 5 Led by Provider B |
|---|---|---|
| Teamness (higher = better) | 71 | 56 |
| Professional Efficacy (higher = better) | 26 | 27 |
| Exhaustion (lower = better) | 9 | 20 |
| Cynicism (lower = better) | 11 | 15 |
Description of How the Team Functions
| “… [we drop in] all the history from any labs done; any radiology done… we get those [specialty] results and we have them sitting on the desk in the room for the visit.” – MA (Team 5) |
| “with other doctors, yes. [On Team 1], no... we have so many regulars…” – Provider A (Team 1) |
Slide 33
Insights from Mixed Methods on Practice Redesign
Using mixed methods, we were able to:
- Document variation in implementation & outcomes.
- Elucidate tension between productivity and quality:
- Explore differences in the way providers approach redesign.
- Explore differences in MAs’ ability to implement.
- Elucidate resulting impact on team members.
Slide 34
Value of Mixed Methods Research
- Each data source enriched our understanding of the change process.
- Mixed methods revealed a more complete understanding of the transformation process.
Slide 35
Value of Mixed Methods Research
- Facilitated more effective engagement between research team and CC leadership.
- Provided evidence base to support on-going practice redesign.
- Challenges exist but can be overcome with careful planning and persistence.
Slide 36
Conclusions
- Gained a more nuanced perspective on implementation:
- Appreciate multiple perspectives;
- Revealed different aspects of change process and outcomes;
- Extracted richer meaning than that available from any single source.
Slide 37
Conclusions
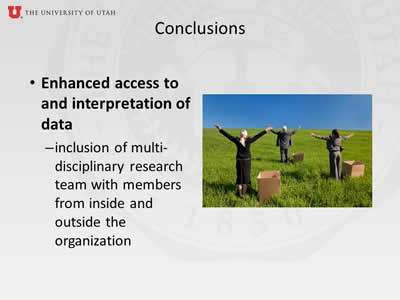
- Enhanced access to and interpretation of data:
- Inclusion of multi-disciplinary research team with members from inside and outside the organization.
Slide 38
Conclusions
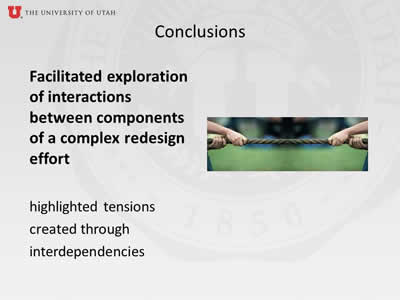
- Facilitated exploration of interactions between components of a complex redesign effort:
- Highlighted tensions created through interdependencies.
Slide 39

Questions?
Slide 40

Thank You for Attending!
Papers from the HSR special issue are available at: http://onlinelibrary.wiley.com/journal/10.1111/(ISSN)1475-6773/earlyview.
For more information about the AHRQ PCMH Research Methods briefs, please visit: http://pcmh.ahrq.gov/page/evidence-and-evaluation.
Other Webinars in the AHRQ Advanced Methods Series are available at: http://www.ahrq.gov/professionals/systems/system/advanced-methods/index.html.


