Chartbook on Hispanic Health Care: Slide Presentation—Part 1
2014 National Healthcare Quality and Disparities Report
Introduction
Slide 1
National Healthcare Quality and Disparities Report
Chartbook on Health Care for Hispanics
October 2015
Slide 2
Goals of the Chartbook on Health Care for Hispanics
- Commemorates the 30th Anniversary of the Report of the Secretary's Task Force on Black and Minority Health (Heckler Report).
- Highlights progress for Hispanics on priorities of the Heckler Report.
- Summarizes trends in health care disparities by Hispanic ethnicity related to:
- Access to health care.
- Priorities of the National Quality Strategy (NQS).
- Presents information on a unique, largely Hispanic population: residents of the U.S.-Mexico border.
Slide 3
Organization of the Chartbook on Health Care for Hispanics
- Part of a series related to the National Healthcare Quality and Disparities Report (QDR).
- Organized into four parts:
- Overviews of the QDR and the Hispanic population, one of AHRQ's priority populations.
- Summary of trends in health care for Hispanic populations related to priorities of the Heckler Report.
- Summary of trends in health care for Hispanic populations related to access to health care and NQS priorities.
- Information on health care received by residents of the U.S.-Mexico border, a unique and largely Hispanic population.
Slide 4
Key Findings of the Chartbook on Health Care for Hispanics
- Data on access to and quality of health care received by Hispanics were available for almost all measures tracked in the QDR.
- Among Heckler Report priorities, disparities in mental health care and diabetes care were big problems for Hispanics.
- Hispanics have worse access to care although this is improving since the Affordable Care Act.
- Hispanics receive poorer quality of care, especially as related to person centeredness.
- Residents of the U.S.-Mexico border face unique health care challenges.
Overviews of the Report and the Hispanic Population
Slide 5
National Healthcare Quality and Disparities Report Chartbook on Health Care for Hispanics
Part 1:Overviews of the Report and the Hispanic Population
Slide 6
National Healthcare Quality and Disparities Report
- Annual report to Congress mandated in the Healthcare Research and Quality Act of 1999 (P.L. 106-129).
- Provides a comprehensive overview of:
- Quality of health care received by the general U.S. population.
- Disparities in care experienced by different racial, ethnic, and socioeconomic groups.
- Assesses the performance of our health system and identifies areas of strengths and weaknesses along three main themes:
- Access to health care.
- Quality of health care.
- NQS priorities.
Slide 7
National Healthcare Quality and Disparities Report
- Based on more than 250 measures of quality and disparities covering a broad array of health care services and settings.
- Data generally available through 2012.
- Produced with the help of an Interagency Work Group led by the Agency for Healthcare Research and Quality and submitted on behalf of the Secretary of Health and Human Services.
Slide 8

Key Findings of the 2014 QDR
- The Nation has made clear progress in improving the health care delivery system to achieve the three aims of better care, smarter spending, and healthier people.
- There is still more work to do, specifically to address disparities in care.
- Access improved.
- Quality improved for most National Quality Strategy priorities.
- Few disparities were eliminated.
- Many challenges in improving quality and reducing disparities remain.
Slide 9
Chartbook on Health Care for Hispanics
- This chartbook includes summaries of trends in health care for Hispanic populations related to:
- Priorities of the Heckler Report.
- Access to health care.
- Priorities of the National Quality Strategy.
- Introduction and Methods contains information about methods used in the chartbook.
- Appendixes include information about measures and data.
- A Data Query tool (http://nhqrnet.ahrq.gov/inhqrdr/data/query) provides access to all data tables.
Slide 10
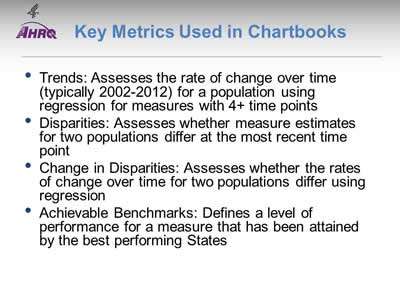
Key Metrics Used in Chartbooks
- Trends: Assesses the rate of change over time (typically 2002-2012) for a population using regression for measures with 4+ time points.
- Disparities: Assesses whether measure estimates for two populations differ at the most recent time point.
- Change in Disparities: Assesses whether the rates of change over time for two populations differ using regression.
- Achievable Benchmarks: Defines a level of performance for a measure that has been attained by the best performing States.
Note:
- In this chartbook Hispanics are usually contrasted with non-Hispanic Whites and non-Hispanic Blacks. To make text more concise, the labels White and Black are used to refer to populations that are non-Hispanic White and non-Hispanic Black, respectively. In addition, unless otherwise specified, Hispanics include all races.
- Examples of successful interventions come from the AHRQ Health Care Innovations Exchange.
- Go to Introduction and Methods for more information about methods used in the chartbook.
Slide 11
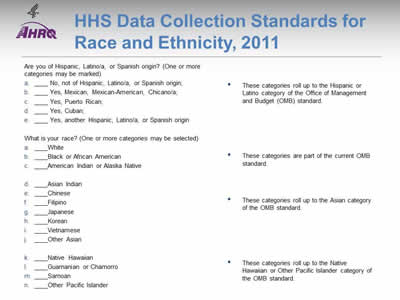
HHS Data Collection Standards for Race and Ethnicity, 2011
Note:
- The Affordable Care Act includes several provisions aimed at eliminating health disparities in America. Section 4302 (Understanding health disparities: data collection and analysis) focuses on the standardization, collection, analysis, and reporting of health disparities data. Section 4302 requires the Secretary of Health and Human Services (HHS) to establish data collection standards for race, ethnicity, sex, primary language, and disability status. Adopted October 31, 2011, these data collection standards are to be used, to the extent practicable, in HHS-sponsored population health surveys.
- The new data standards improve the quality of HHS data collection by establishing a consistent, uniform way to capture, record, and report data on race and ethnicity with additional granularity (beyond the OMB minimum) for the Asian race category and Hispanic ethnicity, and for the first time, standardized collection of language and disability status data.
- Because many of the data available to produce this chartbook were collected in 2012 and earlier, there was insufficient time to incorporate the new 2011 standards . Thus, much of the information presented here will show estimates for Hispanics in aggregate. For several data sources, information was collected for more granular Hispanic groups, and this is presented to illustrate the importance of collecting this more granular information.
Slide 12
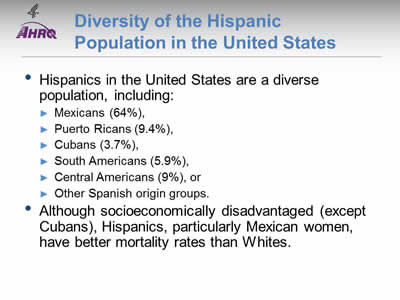
Diversity of the Hispanic Population in the United States
- Hispanics in the United States are a diverse population, including:
- Mexicans (64%).
- Puerto Ricans (9.4%).
- Cubans (3.7%).
- South Americans (5.9%).
- Central Americans (9%).
- Other Spanish origin groups.
- Although socioeconomically disadvantaged (except Cubans), Hispanics, particularly Mexican women, have better mortality rates than Whites.
Note:
- Source: Profile: Hispanic/Latino Americans; Deaths: Final Data for 2012.
Slide 13
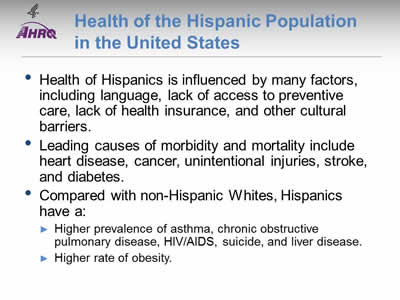
Health of the Hispanic Population in the United States
- Health of Hispanics is influenced by many factors, including language, lack of access to preventive care, lack of health insurance, and other cultural barriers.
- Leading causes of morbidity and mortality include heart disease, cancer, unintentional injuries, stroke, and diabetes.
- Compared with non-Hispanic Whites, Hispanics have a:
- Higher prevalence of asthma, chronic obstructive pulmonary disease, HIV/AIDS, suicide, and liver disease.
- Higher rate of obesity.
Note:
- Source: Profile: Hispanic/Latino Americans;
NIH releases comprehensive new data outlining Hispanic/Latino health and habits.
Slide 14
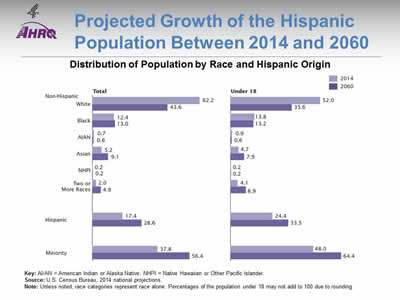
Projected Growth of the Hispanic Population Between 2014 and 2060
Distribution of Population by Race and Hispanic Origin
Image: Two bar charts compare distribution of population by race for 2014 and projected for 2060. Total: White, 2014 - 62.2%; White, 2060 - 43.6%. Black, 2014 - 12.4%; Black, 2060 - 13.0%. AIAN, 2014 - 0.7%; AIAN, 2060 - 0.6%. Asian, 2014 - 5.2%; Asian, 2060 - 9.1%. NHPI, 2014 - 0.2%; NHPI, 2060 - 0.2%. Two or More Races, 2014 - 2.0%; Two or More Races, 2060 - 4.9%. Hispanic, 2014 - 17.4%; Hispanic, 2060 - 28.6%. Minority, 2014 - 37.8%; Minority, 2060 - 56.4%. Under 18: White, 2014 - 52.0%; White, 2060 - 35.6%. Black, 2014 - 13.8%; Black, 2060 - 13.2%. AIAN, 2014 - 0.9%; AIAN, 2060 - 0.6%. Asian, 2014 - 4.7%; Asian, 2060 - 7.9%. NHPI, 2014 - 0.2%; NHPI, 2060 - 0.2%. Two or More Races, 2014 - 4.1%; Two or More Races, 2060 - 8.9%. Hispanic, 2014 - 24.4%; Hispanic, 2060 - 33.5%. Minority, 2014 - 48.0%; Minority, 2060 - 64.4%.
Key: AI/AN = American Indian or Alaska Native; NHPI = Native Hawaiian or Other Pacific Islander.
Source: U.S. Census Bureau, 2014 national projections.
Note: Unless noted, race categories represent race alone. Percentages of the population under 18 may not add to 100 due to rounding.
- In 2060, it is projected that 28.6% of the total U.S. population and 33.5% of U.S. children will be Hispanic.
Slide 15
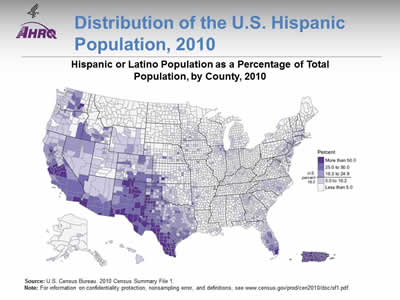
Distribution of the U.S. Hispanic Population, 2010
Hispanic or Latino Population as a Percentage of Total Population, by County, 2010
Image: A map of the United States is color-coded by county to show percentage of Hispanic or Latino Population.
Source: U.S. Census Bureau. 2010 Census Summary File 1.
Note: For information on confidentiality protection, nonsampling error, and definitions, for more information go to 2010 Census Summary File 1 (7.384 MB).
- Hispanics are concentrated in specific geographic locations. Three quarters of the U.S. Hispanic population live in eight States:
- California (28% of Hispanics in the United States).
- Texas (19%).
- Florida (8%).
- New York (7%).
- Illinois (4%).
- Arizona (4%).
- New Jersey (3%).
- Colorado (2%).
- One-quarter of the U.S. Hispanic population live in eight counties:
- 4.7 million Hispanics in Los Angeles County, California.
- 1.7 million in Harris County, Texas.
- 1.6 million in Miami-Dade County, Florida.
- 1.2 million in Cook County, Illinois.
- 1.1 million in Maricopa County, Arizona.
- 1.0 million in each of the following counties: Orange, California; Bexar, Texas; and San Bernardino, California.
Slide 16
Hispanic Mothers and Children
- About 84% of Hispanic mothers receive early prenatal care compared with 87% of White mothers.
- Most Hispanic populations have lower infant mortality rates than Whites.
- Infant mortality rates range from 3.0 for Cuban Americans to 5.9 for Puerto Ricans compared with 5.1 for non-Hispanic Whites.
- Congenital malformation, low birthweight, and maternal complications are the leading causes of infant mortality among Hispanics.
Note:
- Source: Racial and Ethnic Disparities in Maternal Mortality in the United States; Markides & Coreil, 1986;
Infant Mortality and Hispanic Americans.
Slide 17
Older Hispanics in the United States
- In 2012, there were:
- 3.1 million Hispanics age 65 and over (7% of older adults); by 2060, this is projected to increase to more than 19 million, accounting for 21% of older adults.
- 4,129 Hispanics age 100 and over (1,105 men, 3,024 women), or 7% of all centenarians.
- Most (70%) older Hispanics lived in four States: California, Texas, Florida, and New York.
Note:
- Source: Hispanic American Health.
Slide 18
Health of Older Hispanics in the United States
- In 2012, the top five chronic conditions among older Hispanics were hypertension, arthritis, heart disease, diabetes, and cancer.
- Nearly one-quarter (24%) of older Hispanics had Medicare and supplementary private health insurance compared with 50% of all older adults.
- Nearly one-quarter (23%) of older Hispanics were covered by Medicare and Medicaid compared with 8% of all older adults.
Note:
- Source: Hispanic American Health.


