Chartbook on Hispanic Health Care: Slide Presentation—Part 2
2014 National Healthcare Quality and Disparities Report
Trends in Priorities of the Heckler Report
Slide 1
National Healthcare Quality and Disparities Report Chartbook on Health Care for Hispanics
Part 2: Trends in Priorities of the Heckler Report
Slide 2
Report of the Secretary's Task Force on Black and Minority Health (Heckler Report)
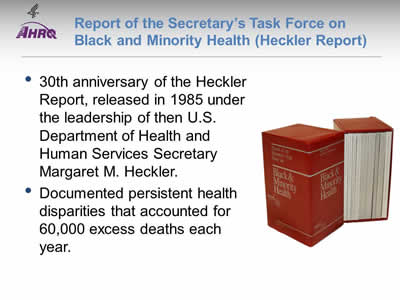
- 30th anniversary of the Heckler Report, released in 1985 under the leadership of then U.S. Department of Health and Human Services Secretary Margaret M. Heckler.
- Documented persistent health disparities that accounted for 60,000 excess deaths each year.
Note:
- This year marks the 30th anniversary of the Report of the Secretary's Task Force on Black and Minority Health (also known as the Heckler Report), released in 1985 under the leadership of then U.S. Department of Health and Human Services (HHS) Secretary Margaret M. Heckler. The landmark report marked the first convening of a group of health experts by the U.S. government to conduct a comprehensive study of racial and ethnic minority health and elevated minority health onto a national stage.
- The Heckler Report documented persistent health disparities that accounted for 60,000 excess deaths each year and synthesized ways to advance health equity. This marked the beginning of a new era in addressing minority health issues, beginning with the creation of the HHS Office of Minority Health in 1986 and leading up to the Affordable Care Act in 2010.
Slide 3
Priorities of the Heckler Report
- Focused on six causes of death with large Black-White disparities:
- Cancer.
- Cardiovascular disease and stroke.
- Chemical dependency.
- Diabetes.
- Homicide and accidents.
- Infant mortality.
- Data on "other minorities," including Hispanics:
- Very limited in the 1980s.
- Much more available today.
Note:
- The Heckler Report found that 6 causes of death accounted for more than 80% of mortality among Blacks and other minority groups compared with Whites. These include cancer; cardiovascular disease and stroke; chemical dependency (measured by deaths due to cirrhosis); diabetes; homicide and accidents (unintentional injuries); and infant mortality. Based on the findings, the report outlined recommendations in areas of urgent need, including health information and education; health services delivery and financing; health professions development; data development; and research agenda.
- With the rapidly increasing diversity of the Nation and persistence of health disparities, the Heckler Report 30th anniversary serves as a call for all Americans to take action and accelerate efforts toward ending health disparities and achieving health equity in their community.
Slide 4
Progress on Priorities of the Heckler Report for Hispanics
| Priority | Trends | Most Recent Disparity | Disparity Change |
|---|---|---|---|
| Care for Cancer | 71% improving | 29% worse | 50% narrowing |
| Care for Cardiovascular Diseases | 75% improving | 33% worse | 0% narrowing |
| Care for Substance Use Disorders | No improvement | No disparity | No change |
| Care for Diabetes | 50% improving | 56% worse | 50% narrowing |
| Suicide Prevention and Mental Health Care | 25% worsening | 75% worse | 0% narrowing |
| Infant Mortality and Maternity Care | 43% improving | 43% better | No change |
Note:
- Trends:
- Most measures of care for cancer and care for cardiovascular diseases were improving for Hispanics.
- About half of measures for diabetes care and maternity care were improving.
- No measures of care for substance use disorders were improving and mental health care seemed to be getting worse for Hispanics.
- Groups With Disparities:
- For many measures of care for mental health disorders, diabetes, cardiovascular diseases, and cancer, Hispanics received worse quality of care than non-Hispanic Whites. Hispanics tended to receive better quality of maternity care.
- Of measures for which Hispanics received worse quality of care than non-Hispanic Whites, narrowing of the gap was observed for several measures of cancer and diabetes care. No narrowing of disparities was observed among measures of cardiovascular and mental health care.
- Summary: Of priorities of the Heckler Report:
- Suicide prevention and mental health care for Hispanics is worsening, with many disparities and no reductions in disparities over time.
- Hispanics also experience many disparities in care for diabetes.
- Care for substance use disorders is poor for all ethnic groups.
Slide 5
National Healthcare Quality and Disparities Report Chartbook on Health Care for Hispanics
Part 2: Trends in Priorities of the Heckler Report
Care for Cancer
Note:
- Thirty years ago, the Heckler Report found that:
- Overall age-adjusted cancer incidence rates for Hispanics were lower than for Blacks or nonminorities. Specific sites of excess incidence among Hispanics were the stomach, prostate, esophagus, pancreas, and cervix.
- The overall 5-year relative survival rate of Hispanic males was almost identical to that of nonminorities. Hispanic females had somewhat lower survival rates than nonminority females.
- Mortality data are derived from the National Center for Health Statistics (NCHS) through the vital statistics system. This system classifies Hispanics as Whites, so no death statistics on Hispanics are presented.
- Today, death statistics on Hispanics are available. In addition, quality care for cancer has changed. Evidence-based mass screening is recommended in specific populations for four cancers: breast, cervical, colorectal, and lung cancer. Screening is the first step in the process of cancer prevention (Pap testing for cervical and colonoscopy for colorectal) and early detection (mammography for breast and CT scan for lung) in the process of cancer control. Hence, screenable cancers have been selected for inclusion in this chartbook.
Slide 6
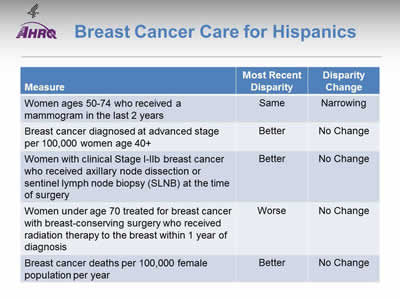
Breast Cancer Care for Hispanics
| Measure | Most Recent Disparity | Disparity Change |
|---|---|---|
| Women ages 50-74 who received a mammogram in the last 2 years | Same | Narrowing |
| Breast cancer diagnosed at advanced stage per 100,000 women age 40+ | Better | No Change |
| Women with clinical Stage I-IIb breast cancer who received axillary node dissection or sentinel lymph node biopsy (SLNB) at the time of surgery | Better | No Change |
| Women under age 70 treated for breast cancer with breast-conserving surgery who received radiation therapy to the breast within 1 year of diagnosis | Worse | No Change |
| Breast cancer deaths per 100,000 female population per year | Better | No Change |
Note:
- Trends: Most measures of breast cancer care for Hispanics were improving.
- Groups With Disparities:
- Rates of mammography were similar between Hispanic and White women. This represents the elimination of a previously observed disparity.
- Rates of diagnosis with advanced stage breast cancer and death due to breast cancer were lower among Hispanics compared with non-Hispanic Whites and these disparities were not changing over time.
- Hispanic women were more likely to receive axillary node dissection at time of surgery and this disparity did not change over time.
- Hispanics were less likely to receive radiation therapy after breast-conserving surgery compared with Whites. This disparity did not change over time.
Slide 7
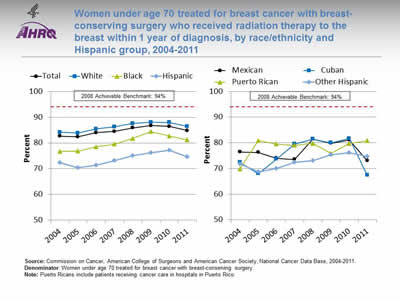
Women under age 70 treated for breast cancer with breast-conserving surgery who received radiation therapy to the breast within 1 year of diagnosis, by race/ethnicity and Hispanic group, 2004-2011
Image: Graphs show women under age 70 treated for breast cancer with breast-conserving surgery who received radiation therapy to the breast within 1 year of diagnosis:
Left Graph:
| Race/Ethnicity | 2004 | 2005 | 2006 | 2007 | 2008 | 2009 | 2010 | 2011 |
|---|---|---|---|---|---|---|---|---|
| Total | 82.6 | 82.4 | 84.0 | 84.5 | 85.9 | 86.7 | 86.4 | 84.8 |
| White | 84.2 | 83.8 | 85.5 | 86.2 | 87.6 | 88.1 | 88.0 | 86.4 |
| Black | 76.7 | 76.8 | 78.6 | 79.6 | 81.7 | 84.4 | 82.7 | 81.2 |
| Hispanic | 72.3 | 70.5 | 71.4 | 73.2 | 75.1 | 76.2 | 77.2 | 74.6 |
2008 Achievable Benchmark: 94%.
Right Graph:
| Hispanic Group | 2004 | 2005 | 2006 | 2007 | 2008 | 2009 | 2010 | 2011 |
|---|---|---|---|---|---|---|---|---|
| Mexican | 76.4 | 76.3 | 74.0 | 73.5 | 81.5 | 79.8 | 81.1 | 73.0 |
| Cuban | 72.4 | 68.0 | 73.7 | 79.5 | 81.5 | 80.0 | 81.7 | 67.4 |
| Puerto Rican | 69.9 | 80.9 | 79.5 | 79.0 | 79.7 | 75.9 | 79.8 | 80.8 |
| Other Hispanic | 71.8 | 68.6 | 70.1 | 72.4 | 73.1 | 75.4 | 76.2 | 74.6 |
2008 Achievable Benchmark: 94%.
Source: Commission on Cancer, American College of Surgeons and American Cancer Society, National Cancer Data Base, 2004-2011.
Denominator: Women under age 70 treated for breast cancer with breast-conserving surgery.
Note: Puerto Ricans include patients receiving cancer care in hospitals in Puerto Rico.
- Importance: Radiation therapy after breast-conserving surgery reduces the risk of cancer recurrence and death.
- Trends: From 2004 to 2011, the percentage of women with breast-conserving surgery who received radiation therapy to the breast improved overall and among all racial/ethnic groups.
- Groups With Disparities:
- In all years, Hispanic and Black women were less likely to receive radiation therapy to the breast compared with White women.
- In all years, Mexicans and other Hispanics were also less likely to receive radiation therapy to the breast compared with White women.
- Achievable Benchmark:
- The 2008 top 5 State achievable benchmark was 94%. The top 5 States that contributed to the achievable benchmark are Kansas, Minnesota, Montana, North Dakota, and Wisconsin.
- At the current rates of improvement, the benchmark could not be achieved overall for about 17 years.
- At the current rates of improvement, Whites would need 14 years to achieve the benchmark, and Hispanics would need 25 years.
Slide 8
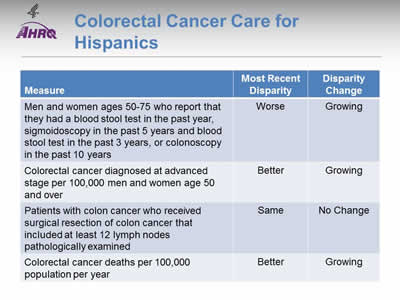
Colorectal Cancer Care for Hispanics
| Measure | Most Recent Disparity | Disparity Change |
|---|---|---|
| Men and women ages 50-75 who report that they had a blood stool test in the past year, sigmoidoscopy in the past 5 years and blood stool test in the past 3 years, or colonoscopy in the past 10 years | Worse | Growing |
| Colorectal cancer diagnosed at advanced stage per 100,000 men and women age 50 and over | Better | Growing |
| Patients with colon cancer who received surgical resection of colon cancer that included at least 12 lymph nodes pathologically examined | Same | No Change |
| Colorectal cancer deaths per 100,000 population per year | Better | Growing |
Note:
- Trends: All measures of colorectal cancer care for Hispanics were improving.
- Groups With Disparities:
- Hispanics were less likely to receive colorectal cancer screening than Whites and this disparity was growing over time.
- Rates of diagnosis with advanced stage colorectal cancer and death due to colorectal cancer were lower among Hispanics compared with Whites. These disparities were growing over time.
- Rates of surgical resection of colon cancer that included at least 12 lymph nodes pathologically examined were similar between Hispanics and Whites.
Slide 9
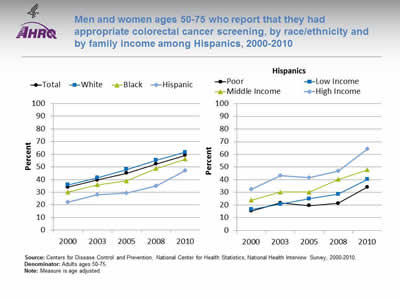
Men and women ages 50-75 who report that they had appropriate colorectal cancer screening, by race/ethnicity and by family income among Hispanics, 2000-2010
Image: Graphs show men and women ages 50-75 who report that they had appropriate colorectal cancer screening:
Left Graph:
| Race/Ethnicity | 2000 | 2003 | 2005 | 2008 | 2010 |
|---|---|---|---|---|---|
| Total | 34.1 | 39.6 | 45.0 | 52.2 | 59.2 |
| Hispanic | 22.0 | 28.1 | 29.3 | 35.0 | 47.2 |
| Black | 30.1 | 35.9 | 39.0 | 48.7 | 56.2 |
| White | 35.8 | 41.4 | 48.0 | 55.2 | 61.6 |
Right Graph (Hispanics):
| Income | 2000 | 2003 | 2005 | 2008 | 2010 |
|---|---|---|---|---|---|
| Poor | 15.3 | 21.7 | 19.5 | 21.3 | 34.2 |
| Low Income | 16.7 | 20.7 | 25.0 | 28.6 | 40.3 |
| Middle Income | 23.9 | 30.3 | 30.3 | 40.2 | 47.8 |
| High Income | 32.6 | 43.2 | 41.6 | 46.8 | 64.3 |
Source: Centers for Disease Control and Prevention, National Center for Health Statistics, National Health Interview Survey, 2000-2010.
Denominator: Adults ages 50-75.
Note: Measure is age adjusted.
- Importance: Screening can detect abnormal colorectal growths before they develop into cancer. Early detection increases treatment options and the chances for cure. Effective screening modalities include fecal occult blood testing (FOBT), FOBT with flexible sigmoidoscopy, and colonoscopy.
- Trends: From 2000 to 2010, the percentage of adults ages 50-75 who received appropriate colorectal cancer screening increased overall and among all racial/ethnic groups.
- Groups With Disparities:
- In all years, the percentage of adults who received appropriate colorectal cancer screening was lower among Hispanics and Blacks compared with Whites.
- In all years, the percentage of adults who received appropriate colorectal cancer screening was lower among poor and low-income Hispanics compared with high-income Hispanics.
Slide 10
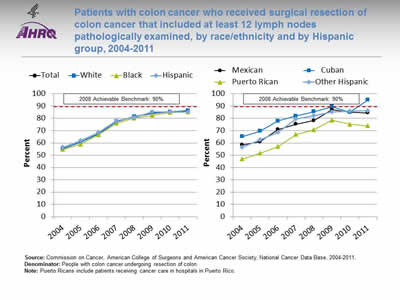
Patients with colon cancer who received surgical resection of colon cancer that included at least 12 lymph nodes pathologically examined, by race/ethnicity and by Hispanic group, 2004-2011
Image: Graphs show patients with colon cancer who received surgical resection of colon cancer that included at least 12 lymph nodes pathologically examined:
Left Graph:
| Race/Ethnicity | 2004 | 2005 | 2006 | 2007 | 2008 | 2009 | 2010 | 2011 |
|---|---|---|---|---|---|---|---|---|
| Total | 55.4 | 60.5 | 67.4 | 77.4 | 81.4 | 84.2 | 85.3 | 86.2 |
| White | 55.3 | 60.7 | 67.3 | 77.4 | 81.6 | 84.5 | 85.4 | 86.4 |
| Black | 54.6 | 58.9 | 66.6 | 76.1 | 80.2 | 82.4 | 84.9 | 85.2 |
| Hispanic | 56.3 | 61.8 | 68.7 | 78.0 | 81.0 | 85.1 | 85.1 | 85.2 |
2008 Achievable Benchmark: 90%.
Right Graph:
| Hispanic Group | 2004 | 2005 | 2006 | 2007 | 2008 | 2009 | 2010 | 2011 |
|---|---|---|---|---|---|---|---|---|
| Mexican | 58.4 | 60.9 | 71.0 | 75.2 | 78.2 | 87.2 | 84.9 | 84.5 |
| Cuban | 65.1 | 69.6 | 77.8 | 81.9 | 85.5 | 89.5 | 84.9 | 94.9 |
| Puerto Rican | 46.9 | 51.6 | 57.0 | 66.9 | 70.8 | 78.5 | 75.2 | 73.9 |
| Other Hispanic | 56.5 | 62.6 | 68.6 | 79.3 | 82.0 | 85.2 | 86.0 | 86.1 |
2008 Achievable Benchmark: 90%.
Source: Commission on Cancer, American College of Surgeons and American Cancer Society, National Cancer Data Base, 2004-2011.
Denominator: People with colon cancer undergoing resection of colon.
Note: Puerto Ricans include patients receiving cancer care in hospitals in Puerto Rico.
- Importance: Recommended cancer treatment depends on different factors, such as the stage or extent of the cancer within the body, especially whether the disease has spread from the original site to other parts of the body. Colon cancer typically begins as a benign polyp that may become cancerous and then spread to local lymph nodes. Hence, ensuring adequate examination of lymph nodes when surgery is performed is important.
- Trends: From 2004 to 2011, the percentage of patients with colon cancer who received surgical resection of colon cancer that included at least 12 lymph nodes pathologically examined improved overall and for all racial/ethnic groups.
- Groups With Disparities:
- In all but 1 year, Puerto Ricans were less likely than Whites to have surgical resection of colon cancer that included at least 12 lymph nodes examined.
- Achievable Benchmark:
- The 2008 top 5 State achievable benchmark was 90%. The top 5 States that contributed to the achievable benchmark are Delaware, Missouri, Utah, Vermont, and Wisconsin.
- At the current rates of improvement, the achievable benchmark could be attained overall and for all racial/ethnic groups within a year.
- Cubans have already achieved the benchmark while Puerto Ricans would not reach the benchmark for 4 years.
Slide 11
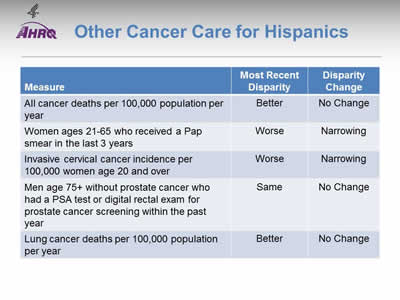
Other Cancer Care for Hispanics
| Measure | Most Recent Disparity | Disparity Change |
|---|---|---|
| All cancer deaths per 100,000 population per year | Better | No Change |
| Women ages 21-65 who received a Pap smear in the last 3 years | Worse | Narrowing |
| Invasive cervical cancer incidence per 100,000 women age 20 and over | Worse | Narrowing |
| Men age 75+ without prostate cancer who had a PSA test or digital rectal exam for prostate cancer screening within the past year | Same | No Change |
| Lung cancer deaths per 100,000 population per year | Better | No Change |
Note:
- Trends: Most measures of other cancer care for Hispanics were improving.
- Groups With Disparities:
- Death rates were lower among Hispanics compared with Whites and were not changing over time for:
- All cancers in aggregate.
- Lung cancer.
- Death rates were lower among Hispanics compared with Whites and were not changing over time for:
- Hispanics were less likely to receive appropriate Pap testing and more likely to develop invasive cervical cancer compared with Whites. These disparities were narrowing over time.
Slide 12

Women ages 21-65 who received a Pap smear in the last 3 years, by race/ethnicity and by insurance among Hispanics, 2000-2010
Image: Graphs show women ages 21-65 who received a Pap smear in the last 3 years:
Left Graph:
| Race/Ethnicity | 2000 | 2005 | 2008 | 2010 |
|---|---|---|---|---|
| Total | 87.5 | 85.3 | 84.5 | 82.8 |
| Hispanic | 80.9 | 79.3 | 81.3 | 78.5 |
| Black | 90.4 | 84.9 | 86.1 | 84.6 |
| White | 89.1 | 87.5 | 86.1 | 84.5 |
Right Graph (Hispanics):
| Insurance | 2000 | 2005 | 2008 | 2010 |
|---|---|---|---|---|
| Private | 88.0 | 87.9 | 87.8 | 86.6 |
| Public | 87.0 | 77.4 | 87.4 | 84.8 |
| Uninsured | 69.6 | 69.3 | 70.1 | 65.3 |
Source: Centers for Disease Control and Prevention, National Center for Health Statistics, National Health Interview Survey, 2000-2010.
Denominator: Women ages 21-65.
Note: Measure is age adjusted.
- Importance: Screening with Pap smears can detect high-grade precancerous cervical lesions that can be removed before they become cancerous.
- Trends: From 2000 to 2010, the percentage of women ages 21-65 who received a Pap smear in the last 3 years decreased overall and among White women; no statistically significant changes were noted among Hispanic women.
- Groups With Disparities:
- In all years, the percentage of women who received a Pap smear was lower among Hispanic women compared with White women.
- In all years, the percentage of women who received a Pap smear was lower among uninsured Hispanic women compared with privately insured Hispanic women.
Slide 13
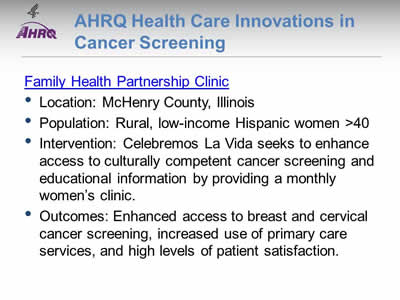
AHRQ Health Care Innovations in Cancer Screening
Family Health Partnership Clinic
- Location: McHenry County, Illinois.
- Population: Rural, low-income Hispanic women >40.
- Intervention: Celebremos La Vida seeks to enhance access to culturally competent cancer screening and educational information by providing a monthly women's clinic.
- Outcomes: Enhanced access to breast and cervical cancer screening, increased use of primary care services, and high levels of patient satisfaction.
Slide 14
National Healthcare Quality and Disparities Report Chartbook on Health Care for Hispanics
Part 2: Trends in Priorities of the Heckler Report
Care for Cardivascular Diseases
Note:
- Thirty years ago, the Heckler Report found that:
- Cardiovascular disease (CVD) is a major cause of death in Hispanics, although the rate is lower than in Whites. To date, national epidemiologic data on CVD mortality in Hispanics are limited.
- There appears to be a strong inverse relationship between socioeconomic status (SES) and hypertension in Hispanics, similar to that found for Blacks and Whites.
- Diabetes mellitus is a major problem in Hispanics, especially in Mexican Americans and Puerto Ricans living in the United States.
- The generally higher prevalence of obesity, noninsulin-dependent diabetes, hypertension, high LDL cholesterol and low HDL cholesterol levels in Hispanics might be expected to increase their CVD risk. Those Mexican Americans with lowest SES and level of acculturation have significantly worse CVD risk factor profiles than those in higher SES groups.
Slide 15
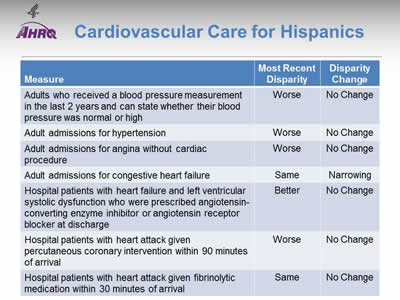
Cardiovascular Care for Hispanics
| Measure | Most Recent Disparity | Disparity Change |
|---|---|---|
| Adults who received a blood pressure measurement in the last 2 years and can state whether their blood pressure was normal or high | Worse | No Change |
| Adult admissions for hypertension | Worse | No Change |
| Adult admissions for angina without cardiac procedure | Worse | No Change |
| Adult admissions for congestive heart failure | Same | Narrowing |
| Hospital patients with heart failure and left ventricular systolic dysfunction who were prescribed angiotensin-converting enzyme inhibitor or angiotensin receptor blocker at discharge | Better | No Change |
| Hospital patients with heart attack given percutaneous coronary intervention within 90 minutes of arrival | Worse | No Change |
| Hospital patients with heart attack given fibrinolytic medication within 30 minutes of arrival | Same | No Change |
Note:
- Trends: Most measures of cardiovascular care for Hispanics were improving.
- Groups With Disparities:
- Hispanics were less likely than Whites to have their blood pressure checked and to receive timely percutaneous coronary intervention when hospitalized with a heart attack. These disparities did not change over time.
- Hispanics had higher rates of admission than Whites for hypertension and for angina and these disparities did not change over time.
- Hispanics and Whites had similar rates of admission for congestive heart failure. This represents the elimination of a previously observed disparity.
- Hispanics and Whites had similar rates of receipt of fibrinolytic medication for heart attack.
- Hispanics hospitalized with heart failure were more likely to be prescribed angiotensin-converting enzyme inhibitor or angiotensin receptor blocker at discharge and this disparity did not change over time.
Slide 16
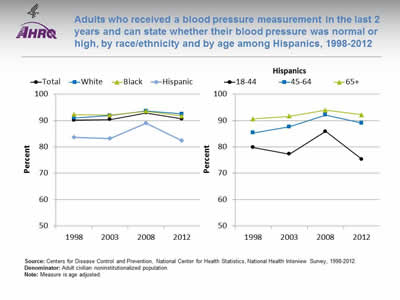
Adults who received a blood pressure measurement in the last 2 years and can state whether their blood pressure was normal or high, by race/ethnicity and by age among Hispanics, 1998-2012
Image: Graphs show adults who received a blood pressure measurement in the last 2 years and can state whether their blood pressure was normal or high:
Left Graph:
| Race/Ethnicity | 1998 | 2003 | 2008 | 2012 |
|---|---|---|---|---|
| Total | 90.1 | 90.4 | 92.9 | 90.6 |
| White | 91.0 | 91.9 | 93.6 | 92.5 |
| Black | 92.3 | 92.1 | 93.5 | 91.7 |
| Hispanic | 83.6 | 83.2 | 89.0 | 82.4 |
Right Graph (Hispanics):
| Age | 1998 | 2003 | 2008 | 2012 |
|---|---|---|---|---|
| 18-44 | 79.8 | 77.3 | 85.9 | 75.3 |
| 45-64 | 85.3 | 87.6 | 92.1 | 89.0 |
| 65+ | 90.6 | 91.6 | 93.9 | 92.2 |
Source: Centers for Disease Control and Prevention, National Center for Health Statistics, National Health Interview Survey, 1998-2012.
Denominator: Adult civilian noninstitutionalized population.
Note: Measure is age adjusted.
- Importance: Early detection and treatment of high blood pressure can prevent heart failure, kidney failure, and stroke. Because high blood pressure typically causes no symptoms, screening is essential.
- Trends: From 1998 to 2012, the percentage of adults who received a blood pressure measurement in the last 2 years and can state whether their blood pressure was normal or high did not change overall or for any racial/ethnic group.
- Groups With Disparities:
- In all years, Hispanic adults were less likely to receive a blood pressure measurement compared with Whites.
- In all years, Hispanics ages 18-44 were less likely to receive a blood pressure measurement compared with Hispanics age 65 and over.
Slide 17
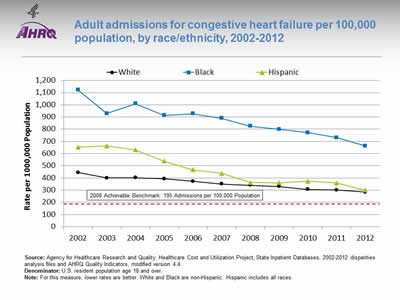
Adult admissions for congestive heart failure per 100,000 population, by race/ethnicity, 2002-2012
Image: Graph shows adult admissions for congestive heart failure per 100,000 population:
| Year | White | Black | Hispanic |
|---|---|---|---|
| 2002 | 444.1 | 1121.8 | 653.0 |
| 2003 | 399.5 | 927.8 | 662.2 |
| 2004 | 400.9 | 1009.3 | 629.9 |
| 2005 | 392.8 | 912.4 | 538.0 |
| 2006 | 373.0 | 927.5 | 465.9 |
| 2007 | 350.8 | 890.2 | 437.1 |
| 2008 | 339.9 | 824.6 | 362.8 |
| 2009 | 329.7 | 799.2 | 360.2 |
| 2010 | 306.3 | 771.4 | 372.7 |
| 2011 | 301.1 | 730.5 | 359.2 |
| 2012 | 283.2 | 662.2 | 298.9 |
2008 Achievable Benchmark: 195 Admissions per 100,000 Population.
Source: Agency for Healthcare Research and Quality, Healthcare Cost and Utilization Project, State Inpatient Databases, 2002-2012 disparities analysis files and AHRQ Quality Indicators, modified version 4.4.
Denominator: U.S. resident population age 18 and over.
Note: For this measure, lower rates are better. White and Black are non-Hispanic. Hispanic includes all races.
- Importance: Racial disparities in care for congestive heart failure have been observed.
- Trends: From 2002 to 2012, the rate of admission for congestive heart failure among adults decreased significantly for all racial/ethnic groups.
- Groups With Disparities:
- In all years, compared with White patients, rates of admission for congestive heart failure were higher among Black patients.
- From 2002 to 2007, rates of admission for congestive heart failure were higher among Hispanic patients compared with White patients; in more recent years, this disparity was eliminated.
- Achievable Benchmark:
- The 2008 top 4 State achievable benchmark for adult congestive heart failure admissions was 195 admissions per 100,000 population. The top 4 States that contributed to the achievable benchmark are Colorado, Oregon, Utah, and Vermont.
- At current rates of improvement, Hispanic patients could achieve the benchmark in 3 years and White patients could achieve it in 6 years. Black patients would need 12 years to achieve the benchmark.
Slide 18
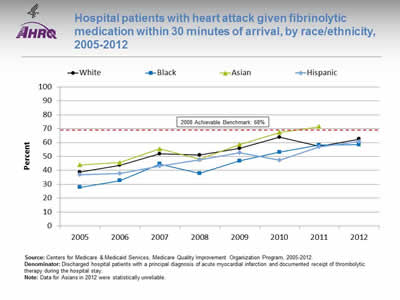
Hospital patients with heart attack given fibrinolytic medication within 30 minutes of arrival, by race/ethnicity, 2005-2012
Image: Graph shows hospital patients with heart attack given fibrinolytic medication within 30 minutes of arrival:
| Race/Ethnicity | 2005 | 2006 | 2007 | 2008 | 2009 | 2010 | 2011 | 2012 |
|---|---|---|---|---|---|---|---|---|
| White | 38.7 | 43.6 | 51.8 | 51.0 | 55.7 | 63.8 | 57.3 | 62.5 |
| Black | 27.7 | 32.6 | 44.5 | 37.8 | 46.8 | 53 | 58.2 | 58.5 |
| Hispanic | 36.8 | 37.8 | 43.2 | 47.6 | 52.8 | 47.3 | 57 | 60.8 |
| Asian | 43.9 | 45.5 | 55.5 | 48.2 | 58.6 | 67.3 | 71.4 |
2008 Achievable Benchmark: 68%.
Source: Centers for Medicare & Medicaid Services, Medicare Quality Improvement Organization Program, 2005-2012.
Denominator: Discharged hospital patients with a principal diagnosis of acute myocardial infarction and documented receipt of thrombolytic therapy during the hospital stay.
Note: Data for Asians in 2012 were statistically unreliable.
- Importance: Some heart attacks are caused by blood clots. Early actions, such as fibrinolytic medication, may open blockages caused by blood clots, reduce heart muscle damage, and save lives. To be effective, these actions need to be performed quickly after the start of a heart attack.
- Trends: From 2005 to 2012, the percentage of patients who received timely fibrinolytic medication improved overall and for all racial/ethnic groups.
- Groups With Disparities: Until 2011, the percentage of patients who received timely fibrinolytic medication was significantly higher for Whites than for Blacks.
- Achievable Benchmark:
- The 2010 top 5 State achievable benchmark was 68%. The top 5 States that contributed to the achievable benchmark are Arkansas, California, Georgia, Mississippi, and Texas.
- Asian heart attack patients achieved the benchmark in 2011.
- At the current rate of improvement, the achievable benchmark could be attained overall in 2 years. In addition, White, Black, and Hispanic heart attack patients should all reach the benchmark in 2 years.
Slide 19
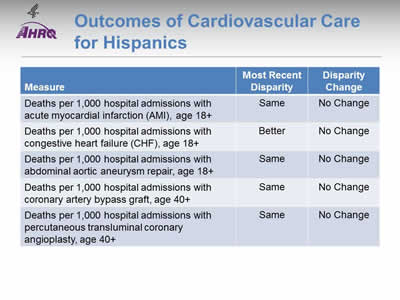
Outcomes of Cardiovascular Care for Hispanics
| Measure | Most Recent Disparity | Disparity Change |
|---|---|---|
| Deaths per 1,000 hospital admissions with acute myocardial infarction (AMI), age 18+ | Same | No Change |
| Deaths per 1,000 hospital admissions with congestive heart failure (CHF), age 18+ | Better | No Change |
| Deaths per 1,000 hospital admissions with abdominal aortic aneurysm repair, age 18+ | Same | No Change |
| Deaths per 1,000 hospital admissions with coronary artery bypass graft, age 40+ | Same | No Change |
| Deaths per 1,000 hospital admissions with percutaneous transluminal coronary angioplasty, age 40+ | Same | No Change |
Note:
- Trends: Most measures of deaths from cardiovascular care for Hispanics were improving.
- Groups With Disparities:
- Hispanics and Whites had similar death rates when hospitalized for:
- Acute myocardial infarction.
- Abdominal aortic aneurysm repair.
- Coronary artery bypass graft surgery.
- Percutaneous transluminal coronary angioplasty.
- Hispanics and Whites had similar death rates when hospitalized for:
- Hispanics had lower death rates than Whites when hospitalized for congestive heart failure and there was no change in this disparity over time.
Slide 20
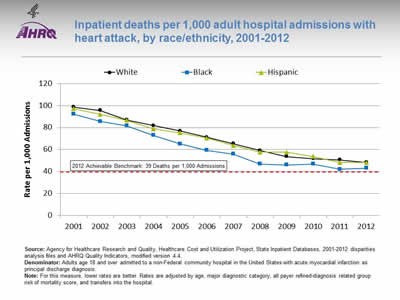
Inpatient deaths per 1,000 adult hospital admissions with heart attack, by race/ethnicity, 2001-2012
Image: Graph shows inpatient deaths per 1,000 adult hospital admissions with heart attack:
| Year | White | Black | Hispanic |
|---|---|---|---|
| 2001 | 98.7 | 92.2 | 97.2 |
| 2002 | 95.5 | 85.5 | 92.0 |
| 2003 | 86.9 | 81.6 | 86.6 |
| 2004 | 81.8 | 72.9 | 78.8 |
| 2005 | 76.9 | 65.2 | 75.2 |
| 2006 | 71.2 | 59.2 | 70.4 |
| 2007 | 65.4 | 55.8 | 63.6 |
| 2008 | 59.1 | 46.8 | 57.6 |
| 2009 | 53.7 | 46.1 | 57.5 |
| 2010 | 51.7 | 46.7 | 53.6 |
| 2011 | 50.5 | 42.1 | 48.1 |
| 2012 | 48.3 | 43.0 | 48.0 |
2012 Achievable Benchmark: 39 Deaths per 1,000 Admissions.
Source: Agency for Healthcare Research and Quality, Healthcare Cost and Utilization Project, State Inpatient Databases, 2001-2012 disparities analysis files and AHRQ Quality Indicators, modified version 4.4.
Denominator: Adults age 18 and over admitted to a non-Federal community hospital in the United States with acute myocardial infarction as principal discharge diagnosis.
Note: For this measure, lower rates are better. Rates are adjusted by age, major diagnostic category, all payer refined-diagnosis related group risk of mortality score, and transfers into the hospital.
- Importance: Racial disparities in heart attack care have been observed.
- Trends: From 2001 to 2012, the risk-adjusted inpatient mortality rate for hospital admissions with heart attack decreased significantly for all racial/ethnic groups.
- Groups With Disparities: In 2012, Black patients had lower inpatient mortality rates for hospital admissions with heart attack than White patients.
- Achievable Benchmark:
- The 2008 top 4 State achievable benchmark for inpatient heart attack mortality was 48 deaths per 1,000 admissions. By 2012, this benchmark had been attained for all racial/ethnic groups.
- Because the 2008 benchmark was achieved by the total population, a new 2012 top 4 State achievable benchmark was set at 39 deaths per 1,000 admissions. The top 4 States that contributed to the achievable benchmark are Alaska, Arizona, Michigan, and Rhode Island.
- At current rates of improvement, all racial/ethnic groups could reach the 2012 benchmark in approximately 2 years.
Slide 21
National Healthcare Quality and Disparities Report Chartbook on Health Care for Hispanics
Part 2: Trends in Priorities of the Heckler Report
Care for Substance Use Disorders
Note:
- Thirty years ago, the Heckler Report found that:
- Mortality statistics for the United States do not identify Hispanics separately, and until 1976, most other common measures of alcohol-related problems such as arrest and hospital discharge rates did not provide a Hispanic identifier. The 1979 National Institute on Alcohol Abuse and Alcoholism National Survey indicates that based on self-reported data, Hispanic American males age 18 and over have higher levels of heavy drinking and higher rates of alcohol-related problems than do nonminorities.
- Results from the 1983 single-room occupancy hotels study of drug abuse in New York City suggest that Hispanics have higher rates of drug use than Whites for marijuana, cocaine, heroin, and illicit methadone.
- Lung and esophageal cancer morbidity and mortality rates, known to be related to smoking, are lower for Hispanics than for Whites and Blacks.
Slide 22
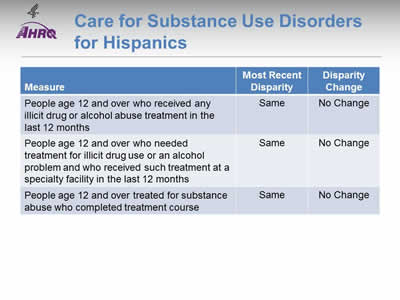
Care for Substance Use Disorders for Hispanics
| Measure | Most Recent Disparity | Disparity Change |
|---|---|---|
| People age 12 and over who received any illicit drug or alcohol abuse treatment in the last 12 months | Same | No Change |
| People age 12 and over who needed treatment for illicit drug use or an alcohol problem and who received such treatment at a specialty facility in the last 12 months | Same | No Change |
| People age 12 and over treated for substance abuse who completed treatment course | Same | No Change |
Note:
- Trends: No measure of care for substance use disorders was improving for Hispanics.
- Groups With Disparities: Hispanics and Whites had similarly low rates of treatment for substance use disorders.
Slide 23
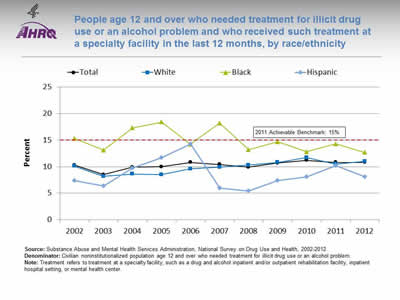
People age 12 and over who needed treatment for illicit drug use or an alcohol problem and who received such treatment at a specialty facility in the last 12 months, by race/ethnicity
Image: Graph shows people age 12 and over who needed treatment for illicit drug use or an alcohol problem and who received such treatment at a specialty facility in the last 12 months:
| Race/Ethnicity | 2002 | 2003 | 2004 | 2005 | 2006 | 2007 | 2008 | 2009 | 2010 | 2011 | 2012 |
|---|---|---|---|---|---|---|---|---|---|---|---|
| Total | 10.3 | 8.5 | 9.9 | 10.0 | 10.8 | 10.4 | 9.9 | 10.7 | 11.2 | 10.8 | 10.8 |
| White | 10.1 | 8.2 | 8.6 | 8.5 | 9.6 | 9.9 | 10.3 | 10.8 | 11.7 | 10.5 | 11.0 |
| Black | 15.3 | 13.1 | 17.3 | 18.4 | 14.2 | 18.2 | 13.2 | 14.7 | 12.8 | 14.3 | 12.7 |
| Hispanic | 7.4 | 6.4 | 9.7 | 11.7 | 14.3 | 6.0 | 5.4 | 7.4 | 8.1 | 10.2 | 8.1 |
2011 Achievable Benchmark: 15%.
Source: Substance Abuse and Mental Health Services Administration, National Survey on Drug Use and Health, 2002-2012.
Denominator: Civilian noninstitutionalized population age 12 and over who needed treatment for illicit drug use or an alcohol problem.
Note: Treatment refers to treatment at a specialty facility, such as a drug and alcohol inpatient and/or outpatient rehabilitation facility, inpatient hospital setting, or mental health center.
- Overall Rate: In 2012, only 10.8% of people age 12 and over who needed treatment for illicit drug use or an alcohol problem received such treatment at a specialty facility in the last 12 months.
- Groups With Disparities: From 2002 to 2012, there were no statistically significant differences by race/ethnicity.
- Achievable Benchmark:
- The 2011 top 6 State achievable benchmark was 15%. The top 6 States that contributed to the achievable benchmark are Alabama, Alaska, Delaware, Maryland, Oregon, and Utah.
- At the current rate, the total population would need 30 years to achieve this benchmark. Whites could achieve the benchmark in 15 years while Blacks and Hispanics are moving away from the benchmark.
Slide 24
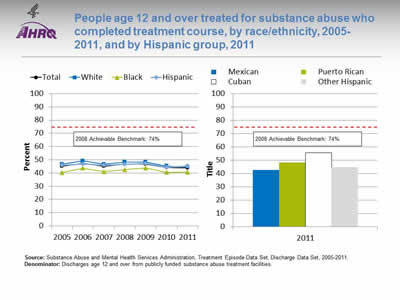
People age 12 and over treated for substance abuse who completed treatment course, by race/ethnicity, 2005-2011, and by Hispanic group, 2011
Image: Graph and bar chart show people age 12 and over treated for substance abuse who completed treatment course:
Left Graph:
| Race/Ethnicity | 2005 | 2006 | 2007 | 2008 | 2009 | 2010 | 2011 |
|---|---|---|---|---|---|---|---|
| Total | 45.0 | 47.5 | 45.1 | 46.6 | 46.7 | 44.1 | 43.7 |
| Hispanic | 46.0 | 46.7 | 45.8 | 46.5 | 47.1 | 44.4 | 45.3 |
| White | 46.7 | 49.2 | 46.6 | 48.3 | 48.3 | 45.3 | 44.5 |
| Black | 40.4 | 43.6 | 41.0 | 42.5 | 43.8 | 40.6 | 40.7 |
2008 Achievable Benchmark: 74%.
Right Graph (Hispanic Group):
- Mexican - 42.8.
- Puerto Rican - 48.3.
- Cuban - 55.7.
- Other Hispanic - 44.8.
2008 Achievable Benchmark: 74%.
Source: Substance Abuse and Mental Health Services Administration, Treatment Episode Data Set, Discharge Data Set, 2005-2011.
Denominator: Discharges age 12 and over from publicly funded substance abuse treatment facilities.
Note:
- Overall Rate: In 2011, 43.7% of people age 12 and over treated for substance abuse completed their treatment course.
- Groups With Disparities:
- In 4 of 7 years, Blacks who were treated for substance abuse were significantly less likely than Whites to complete treatment.
- Hispanics and Whites had similar rates of treatment completion.
- In 2011, Cubans who were treated for substance abuse were significantly more likely than Whites to complete treatment.
- Achievable Benchmark:
- The 2008 top 5 State achievable benchmark was 74%. The top 5 States that contributed to the achievable benchmark are Colorado, Connecticut, District of Columbia, Mississippi, and Texas.
- No group showed progress toward the benchmark.
Slide 25
National Healthcare Quality and Disparities Report Chartbook on Health Care for Hispanics
Part 2: Trends in Priorities of the Heckler Report
Care for Diabetes
Note:
- Thirty years ago, the Heckler Report found that:
- Among the 14.6 million individuals of Hispanic origin in the United States, the prevalence of diabetes was more than three times the rate in the White population.
- From available data, it is clear than diabetes is a major health burden contributing to excess morbidity and mortality in the Mexican American population. The data are still inadequate, however, to say with certainty whether this increased prevalence of diabetes is shared by other Hispanic subgroups.
Slide 26
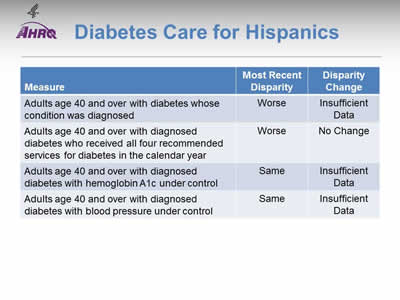
Diabetes Care for Hispanics
| Measure | Most Recent Disparity | Disparity Change |
|---|---|---|
| Adults age 40 and over with diabetes whose condition was diagonsed | Worse | Insufficient Data |
| Adults age 40 and over with diagnosed diabetes who received all four recommended services for diabetes in the calendar year | Worse | No Change |
| Adults age 40 and over with diagnosed diabetes with hemoglobin A1c under control | Same | Insufficient Date |
| Adults age 40 and over with diagnosed diabetes with blood pressure under control | Same | Insufficient Data |
Note:
- Trends: Data are insufficient to assess trends for most measures of diabetes care for Hispanics.
- Groups With Disparities:
- Hispanics were less likely than Whites to have their diabetes diagnosed.
- After diagnosis, Hispanics were less likely than Whites to receive recommended services for diabetes and this disparity was not changing over time.
Slide 27
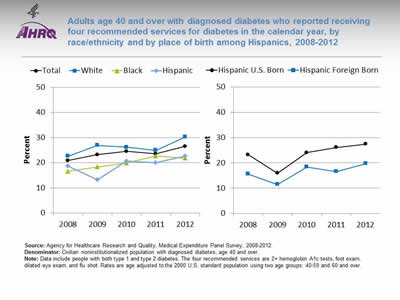
Adults age 40 and over with diagnosed diabetes who reported receiving four recommended services for diabetes in the calendar year, by race/ethnicity and by place of birth among Hispanics, 2008-2012
Image: Graphs show adults age 40 and over with diagnosed diabetes who reported receiving four recommended services for diabetes in the calendar year:
Left Graph:
| Race/Ethnicity | 2008 | 2009 | 2010 | 2011 | 2012 |
|---|---|---|---|---|---|
| Total | 21.0 | 23.2 | 24.6 | 23.6 | 26.6 |
| White | 22.7 | 26.9 | 26.2 | 25.0 | 30.3 |
| Black | 16.6 | 18.3 | 20.0 | 22.8 | 21.8 |
| Hispanic | 18.7 | 13.3 | 20.7 | 20.1 | 22.7 |
Right Graph:
| Place of Birth | 2008 | 2009 | 2010 | 2011 | 2012 |
|---|---|---|---|---|---|
| Hispanic U.S. Born | 23.3 | 15.9 | 24.1 | 26.1 | 27.5 |
| Hispanic Foreign Born | 15.6 | 11.4 | 18.4 | 16.6 | 19.7 |
Source: Agency for Healthcare Research and Quality, Medical Expenditure Panel Survey, 2008-2012.
Denominator: Civilian noninstitutionalized population with diagnosed diabetes, age 40 and over.
Note: Data include people with both type 1 and type 2 diabetes. The four recommended services are 2+ hemoglobin A1c tests, foot exam, dilated eye exam, and flu shot. Rates are age adjusted to the 2000 U.S. standard population using two age groups: 40-59 and 60 and over.
- Importance:
- Regular hemoglobin A1c (HbA1c) tests, foot exams, dilated eye exams, and flu shots help people keep their diabetes under control and avoid diabetic complications.
- A composite measure is used to track the national rate of receipt of all four of these recommended annual diabetes interventions.
- Trends:
- From 2008 to 2012, among adults age 40 and over with diagnosed diabetes, improvements were observed overall and among Blacks.
- However, only slightly more than one-fourth (26.6 percent) of adults with diabetes reported receiving all four recommended services in 2012.
- Groups With Disparities:
- In 2 of 5 years, including 2012, Hispanics and Blacks were less likely than Whites to receive the recommended services.
- In all years, foreign-born Hispanics were less likely than U.S.-born Hispanics to receive the recommended services, but these differences were not statistically significant.
Slide 28
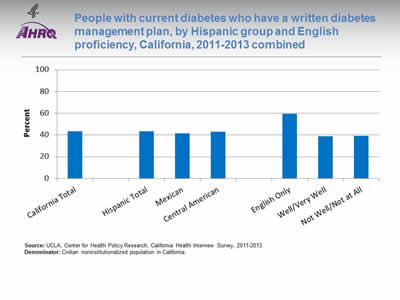
People with current diabetes who have a written diabetes management plan, by Hispanic group and English proficiency, California, 2011-2013 combined
Image: Chart shows people with current diabetes who have a written diabetes management plan. By Hispanic group: California Total - 43.2%; Hispanic Total - 43.3%; Mexican - 41.6%; Central American - 42.9%. By English proficiency: English Only - 59.4%; Well/Very Well - 38.9%; Not Well/Not at All - 39%.
Source: UCLA, Center for Health Policy Research, California Health Interview Survey, 2011-2013.
Denominator: Civilian noninstitutionalized population in California.
Note:
- Importance:
- A successful partnership for diabetes care requires providers to educate patients about daily management of their diabetes. Hence, providers should develop a written diabetes management plan, especially for patients with a history of uncontrolled diabetes.
- National data on diabetes management and outcomes for some underserved populations are not available from the national data sources in the QDR. These populations include people with limited English proficiency; individuals who speak a language other than English at home; and Hispanic subpopulations. To address some of these data gaps, we show additional data from the California Health Interview Survey.
- Overall Rate: Only 43% of Californians with current diabetes had a written diabetes management plan in 2011-2013.
- Groups With Disparities: Among Hispanic Californians with diabetes, those who spoke English well/very well and not well/not at all were less likely than those who spoke English only to have a written diabetes management plan.
Slide 29
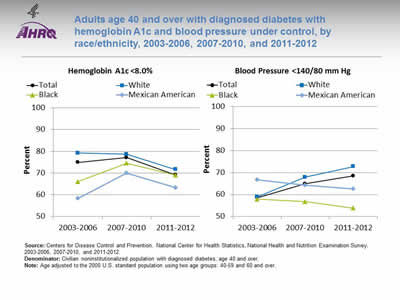
Adults age 40 and over with diagnosed diabetes with hemoglobin A1c and blood pressure under control, by race/ethnicity, 2003-2006, 2007-2010, and 2011-2012
Image: Graphs shows adults age 40 and over with diagnosed diabetes with hemoglobin A1c and blood pressure under control:
Left Graph (Hemoglobin A1c <8.0%):
| Race/Ethnicity | 2003-2006 | 2007-2010 | 2011-2012 |
|---|---|---|---|
| Total | 74.9 | 77.1 | 69.2 |
| Mexican American | 58.3 | 69.9 | 63.3 |
| Black | 66.0 | 74.5 | 69.1 |
| White | 79.2 | 78.6 | 71.6 |
Right Graph (Blood Pressure <140/80 mm Hg):
| Race/Ethnicity | 2003-2006 | 2007-2010 | 2011-2012 |
|---|---|---|---|
| Total | 58.5 | 64.9 | 68.5 |
| Mexican American | 66.8 | 64.2 | 62.5 |
| Black | 57.9 | 56.7 | 53.8 |
| White | 58.9 | 67.9 | 72.8 |
Source: Centers for Disease Control and Prevention, National Center for Health Statistics, National Health and Nutrition Examination Survey, 2003-2006, 2007-2010, and 2011-2012.
Denominator: Civilian noninstitutionalized population with diagnosed diabetes, age 40 and over.
Note: Age adjusted to the 2000 U.S. standard population using two age groups: 40-59 and 60 and over.
- Importance: People diagnosed with diabetes are often at higher risk for other cardiovascular risk factors, such as high blood pressure. Having these conditions in combination with diagnosed diabetes increases the likelihood of complications, such as heart and kidney diseases, blindness, nerve damage, and stroke. Patients who manage their diagnosed diabetes and maintain an HbA1c level <8% and blood pressure <140/80 mm Hg can decrease these risks.
- Overall Rate: Among adults age 40 and over with diagnosed diabetes, 69.2% achieved HbA1c less than 8% and 68.5% achieved blood pressure less than 140/80 mm Hg in 2011-2012.
- Groups With Disparities:
- In 2003-2006, Blacks and Mexican Americans were less likely than Whites to have their HbA1c under control. Differences in 2007-2010 and 2011-2012 were not statistically significant.
- In 2007-2010 and 2011-2012, Blacks were less likely than Whites to have their blood pressure under control.
Slide 30
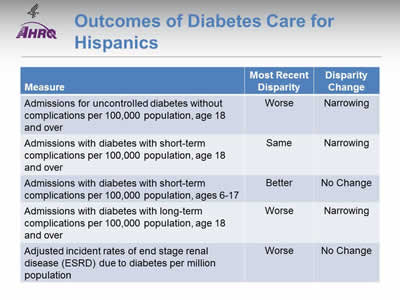
Outcomes of Diabetes Care for Hispanics
- Trends: Most outcomes of diabetes care for Hispanics were improving.
- Groups with Disparities:
- Hispanics had higher rates of admission than Whites for uncontrolled diabetes and for long-term complications of diabetes. These disparities were narrowing over time.
- Hispanic adults and White adults had similar rates of admission for short-term complications of diabetes. This represents the elimination of a previously observed disparity.
- Hispanic children had lower rates of admission than White children and this disparity was not changing over time.
- Hispanics had higher rates of ESRD due to diabetes than Whites and this disparity was not changing over time.
Slide 31
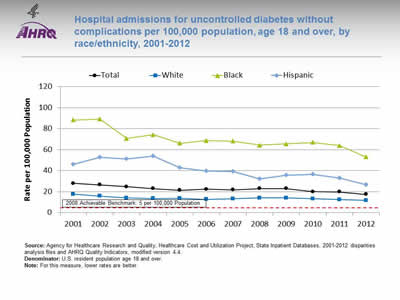
Hospital admissions for uncontrolled diabetes without complications per 100,000 population, age 18 and over, by race/ethnicity, 2001-2012
Image: Graph shows hospital admissions for uncontrolled diabetes without complications per 100,000 population:
| Race/Ethnicity | 2001 | 2002 | 2003 | 2004 | 2005 | 2006 | 2007 | 2008 | 2009 | 2010 | 2011 | 2012 |
|---|---|---|---|---|---|---|---|---|---|---|---|---|
| Total | 27.9 | 26.4 | 24.8 | 23.0 | 21.2 | 22.4 | 21.8 | 23.0 | 22.9 | 20.0 | 19.8 | 17.3 |
| White | 17.6 | 15.8 | 14.0 | 13.5 | 13.6 | 12.6 | 13.2 | 14.1 | 14.0 | 13.1 | 12.4 | 11.7 |
| Black | 88.3 | 89.1 | 70.6 | 74.2 | 66.1 | 68.7 | 68.1 | 64.4 | 65.5 | 66.9 | 64.0 | 53.1 |
| Hispanic | 46.0 | 52.9 | 51.1 | 53.8 | 42.9 | 39.8 | 39.3 | 32.2 | 35.8 | 36.4 | 33.1 | 26.7 |
2008 Achievable Benchmark: 5 per 100,000 Population.
Source: Agency for Healthcare Research and Quality, Healthcare Cost and Utilization Project, State Inpatient Databases, 2001-2012 disparities analysis files and AHRQ Quality Indicators, modified version 4.4.
Denominator: U.S. resident population age 18 and over.
Note: For this measure, lower rates are better.
- Importance:
- Individuals who do not achieve good control of their diabetes may develop symptoms that require correction through hospitalization.
- Admission rates for uncontrolled diabetes may be reduced by better outpatient treatment and patients' tighter adherence to the recommended diet and medication.
- Trends:
- The rate of hospital admissions for uncontrolled diabetes without complications per 100,000 population decreased from 27.9 in 2001 to 17.3 in 2012.
- From 2001 to 2012, the rate of hospital admissions per 100,000 population decreased for all populations:
- For Hispanics, from 46.0 to 26.7.
- For Blacks, from 88.3 to 53.1.
- For Whites, from 17.6 to 11.7.
- Groups With Disparities: In all years, the rate of hospital admissions for uncontrolled diabetes was higher for Blacks and Hispanics compared with Whites.
- Achievable Benchmark:
- The 2008 top 4 State achievable benchmark was 5 admissions per 100,000 population age 18 and over. The top 4 States that contributed to the achievable benchmark are Colorado, Hawaii, Utah, and Vermont.
- At the current rate, the benchmark could not be met for the total population for approximately 17 years.
- At the current rates, Whites could not reach the benchmark for 22 years and Blacks would need 20 years. Hispanics could reach the benchmark in 10 years.
Slide 32
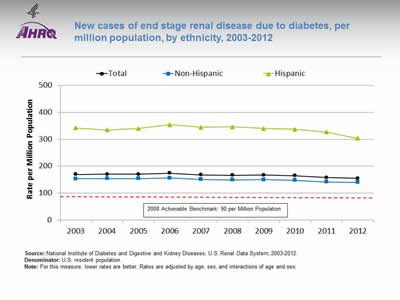
New cases of end stage renal disease due to diabetes, per million population, by ethnicity, 2003-2012
Image: Graph shows new cases of end stage renal disease due to diabetes, per million population:
| Ethnicity | 2003 | 2004 | 2005 | 2006 | 2007 | 2008 | 2009 | 2010 | 2011 | 2012 |
|---|---|---|---|---|---|---|---|---|---|---|
| Total | 169.5 | 169.6 | 170.2 | 173.6 | 167.9 | 165.8 | 166.7 | 164.2 | 157.7 | 154.3 |
| Hispanic | 342.7 | 334.7 | 340.3 | 353.7 | 345.1 | 346.3 | 339.8 | 336.7 | 326.8 | 303.8 |
| Non-Hispanic | 152.6 | 153.6 | 153.9 | 156.4 | 150.9 | 148.7 | 150.2 | 147.7 | 141.4 | 140.0 |
2008 Achievable Benchmark: 90 per Million Population.
Source: National Institute of Diabetes and Digestive and Kidney Diseases, U.S. Renal Data System, 2003-2012.
Denominator: U.S. resident population.
Note: For this measure, lower rates are better. Rates are adjusted by age, sex, and interactions of age and sex.
- Importance: Diabetes is the most common cause of kidney failure. Keeping blood glucose levels under control can prevent or slow the progression of kidney disease. When kidney disease is detected early, medication can slow the disease's progress; when detected late, it commonly progresses to end stage renal disease requiring dialysis or kidney transplantation. While some cases of kidney failure due to diabetes cannot be avoided, other cases reflect inadequate control of blood glucose or delayed detection and treatment of early kidney disease due to diabetes.
- Trends: From 2003 to 2012, the overall rate of new cases of ESRD due to diabetes improved for Hispanics.
- Groups With Disparities: In all years, Hispanics had higher rates than non-Hispanics.
- Achievable Benchmark:
- The 2008 top 5 State achievable benchmark was 90 per million population. The top 5 States that contributed to the achievable benchmark are Alaska, Maine, New Hampshire, Rhode Island, and Vermont.
- At current rates of change, the benchmark would not be achieved overall or by any ethnic group for decades.
Slide 33
National Healthcare Quality and Disparities Report Chartbook on Health Care for Hispanics
Part 2: Trends in Priorities of the Heckler Report
Suicide Prevention and Mental Health Care
Note:
- Thirty years ago, the Heckler Report found that:
- National data are not available for homicide deaths among Hispanic populations, but data from the five-State southwestern region, where more than 60% of Hispanics reside, show that from 1976 to 1980, the homicide rate was 21.6 per 100,000, more than 2.5 times the rate of the White population (7.7 per 100,000) in the same geographic area.
Slide 34
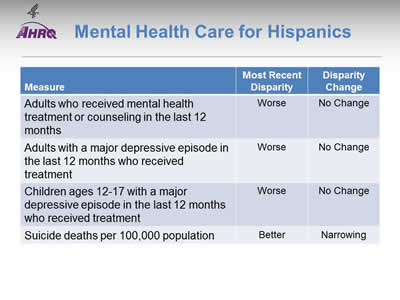
Mental Health Care for Hispanics
Note:
- Trends: No measure of mental health care for Hispanics was improving; suicide deaths were increasing.
- Groups With Disparities:
- Hispanic adults were less likely than White adults to receive mental health treatment or counseling and this disparity was not changing over time.
- When experiencing a major depressive episode, Hispanic adults and adolescents were less likely than Whites to receive treatment. These disparities were not changing over time.
- Hispanics had lower suicide death rates than Whites, but this disparity was narrowing as Hispanic suicide deaths increased.
Slide 35
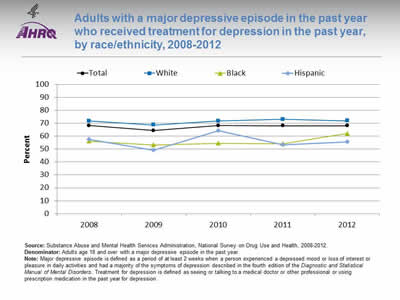
Adults with a major depressive episode in the past year who received treatment for depression in the past year, by race/ethnicity, 2008-2012
Image: Graph shows adults with a major depressive episode in the past year who received treatment for depression in the past year:
Source: Substance Abuse and Mental Health Services Administration, National Survey on Drug Use and Health, 2008-2012.
Denominator: Adults age 18 and over with a major depressive episode in the past year.
Note: Major depressive episode is defined as a period of at least 2 weeks when a person experienced a depressed mood or loss of interest or pleasure in daily activities and had a majority of the symptoms of depression described in the fourth edition of the Diagnostic and Statistical Manual of Mental Disorders. Treatment for depression is defined as seeing or talking to a medical doctor or other professional or using prescription medication in the past year for depression.
| Race/Ethnicity | 2008 | 2009 | 2010 | 2011 | 2012 |
|---|---|---|---|---|---|
| Total | 68.3 | 64.4 | 68.2 | 68.1 | 68.0 |
| White | 71.8 | 68.7 | 71.8 | 73.1 | 72.0 |
| Black | 56.1 | 53.2 | 54.5 | 54.3 | 62.1 |
| Hispanic | 57.4 | 49.3 | 64.2 | 53.2 | 55.6 |
- Importance: The United States Preventive Services Task Force (USPSTF) recommends screening adults for depression when staff-assisted depression care supports are in place to ensure accurate diagnosis, effective treatment , and followup (USPSTF, 2015*).
- Overall Rate: In 2012, 68% of adults with a major depressive episode received treatment for depression.
- Groups With Disparities:
- In all years, Black adults with depression were less likely than White adults to receive treatment.
- In every year except 2010, Hispanic adults with depression were less likely than White adults to receive treatment.
* Depression in adults: screening. Released December 2009. Current as of July 2015. http://www.uspreventiveservicestaskforce.org/Page/Document/UpdateSummaryFinal/depression-in-adults-screening?ds=1&s=depression.
Slide 36
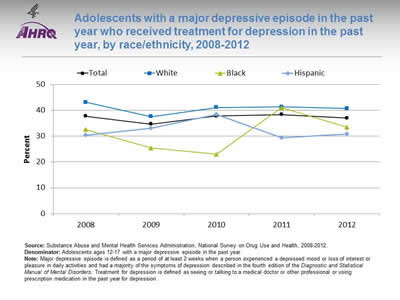
Adolescents with a major depressive episode in the past year who received treatment for depression in the past year, by race/ethnicity, 2008-2012
Image: Graph shows adolescents with a major depressive episode in the past year who received treatment for depression in the past year:
| Race/Ethnicity | 2008 | 2009 | 2010 | 2011 | 2012 |
|---|---|---|---|---|---|
| Total | 37.7 | 34.7 | 37.8 | 38.4 | 37.0 |
| White | 43.1 | 37.6 | 41.1 | 41.4 | 40.7 |
| Black | 32.6 | 25.4 | 23.0 | 41.0 | 33.5 |
| Hispanic | 30.3 | 33.1 | 38.4 | 29.4 | 30.8 |
Source: Substance Abuse and Mental Health Services Administration, National Survey on Drug Use and Health, 2008-2012.
Denominator: Adolescents ages 12-17 with a major depressive episode in the past year.
Note: Major depressive episode is defined as a period of at least 2 weeks when a person experienced a depressed mood or loss of interest or pleasure in daily activities and had a majority of the symptoms of depression described in the fourth edition of the Diagnostic and Statistical Manual of Mental Disorders. Treatment for depression is defined as seeing or talking to a medical doctor or other professional or using prescription medication in the past year for depression.
- Importance:
- Outpatient mental health treatment and psychotropic medication use in children and adolescents increased in the United States between 1996-1998 and 2010-2012. Although youths with less severe or no impairment accounted for most of the absolute increase in service use, youths with more severe impairment had the greatest relative increase in use, yet less than half accessed services in 2010-2012 (Olfson, et al., 2015*).
- The United States Preventive Services Task Force (USPSTF) recommends screening of adolescents ages 12-18 years for major depressive disorder when systems are in place to ensure accurate diagnosis, psychotherapy (cognitive-behavioral or interpersonal), and followup (USPSTF, 2015**).
- Overall Rate: In 2012, 37% of adolescents with a major depressive episode received treatment for depression.
- Groups With Disparities: In 2012, Hispanic adolescents with depression were less likely than White adolescents to receive treatment.
* Olfson M1, Druss BG, Marcus SC. Trends in mental health care among children and adolescents. N Engl J Med 2015 May 21;372(21):2029-38.
** Depression in children and adolescents: screening. Released December 2009. Current as of July 2015. http://www.uspreventiveservicestaskforce.org/Page/Document/UpdateSummaryFinal/depression-in-children-and-adolescents-screening?ds=1&s=depression.
Slide 37
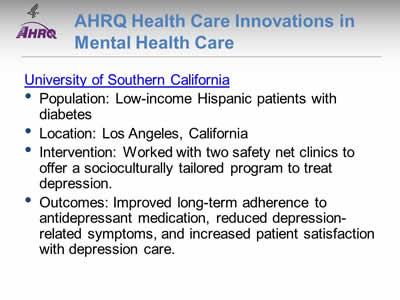
AHRQ Health Care Innovations in Mental Health Care
University of Southern California
- Population: Low-income Hispanic patients with diabetes.
- Location: Los Angeles, California.
- Intervention: Worked with two safety net clinics to offer a socioculturally tailored program to treat depression.
- Outcomes: Improved long-term adherence to antidepressant medication, reduced depression-related symptoms, and increased patient satisfaction with depression care.
Slide 38
National Healthcare Quality and Disparities Report Chartbook on Health Care for Hispanics
Part 2: Trends in Priorities of the Heckler Report
Infant Mortality and Maternity Care
Note:
- Thirty years ago, the Heckler Report found that:
- There is considerable variation within the Hispanic population, and while postneonatal mortality rates are elevated, the birth weight distributions are generally favorable.
- Only 58% of Mexican American mothers begin prenatal care in the first trimester, less than for Blacks or Whites.
- The birth weight and hence infant mortality rates of U.S.-born Puerto Ricans are less favorable than those for Mexican Americans.
- Data on birth weight show a favorable distribution for Cubans.
Slide 39
Maternity Care for Hispanics
Note:
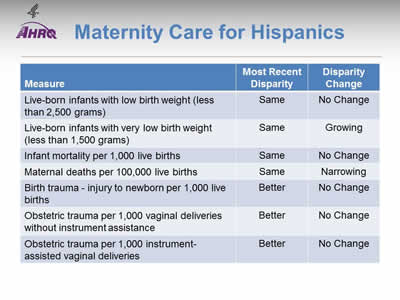
- Trends: Birth trauma and obstetric trauma were improving over time but other measures of maternity care were not changing.
- Groups With Disparities:
- Hispanics had lower rates of birth trauma and obstetric trauma than Whites and these disparities were not changing over time.
Slide 40
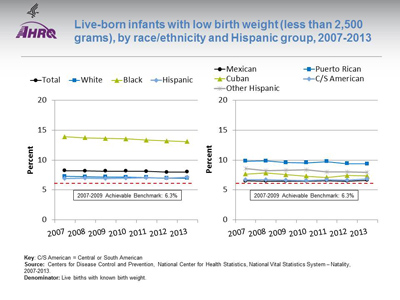
Live-born infants with low birth weight (less than 2,500 grams), by race/ethnicity and Hispanic group, 2007-2013
Image: Graphs show live-born infants with low birth weight:
Left Graph:
| Race/Ethnicity | 2007 | 2008 | 2009 | 2010 | 2011 | 2012 | 2013 |
|---|---|---|---|---|---|---|---|
| Total | 8.22 | 8.18 | 8.16 | 8.15 | 8.10 | 7.99 | 8.02 |
| White | 7.28 | 7.22 | 7.19 | 7.14 | 7.09 | 6.97 | 6.98 |
| Black | 13.90 | 13.71 | 13.61 | 13.53 | 13.33 | 13.18 | 13.08 |
| Hispanic | 6.93 | 6.96 | 6.94 | 6.97 | 7.02 | 6.97 | 7.09 |
2007-2009 Achievable Benchmark: 6.3%.
Right Graph:
| Hispanic Group | 2007 | 2008 | 2009 | 2010 | 2011 | 2012 | 2013 |
|---|---|---|---|---|---|---|---|
| Mexican | 6.50 | 6.49 | 6.47 | 6.49 | 6.55 | 6.48 | 6.62 |
| Puerto Rican | 9.83 | 9.86 | 9.59 | 9.55 | 9.75 | 9.40 | 9.38 |
| Cuban | 7.66 | 7.83 | 7.55 | 7.30 | 7.10 | 7.43 | 7.35 |
| C/S American | 6.71 | 6.70 | 6.64 | 6.55 | 6.70 | 6.64 | 6.85 |
| Other Hispanic | 8.61 | 8.24 | 8.28 | 8.38 | 8.02 | 8.00 | 7.99 |
2007-2009 Achievable Benchmark: 6.3%.
Key: C/S American = Central or South American
Source: Centers for Disease Control and Prevention, National Center for Health Statistics, National Vital Statistics System—Natality, 2007-2013.
Denominator: Live births with known birth weight.
Note:
- Importance: Low birth weight can put infants at risk of various complications and death. Adequate prenatal care can help ensure that babies are born full term and at a healthy weight.
- Trends: From 2007 to 2013, the percentage of live-born infants with low birth weight improved among Blacks but did not change overall or for Whites or Hispanics.
- Groups With Disparities:
- In all years, Black infants were more likely than White infants to be low birth weight.
- In all years, Puerto Rican infants were more likely than White infants to be low birth weight.
- Achievable Benchmark:
- The 2007-2009 top 5 State achievable benchmark was 6.3%. The top 5 States that contributed to the achievable benchmark are Alaska, Maine, Oregon, South Dakota, and Washington.
- Except Black infants, no groups showed movement toward the benchmark.
Slide 41

Live-born infants with very low birth weight (less than 1,500 grams), by race/ethnicity and Hispanic group, 2007-2013
Image: Graphs show live-born infants with very low birth weight:
Left Graph:
| Race/Ethnicity | 2007 | 2008 | 2009 | 2010 | 2011 | 2012 | 2013 |
|---|---|---|---|---|---|---|---|
| Total | 1.49 | 1.46 | 1.45 | 1.45 | 1.44 | 1.42 | 1.41 |
| White | 1.19 | 1.18 | 1.16 | 1.16 | 1.14 | 1.13 | 1.11 |
| Black | 3.20 | 3.01 | 3.06 | 2.98 | 2.99 | 2.94 | 2.9 |
| Hispanic | 1.21 | 1.20 | 1.19 | 1.20 | 1.20 | 1.22 | 1.21 |
Right Graph:
| Hispanic Group | 2007 | 2008 | 2009 | 2010 | 2011 | 2012 | 2013 |
|---|---|---|---|---|---|---|---|
| Mexican | 1.13 | 1.11 | 1.08 | 1.09 | 1.08 | 1.13 | 1.13 |
| Puerto Rican | 1.89 | 1.93 | 1.88 | 1.82 | 1.75 | 1.77 | 1.65 |
| Cuban | 1.27 | 1.43 | 1.46 | 1.42 | 1.30 | 1.55 | 1.27 |
| C/S American | 1.15 | 1.13 | 1.12 | 1.09 | 1.24 | 1.13 | 1.15 |
| Other Hispanic | 1.44 | 1.34 | 1.40 | 1.46 | 1.39 | 1.38 | 1.37 |
Key: C/S American = Central or South American
Source: Centers for Disease Control and Prevention, National Center for Health Statistics, National Vital Statistics System—Natality.
Denominator: Live births with known birth weight.
Note:
- Trends: From 2007 to 2013, the percentage of live-born infants with very low birth weight improved overall and among Whites and Blacks but did not change among Hispanics. This led to a widening of the Hispanic-White difference although it is still below our threshold for identifying statistically significant disparities.
- Groups With Disparities:
- In all years, Black infants were more likely than White infants to have very low birth weight.
- In all years, Puerto Rican infants were more likely than White infants to have very low birth weight.
Slide 42
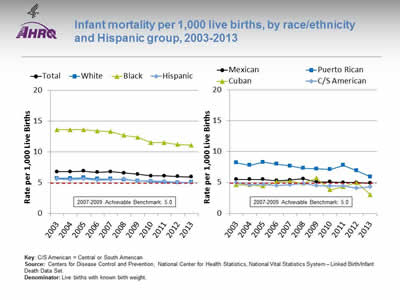
Infant mortality per 1,000 live births, by race/ethnicity and Hispanic group, 2003-2013
Image: Graphs show infant mortality per 1,000 live births:
Left Graph:
| Race/Ethnicity | 2003 | 2004 | 2005 | 2006 | 2007 | 2008 | 2009 | 2010 | 2011 | 2012 | 2013 |
|---|---|---|---|---|---|---|---|---|---|---|---|
| Total | 6.8 | 6.8 | 6.9 | 6.7 | 6.8 | 6.6 | 6.4 | 6.1 | 6.1 | 6.0 | 5.96 |
| White | 5.7 | 5.7 | 5.8 | 5.6 | 5.6 | 5.5 | 5.3 | 5.2 | 5.1 | 5.0 | 5.06 |
| Black | 13.6 | 13.6 | 13.6 | 13.4 | 13.3 | 12.7 | 12.4 | 11.5 | 11.5 | 11.2 | 11.11 |
| Hispanic | 5.6 | 5.5 | 5.6 | 5.4 | 5.5 | 5.6 | 5.3 | 5.3 | 5.2 | 5.1 | 5 |
2007-2009 Achievable Benchmark: 5.0.
Right Graph:
| Hispanic Group | 2003 | 2004 | 2005 | 2006 | 2007 | 2008 | 2009 | 2010 | 2011 | 2012 | 2013 |
|---|---|---|---|---|---|---|---|---|---|---|---|
| Mexican | 5.5 | 5.5 | 5.5 | 5.3 | 5.4 | 5.6 | 5.1 | 5.1 | 5.0 | 5.0 | 4.9 |
| Puerto Rican | 8.2 | 7.8 | 8.3 | 8.0 | 7.7 | 7.3 | 7.2 | 7.1 | 7.8 | 6.9 | 5.93 |
| Cuban | 4.6 | 4.6 | 4.4 | 5.1 | 5.2 | 4.9 | 5.7 | 3.8 | 4.3 | 5.0 | 3.02 |
| C/S American | 5.0 | 4.6 | 4.7 | 4.5 | 4.6 | 4.8 | 4.5 | 4.4 | 4.4 | 4.1 | 4.3 |
2007-2009 Achievable Benchmark: 5.0.
Key: C/S American = Central or South American
Source: Centers for Disease Control and Prevention, National Center for Health Statistics, National Vital Statistics System—Linked Birth/Infant Death Data Set.
Denominator: Live births with known birth weight.
Note:
- Trends: From 2003 to 2013, the rate of infant mortality among live births improved overall and among Whites and Blacks but changes among Hispanics were not statistically significant.
- Groups With Disparities:
- In all years, mortality was higher among Black infants than White infants.
- In all years, mortality was higher among Puerto Rican infants than White infants.
- Achievable Benchmark:
- The 2007-2009 top 5 State achievable benchmark was 5 per 1,000 live births. The top 5 States that contributed to the achievable benchmark are California, Massachusetts, New Hampshire, Utah, and Washington.
- Hispanics, including Mexicans, Cubans, and Central and South Americans, have achieved the benchmark. Whites and Puerto Ricans are close to the benchmark. Blacks are farthest from the benchmark.
Slide 43
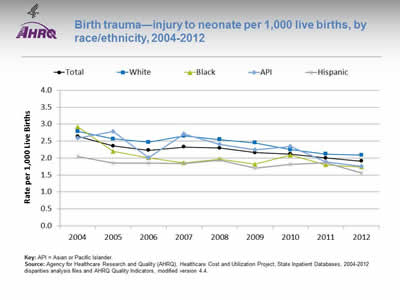
Birth trauma—injury to neonate per 1,000 live births, by race/ethnicity, 2004-2012
Image: Graph shows birth trauma—injury to neonate per 1,000 live births:
| Year | Total | White | Black | API | Hispanic |
|---|---|---|---|---|---|
| 2004 | 2.6 | 2.8 | 2.9 | 2.6 | 2.1 |
| 2005 | 2.4 | 2.6 | 2.2 | 2.8 | 1.9 |
| 2006 | 2.2 | 2.5 | 2.0 | 2.0 | 1.9 |
| 2007 | 2.3 | 2.7 | 1.9 | 2.7 | 1.8 |
| 2008 | 2.3 | 2.6 | 2.0 | 2.4 | 1.9 |
| 2009 | 2.2 | 2.5 | 1.8 | 2.2 | 1.7 |
| 2010 | 2.1 | 2.3 | 2.1 | 2.3 | 1.8 |
| 2011 | 2.0 | 2.1 | 1.8 | 1.9 | 1.9 |
| 2012 | 1.9 | 2.1 | 1.7 | 1.8 | 1.6 |
Key: API = Asian or Pacific Islander.
Source: Agency for Healthcare Research and Quality (AHRQ), Healthcare Cost and Utilization Project, State Inpatient Databases, 2004-2012 disparities analysis files and AHRQ Quality Indicators, modified version 4.4.
Note:
- Trends:
- Birth trauma-neonatal injury rates fell from 2.6 per 1,000 live births in 2004 to 1.9 per 1,000 live births in 2012.
- Between 2004 and 2012, birth trauma-neonatal injury rates fell for all racial/ethnic groups.
- Groups With Disparities:
- In 2012, White neonates experienced an injury rate of 2.1 per 1,000 live births compared with 1.6 per 1,000 live births for Hispanic neonates.
- There were no other statistically significant differences between groups.


