Chartbook on Hispanic Health Care: Slide Presentation—Part 4
2014 National Healthcare Quality and Disparities Report
Health Care of Residents of the U.S.-Mexico Border
Slide 1
National Healthcare Quality and Disparities Report Chartbook on Health Care for Hispanics
Part 4: Health Care of Residents of the U.S.-Mexico Border
Note:
- This part of the chartbook focuses on health care of residents on the U.S. side of the U.S.-Mexico border. In future, we will seek to add information about the Mexico side of the border.
Slide 2
U.S.-Mexico Border Region
- U.S.-Mexico border region exists within:
- 100 km (62.2 miles) of the international boundary.
- U.S. States of California, Arizona, New Mexico, and Texas.
- Mexican States of Baja California, Sonora, Chihuahua, Coahuila, Nuevo Leon, and Tamaulipas.
- U.S.-Mexico Border Health Commission focuses on border health and creates a venue to address public health along the border.
Note:
Slide 3
U.S.-Mexico Border Region
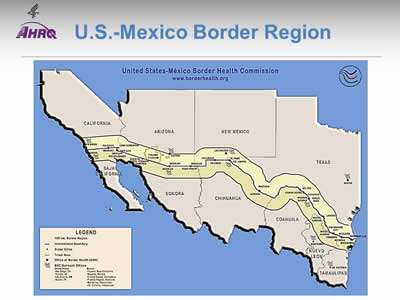
Image: Map shows the United States and Mexican border states: California, Arizona, New Mexico, and Texas; Baja California, Sonora, Chihuahua, Coahuila, Neuvo Leon, and Tamaulipas. The 100 km border region is highlighted.
Slide 4
Border Health Priorities
- Border health priorities include:
- Access to health care.
- Cancer.
- Environmental health.
- HIV/AIDS.
- Immunizations and infectious diseases.
- Injury prevention.
- Maternal and child health.
- Mental health.
- Oral health.
- Respiratory diseases.
Note:
Slide 5
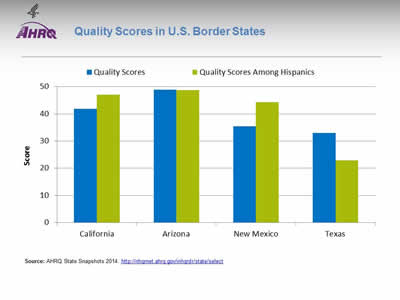
Quality Scores in U.S. Border States
Image: Chart shows Quality Scores in U.S. Border States: California Quality Scores - 41.8; Quality Scores Among Hispanics - 47.1. Arizona Quality Scores - 48.9; Quality Scores Among Hispanics - 48.8. New Mexico Quality Scores - 35.5; Quality Scores Among Hispanics - 44.3. Texas Quality Scores - 33; Quality Scores Among Hispanics - 22.9.
Source: AHRQ State Snapshots 2014. http://nhqrnet.ahrq.gov/inhqrdr/state/select.
Note:
- Methods:
- An overall quality score is computed for each State based on the number of quality measures that are above, at, or below the average across all States; the median score is typically around 50. A quality score for Hispanics is computed in a similar manner but only using data for Hispanics. Go to State Snapshots at http://nhqrnet.ahrq.gov/inhqrdr/state/select for more detailed methods.
- Geographic Variation:
- There was significant variation in overall quality among U.S. States on the border. Arizona and California are close to the median while New Mexico and Texas are far from the median, ranking 48 and 49, respectively, out of the 50 States and the District of Columbia.
- In terms of quality of care received by Hispanics, there was also significant variation among U.S. States on the border. Arizona, California, and New Mexico are close to the median while Texas ranks last out of the 50 States and the District of Columbia.
- The State Snapshots tool (http://nhqrnet.ahrq.gov/inhqrdr/state/select), part of the QDR Web site, focuses on variation across States and helps State health leaders, researchers, and consumers understand the status of health care in individual States and the District of Columbia. It is based on more than 100 QDR measures for which State estimates are possible.
Slide 6
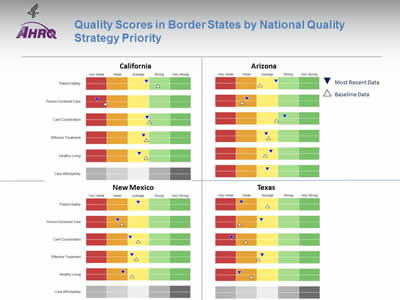
Quality Scores in Border States by National Quality Strategy Priority
Image: Screenshot from AHRQ State Snapshots site shows Quality Scores by National Quality Strategy Priority for California, Arizona, New Mexico, and Texas.
Source: AHRQ State Snapshots 2014. http://nhqrnet.ahrq.gov/inhqrdr/state/select.
- Geographic Variation:
- Border States vary in the quality of care delivered in different priority areas of the National Quality Strategy. An overall quality score is computed for each State based on the number of quality measures that are above, at, or below the average across all States; the median score is typically around 50 and is shown as the middle of the yellow band above.
- California, Arizona, and New Mexico are weak in person-centered care. New Mexico and Texas are weak in healthy living. Texas is also weak in patient safety and care coordination. Data are limited for assessing care affordability in most States.
- Arizona is strong in care coordination.
Slide 7
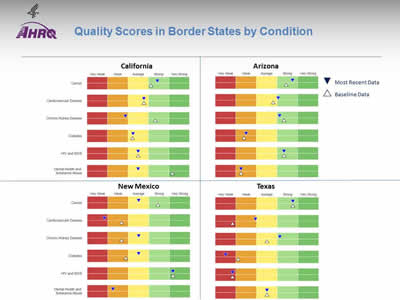
Quality Scores in Border States by Condition
Image: Screenshot from AHRQ State Snapshots site shows Quality Scores by Condition for California, Arizona, New Mexico, and Texas.
Source: AHRQ State Snapshots 2014. http://nhqrnet.ahrq.gov/inhqrdr/state/select.
- Geographic Variation:
- Border States vary in the quality of care delivered for different conditions. An overall quality score is computed for each State based on the number of quality measures that are above, at, or below the average across all States; the median score is typically around 50 and is shown as the middle of the yellow band above.
- California is weak in care for chronic kidney disease. Arizona and Texas are weak in care for diabetes. Arizona and New Mexico are weak in care for mental health and substance abuse. New Mexico and Texas are weak in care for cardiovascular disease. Texas is also weak in care for HIV and AIDS.
- California, Arizona, and Texas are strong in care for cancer. Arizona and New Mexico are strong in care for HIV and AIDS. Arizona and Texas are strong in care for chronic kidney disease. Arizona is also strong in care for cardiovascular disease.
Slide 8
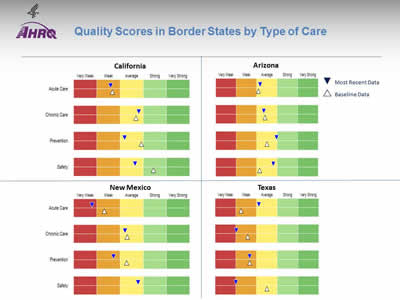
Quality Scores in Border States by Type of Care
Image: Screenshot from AHRQ State Snapshots site shows Quality Scores by Type of Care for California, Arizona, New Mexico, and Texas.
Source: AHRQ State Snapshots 2014. http://nhqrnet.ahrq.gov/inhqrdr/state/select.
- Geographic Variation:
- Border States vary in the quality of different types of care delivered. An overall quality score is computed for each State based on the number of quality measures that are above, at, or below the average across all States; the median score is typically around 50 and is shown as the middle of the yellow band above.
- California and New Mexico are weak in acute care. New Mexico and Texas are weak in prevention. Texas is also weak in chronic care and safety.
Slide 9
National Healthcare Quality and Disparities Report Chartbook on Health Care for Hispanics
Part 4: Health Care of Residents of the U.S.-Mexico Border
Hospital Care on the U.S.-Mexico Border
Note:
- While many of the data sources used in the QDR can provide State estimates, most cannot provide estimates at the substate level.
- In this section, we present findings from hospital data from U.S. states that can drill down to the county level. In future, we hope to identify and include data sources that can provide county estimates for care delivered in other settings.
- We also include links to some successful quality improvement interventions from the AHRQ Health Care Innovations Exchange (https://innovations.ahrq.gov/) that involved sites on the border.
Slide 10
Purpose
- Compare hospital services in counties along the U.S.-Mexico border to non-border U.S. counties in the four border States:
- AZ, CA, NM, TX.
- Focus on priority conditions identified by the U.S.-Mexico Border Commission.
- Report results by ethnicity.
Slide 11

Data Source
- Discharge counts:
- Healthcare Cost and Utilization Project:
- 2013 State Inpatient Databases for four States: Arizona, California, New Mexico, and Texas.
- Border counties within 60 miles of Mexico.
- Discharges grouped by the county of the hospital.
- Limited to community hospitals, excluding rehabilitation hospitals.
- Included all patients treated in those hospitals, including foreign and out-of-state patients.
- Healthcare Cost and Utilization Project:
- Population denominators:
- Residents of border and non-border counties.
- Nielsen demographic data.
Slide 12
Hospital Care on the U.S.-Mexico Border
Population Characteristics
Slide 13
Percentage of the Population, by Race/Ethnicity
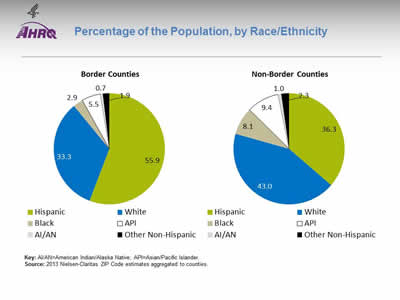
Image: Pie charts show Percentage of the Population, by Race/Ethnicity. Border Counties: Hispanic - 55.9, White - 33.3, Black - 2.9, API - 5.5, AI/AN - 0.7. Other Non-Hispanic - 1.9. Non-Border Counties: Hispanic - 36.3, White - 43.0, Black - 8.1, API - 9.4, AI/AN - 1.0, Other Non-Hispanic - 2.3.
Key: AI/AN=American Indian/Alaska Native; API=Asian/Pacific Islander.
Source: 2013 Nielsen-Claritas ZIP Code estimates aggregated to counties.
Note:
- In border counties, 56% of the population was Hispanic, compared with only 36% in non-border counties.
Slide 14
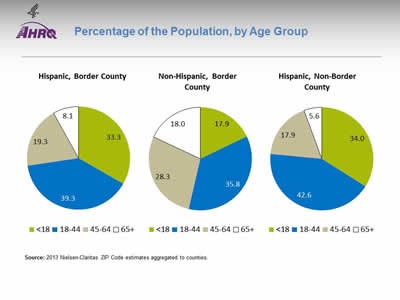
Percentage of the Population, by Age Group
Image: Pie charts show Percentage of the Population, by Age Group. Hispanic, Border County: Less than 18 - 33.3, 18-44 - 39.3, 45-64 - 19.3, 65 and over - 8.1. Non-Hispanic, Border County: Less than 18 - 17.9, 18-44 - 35.8, 45-64 - 28.3, 65 and over - 18.0. Hispanic, Non-Border County: Less than 18 - 34.0, 18-44 - 42.6, 45-64 - 17.9, 65 and over - 5.6.
Source: 2013 Nielsen-Claritas ZIP Code estimates aggregated to counties.
Note:
- The age distribution of Hispanics in border and non-border counties was similar. However, non- Hispanics in border counties were older—nearly half were age 45 and over.
Slide 15
Hospital Care on the U.S.-Mexico Border
Characteristics of Inpatient Hospital Stays
Slide 16
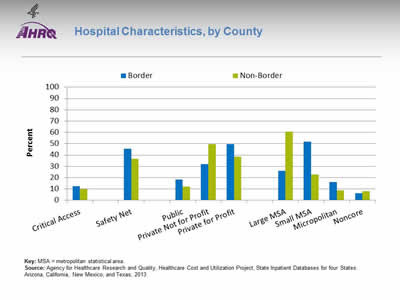
Hospital Characteristics, by County
Image: Chart shows Hospital Characteristics. Critical Access: Border - 12.3; Non-Border - 10.0. Safety Net: Border - 45.7; Non-Border - 36.8. Public: Border - 18.5; Non-Border - 12.0. Private Not for Profit: Border - 32.1; Non-Border - 49.6. Private for Profit: Border - 49.4; Non-Border - 38.4. Large MSA: Border - 25.9; Non-Border - 60.5. Small MSA: Border - 51.9; Non-Border - 22.8. Micropolitan: Border - 16.0; Non-Border - 8.9. Noncore: Border - 6.2; Non-Border - 7.9.
Key: MSA = metropolitan statistical area.
Source: Agency for Healthcare Research and Quality, Healthcare Cost and Utilization Project, State Inpatient Databases for four States: Arizona, California, New Mexico, and Texas; 2013.
Note:
- This analysis included 81 hospitals located in border counties and 789 hospitals located in the non- border counties of Arizona, California, New Mexico, and Texas.
- Compared with non-border hospitals, border hospitals were more likely to be:
- Safety net facilities.
- Public or private for profit.
- Located in small metropolitan or micropolitan areas.
Slide 17
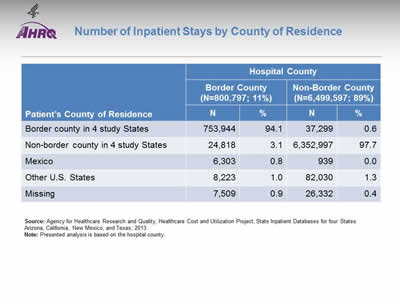
Number of Inpatient Stays by County of Residence
| Patient's County of Residence | Hospital County | |||
|---|---|---|---|---|
| Border County (N=800,797; 11%) |
Non-Border County (N=6,499,597; 89%) |
|||
| N | % | N | % | |
| Border county in 4 study States | 753,944 | 94.1 | 37,299 | 0.6 |
| Non-border county in 4 study States | 24,818 | 3.1 | 6,352,997 | 97.7 |
| Mexico | 6,303 | 0.8 | 939 | 0.0 |
| Other U.S. States | 8,223 | 1.0 | 82,030 | 1.3 |
| Missing | 7,509 | 0.9 | 26,332 | 0.4 |
Source: Agency for Healthcare Research and Quality, Healthcare Cost and Utilization Project, State Inpatient Databases for four States: Arizona, California, New Mexico, and Texas; 2013.
Note: Presented analysis is based on the hospital county.
Slide 18
Percentage of Inpatient Stays, by Age Group
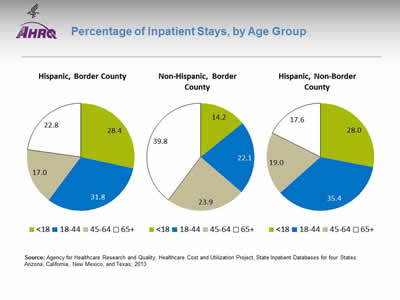
Image: Pie charts show percentage of Inpatient Stays, by Age Group. Hispanic, Border County: Less than 18 - 28.4, 18-44 - 31.8, 45-64 - 17.0, 65 and over - 22.8. Non-Hispanic, Border County: Less than 18 - 14.2, 18-44 - 22.1, 45-64 - 23.9, 65 and over - 39.8. Hispanic, Non-Border County: Less than 18 - 28.0, 18-44 - 35.4, 45-64 - 19.0, 65 and over - 17.6.
Source: Agency for Healthcare Research and Quality, Healthcare Cost and Utilization Project, State Inpatient Databases for four States: Arizona, California, New Mexico, and Texas; 2013.
Note:
- The age distribution of Hispanic inpatient stays in border and non-border counties was similar. However, non-Hispanics with an inpatient stay in border counties were older—64% were age 45 and over.
Slide 19
Percentage of Inpatient Stays, by Service Line
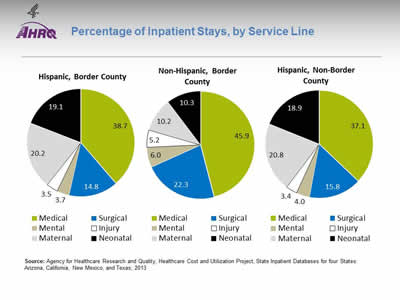
Image: Pie charts show Percentage of Inpatient Stays, by Service Line. Hispanic, Border County: Medical - 38.7, Surgical - 14.8, Mental - 3.7, Injury - 3.5, Maternal - 20.2, Neonatal - 19.1. Non-Hispanic, Border County: Medical - 45.9, Surgical - 22.3, Mental - 6.0, Injury - 5.2, Maternal - 10.2, Neonatal - 10.3. Hispanic, Non- Border County: Medical - 37.1, Surgical - 15.8, Mental - 4.0, Injury - 3.4, Maternal - 20.8, Neonatal - 18.9.
Source: Agency for Healthcare Research and Quality, Healthcare Cost and Utilization Project, State Inpatient Databases for four States: Arizona, California, New Mexico, and Texas; 2013.
Note:
- In both border and non-border counties, 40% of Hispanic inpatient stays were maternal/neonatal.
- In comparison, only 20% of non-Hispanic stays in border counties were maternal/neonatal.
Slide 20
Priority Areas Identified by the U.S.-Mexico Border Commission
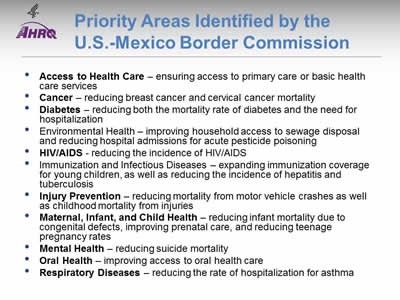
- Access to Health Care—ensuring access to primary care or basic health care services.
- Cancer—reducing breast cancer and cervical cancer mortality.
- Diabetes—reducing both the mortality rate of diabetes and the need for hosp.italization.
- Environmental Health—improving household access to sewage disposal and reducing hospital admissions for acute pesticide poisoning.
- HIV/AIDS—reducing the incidence of HIV/AIDS.
- Immunization and Infectious Diseases—expanding immunization coverage for young children, as well as reducing the incidence of hepatitis and tuberculosis.
- Injury Prevention—reducing mortality from motor vehicle crashes as well as childhood mortality from injuries.
- Maternal, Infant, and Child Health—reducing infant mortality due to congenital defects, improving prenatal care, and reducing teenage pregnancy rates.
- Mental Health—reducing suicide mortality.
- Oral Health—improving access to oral health care.
- Respiratory Diseases—reducing the rate of hospitalization for asthma.
Note:
Priority areas identified by Healthy Border 2010/2020. Those in bold are areas for which we provide data on subsequent slides.
Slide 21
Access to Health Care: Percentage of Inpatient Stays, by Expected Payer
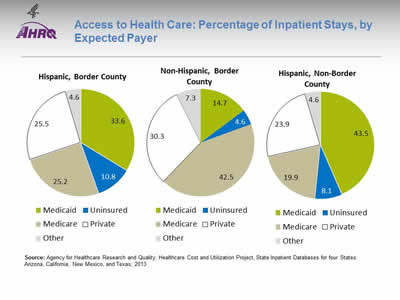
Image: Pie charts show Percentage of Inpatient Stays, by Expected Payer. Hispanic, Border County: Medicaid - 33.6; Uninsured - 10.8; Medicare - 25.2; Private - 25.5; Other - 4.6. Non-Hispanic, Border County: Medicaid - 14.7; Uninsured - 4.6; Medicare - 42.5; Private - 30.3; Other - 7.3. Hispanic, Non-Border County: Medicaid - 43.5; Uninsured - 8.1; Medicare - 19.9; Private - 23.9; Other - 4.6.
Source: Agency for Healthcare Research and Quality, Healthcare Cost and Utilization Project, State Inpatient Databases for four States: Arizona, California, New Mexico, and Texas; 2013.
- Access to health care varies by ethnicity and geographic location.
- Almost 11% of Hispanic inpatient stays in border counties were not covered by insurance, compared with:
- 4.6% of non-Hispanic stays in border counties.
- 8.1% of Hispanic stays in non-border counties.
- One-third of Hispanic inpatient stays in border counties were paid by Medicaid, compared with:
- Only 15% of non-Hispanic stays in border counties.
- About 44% of Hispanic stays in non-border counties.
Slide 22
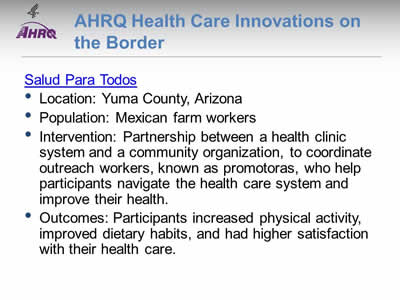
AHRQ Health Care Innovations on the Border
- Location: Yuma County, Arizona.
- Population: Mexican farm workers.
- Intervention: Partnership between a health clinic system and a community organization, to coordinate outreach workers, known as promotoras, who help participants navigate the health care system and improve their health.
- Outcomes: Participants increased physical activity, improved dietary habits, and had higher satisfaction with their health care.
Slide 23
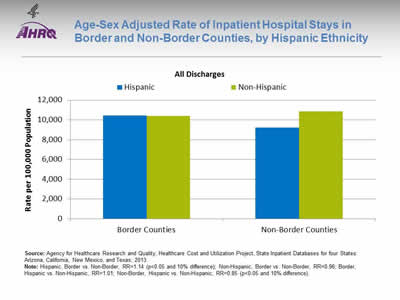
Age-Sex Adjusted Rate of Inpatient Hospital Stays in Border and Non-Border Counties, by Hispanic Ethnicity
Image: Bar chart shows rates per 100,000 population for All Discharges. Border Counties: Hispanic - 10,459; Non-Hispanic - 10,381. Non-Border Counties: Hispanic - 9,209; Non-Hispanic - 10,863.
Source: Agency for Healthcare Research and Quality, Healthcare Cost and Utilization Project, State Inpatient Databases for four States: Arizona, California, New Mexico, and Texas; 2013.
Note: Hispanic, Border vs. Non-Border, RR=1.14 (p<0.05 and 10% difference); Non-Hispanic, Border vs. Non-Border, RR=0.96; Border, Hispanic vs. Non-Hispanic, RR=1.01; Non-Border, Hispanic vs. Non-Hispanic, RR=0.85 (p<0.05 and 10% difference).
- Among Hispanics, the rate of stays was 1.14 times as high in border counties compared with non-border counties.
- In non-border counties, Hispanics had lower rates of stays than non-Hispanics.
Slide 24
Hospital Care on the U.S.-Mexico Border
Population-Based Rates of Inpatient Hospital Stays By Service Line
Slide 25
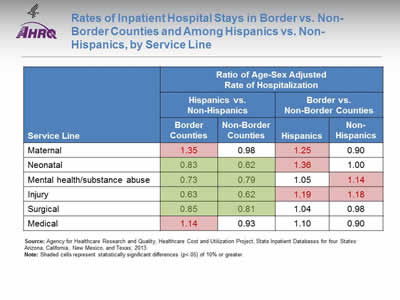
Rates of Inpatient Hospital Stays in Border vs. Non-Border Counties and Among Hispanics vs. Non- Hispanics, by Service Line
| Service Line | Ratio of Age-Sex Adjusted Rate of Hospitalization | |||
|---|---|---|---|---|
| Hispanics vs. Non-Hispanics | Border vs. Non-Border Counties | |||
| Border Counties | Non-Border Counties | Hispanics | Non-Hispanics | |
| Maternal | 1.35(a) | 0.98 | 1.25(a) | 0.90 |
| Neonatal | 0.83(b) | 0.62(b) | 1.36(a) | 1.00 |
| Mental health/substance abuse | 0.73(b) | 0.79(b) | 1.05 | 1.14(a) |
| Injury | 0.63(b) | 0.62(b) | 1.19(a) | 1.18(a) |
| Surgical | 0.85(b) | 0.81(b) | 1.04 | 0.98 |
| Medical | 1.14(a) | 0.93 | 1.10 | 0.90 |
Source: Agency for Healthcare Research and Quality, Healthcare Cost and Utilization Project, State Inpatient Databases for four States: Arizona, California, New Mexico, and Texas; 2013.
Note: Shaded cells (a = pink, b = green) represent statistically significant differences (p<.05) of 10% or greater.
- Hispanics generally had lower rates of hospitalization than non-Hispanics, except in the medical and maternal service lines, in both border and non-border counties.
- Compared with Hispanics in non-border counties, Hispanics in border counties had higher rates of hospitalization in the injury, maternal, and neonatal service lines.
- Service lines are shown in the order they are assigned–every discharge is assigned to a hospital service line hierarchically, based on the following order: maternal and neonatal, mental health, injury, surgical, and medical. Classification for maternal and neonatal, mental health, and injury are based on the International Classification of Diseases (ICD-9-CM) principal diagnosis codes or Clinical Classifications Software (CCS). Surgical and medical splits are based on the diagnosis-related groups (DRGs). The discharge is assigned to medical if the DRG indicates ungroupable.
Slide 26
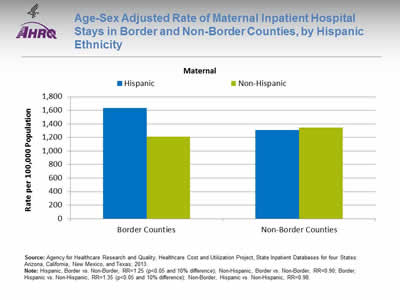
Age-Sex Adjusted Rate of Maternal Inpatient Hospital Stays in Border and Non-Border Counties, by Hispanic Ethnicity
Image: Bar chart shows rates per 100,000 population for Maternal Inpatient Hospital Stays. Border Counties: Hispanic - 1,637; Non-Hispanic - 1,211. Non-Border Counties: Hispanic - 1,311; Non-Hispanic - 1,343.
Source: Agency for Healthcare Research and Quality, Healthcare Cost and Utilization Project, State Inpatient Databases for four States: Arizona, California, New Mexico, and Texas; 2013.
Note: Hispanic, Border vs. Non-Border, RR=1.25 (p<0.05 and 10% difference); Non-Hispanic, Border vs. Non-Border, RR=0.90; Border, Hispanic vs. Non-Hispanic, RR=1.35 (p<0.05 and 10% difference); Non- Border, Hispanic vs. Non-Hispanic, RR=0.98.
- Hispanics in border counties had higher rates of maternal stays compared with both:
- Hispanics in non-border counties and
- Non-Hispanics in border counties.
Slide 27
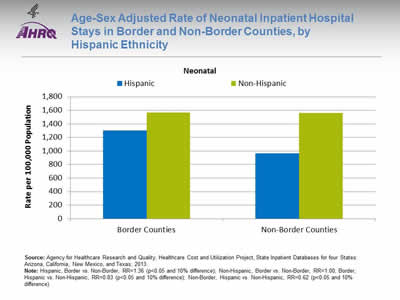
Age-Sex Adjusted Rate of Neonatal Inpatient Hospital Stays in Border and Non-Border Counties, by Hispanic Ethnicity
Image: Bar chart shows rates per 100,000 population for Neonatal Inpatient Hospital Stays. Border Counties: Hispanic - 1,304; Non-Hispanic - 1,565. Non-Border Counties: Hispanic - 963; Non-Hispanic - 1,560.
Source: Agency for Healthcare Research and Quality, Healthcare Cost and Utilization Project, State Inpatient Databases for four States: Arizona, California, New Mexico, and Texas; 2013.
Note: Hispanic, Border vs. Non-Border, RR=1.36 (p<0.05 and 10% difference); Non-Hispanic, Border vs. Non-Border, RR=1.00; Border, Hispanic vs. Non-Hispanic, RR=0.83 (p<0.05 and 10% difference); Non- Border, Hispanic vs. Non-Hispanic, RR=0.62 (p<0.05 and 10% difference).
- Among Hispanics, the rate of neonatal stays was higher in border counties than in non-border counties.
- Hispanics had lower rates of neonatal stays than non-Hispanics, both in border and non-border counties.
Slide 28
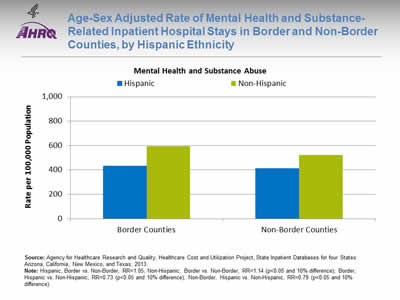
Age-Sex Adjusted Rate of Mental Health and Substance-Related Inpatient Hospital Stays in Border and Non-Border Counties, by Hispanic Ethnicity
Image: Bar chart shows rates per 100,000 population for Mental Health and Substance Abuse. Border Counties: Hispanic - 435; Non-Hispanic - 595. Non-Border Counties: Hispanic - 414; Non-Hispanic - 524.
Source: Agency for Healthcare Research and Quality, Healthcare Cost and Utilization Project, State Inpatient Databases for four States: Arizona, California, New Mexico, and Texas; 2013.
Note: Hispanic, Border vs. Non-Border, RR=1.05; Non-Hispanic, Border vs. Non-Border, RR=1.14 (p<0.05 and 10% difference); Border, Hispanic vs. Non-Hispanic, RR=0.73 (p<0.05 and 10% difference); Non- Border, Hispanic vs. Non-Hispanic, RR=0.79 (p<0.05 and 10% difference).
- Hispanics had lower rates of mental health and substance-related stays than non-Hispanics, both in border and non-border counties.
- Among non-Hispanics, those in border counties had higher rates of mental health and substance-related stays than non-Hispanics in non-border counties.
Slide 29
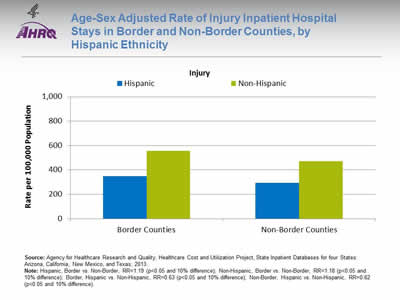
Age-Sex Adjusted Rate of Injury Inpatient Hospital Stays in Border and Non-Border Counties, by Hispanic Ethnicity
Image: Bar chart shows rates per 100,000 population for Injury. Border Counties: Hispanic - 348; Non-Hispanic - 566. Non-Border Counties: Hispanic - 293; Non-Hispanic - 471.
Source: Agency for Healthcare Research and Quality, Healthcare Cost and Utilization Project, State Inpatient Databases for four States: Arizona, California, New Mexico, and Texas; 2013.
Note: Hispanic, Border vs. Non-Border, RR=1.19 (p<0.05 and 10% difference); Non-Hispanic, Border vs. Non-Border, RR=1.18 (p<0.05 and 10% difference); Border, Hispanic vs. Non-Hispanic, RR=0.63 (p<0.05 and 10% difference); Non-Border, Hispanic vs. Non-Hispanic, RR=0.62 (p<.05 and 10% difference).
- Rates of injury stays were higher in border than non-border counties, both for Hispanics and non- Hispanics.
- Rates of injury stays were lower among Hispanics than non-Hispanics, both in border and non-border counties.
Slide 30
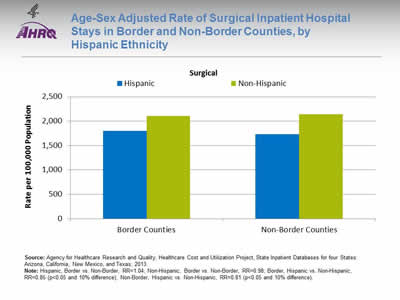
Age-Sex Adjusted Rate of Surgical Inpatient Hospital Stays in Border and Non-Border Counties, by Hispanic Ethnicity
Image: Bar chart shows rates per 100,000 population for Surgical Inpatient Hospital Stays. Border Counties: Hispanic - 1,801; Non-Hispanic - 2,109. Non-Border Counties: Hispanic - 1,730; Non-Hispanic - 2,144.
Source: Agency for Healthcare Research and Quality, Healthcare Cost and Utilization Project, State Inpatient Databases for four States: Arizona, California, New Mexico, and Texas; 2013.
Note: Hispanic, Border vs. Non-Border, RR=1.04; Non-Hispanic, Border vs. Non-Border, RR=0.98; Border, Hispanic vs. Non-Hispanic, RR=0.85 (p<0.05 and 10% difference); Non-Border, Hispanic vs. Non-Hispanic, RR=0.81 (p<0.05 and 10% difference).
- Hispanics had lower rates of surgical stays, both in border and non-border counties.
Slide 31
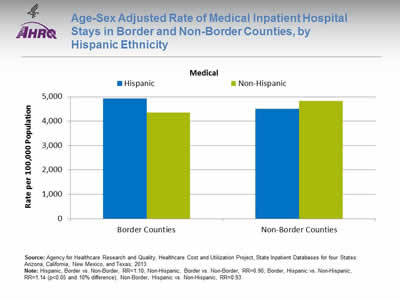
Age-Sex Adjusted Rate of Medical Inpatient Hospital Stays in Border and Non-Border Counties, by Hispanic Ethnicity
Image: Bar chart shows rates per 100,000 population for Medical Inpatient Hospital Stays. Border Counties: Hispanic - 4,933; Non-Hispanic - 4,345. Non-Border Counties: Hispanic - 4,498; Non-Hispanic - 4,822.
Source: Agency for Healthcare Research and Quality, Healthcare Cost and Utilization Project, State Inpatient Databases for four States: Arizona, California, New Mexico, and Texas; 2013.
Note: Hispanic, Border vs. Non-Border, RR=1.10; Non-Hispanic, Border vs. Non-Border, RR=0.90; Border, Hispanic vs. Non-Hispanic, RR=1.14 (p<0.05 and 10% difference); Non-Border, Hispanic vs. Non-Hispanic, RR=0.93.
- In border counties, Hispanics had higher rates of medical stays than non-Hispanics.
Slide 32
Hospital Care on the U.S.-Mexico Border
Population-Based Rates of Inpatient Hospital Stays for Select Conditions
Slide 33
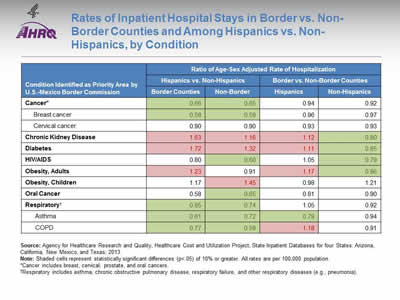
Rates of Inpatient Hospital Stays in Border vs. Non-Border Counties and Among Hispanics vs. Non- Hispanics, by Condition
| Condition Identified as Priority Area by U.S.-Mexico Border Commission | Ratio of Age-Sex Adjusted Rate of Hospitalization | |||
|---|---|---|---|---|
| Hispanics vs. Non-Hispanics | Border vs. Non-Border Counties | |||
| Border Counties | Non-Border | Hispanics | Non-Hispanics | |
| Cancer* | 0.66(b) | 0.65(b) | 0.94 | 0.92 |
| Breast cancer | 0.58(b) | 0.59(b) | 0.96 | 0.97 |
| Cervical cancer | 0.90 | 0.90 | 0.93 | 0.93 |
| Chronic Kidney Disease | 1.63(a) | 1.16(a) | 1.12(a) | 0.80(b) |
| Diabetes | 1.72(a) | 1.32(a) | 1.11(a) | 0.85(b) |
| HIV/AIDS | 0.80 | 0.60(b) | 1.05 | 0.79(b) |
| Obesity, Adults | 1.23(a) | 0.91 | 1.17(a) | 0.86(b) |
| Obesity, Children | 1.17 | 1.45(a) | 0.98 | 1.21 |
| Oral Cancer | 0.58 | 0.65(b) | 0.81 | 0.90 |
| Respiratory† | 0.85(b) | 0.74(b) | 1.05 | 0.92 |
| Asthma | 0.61(b) | 0.72(b) | 0.79(b) | 0.94 |
| COPD | 0.77(b) | 0.59(b) | 1.18(a) | 0.91 |
Source: Agency for Healthcare Research and Quality, Healthcare Cost and Utilization Project, State Inpatient Databases for four States: Arizona, California, New Mexico, and Texas; 2013.
Note: Shaded cells (a = pink, b = green) represent statistically significant differences (p<.05) of 10% or greater. All rates are per 100,000 population.
*Cancer includes breast, cervical, prostate, and oral cancers.
†Respiratory includes asthma, chronic obstructive pulmonary disease, respiratory failure, and other respiratory diseases (e.g., pneumonia).
Slide 34
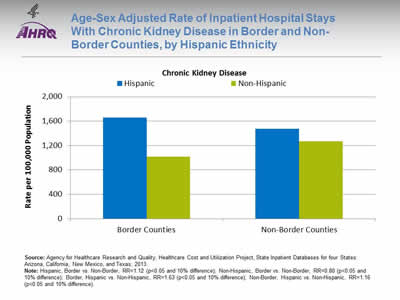
Age-Sex Adjusted Rate of Inpatient Hospital Stays With Chronic Kidney Disease in Border and Non-Border Counties, by Hispanic Ethnicity
Image: Bar chart shows rates per 100,000 population for Chronic Kidney Disease. Border Counties: Hispanic - 1,658; Non-Hispanic - 1,015. Non-Border Counties: Hispanic - 1,475; Non-Hispanic - 1,268.
Source: Agency for Healthcare Research and Quality, Healthcare Cost and Utilization Project, State Inpatient Databases for four States: Arizona, California, New Mexico, and Texas; 2013.
Note: Hispanic, Border vs. Non-Border, RR=1.12 (p<0.05 and 10% difference); Non-Hispanic, Border vs. Non-Border, RR=0.80 (p<0.05 and 10% difference); Border, Hispanic vs. Non-Hispanic, RR=1.63 (p<0.05 and 10% difference); Non-Border, Hispanic vs. Non-Hispanic, RR=1.16 (p<0.05 and 10% difference).
- For Hispanics in border counties, the rate of inpatient stays with chronic kidney disease was:
- 1.12 times as high as Hispanics in non-border counties.
- 1.63 times as high as non-Hispanics in border counties.
- Hispanics also had higher rates of chronic kidney disease in non-border counties, compared with non- Hispanics in non-border counties.
- Among non-Hispanics, those in border counties had lower rates of chronic kidney disease than those in non-border counties.
Slide 35
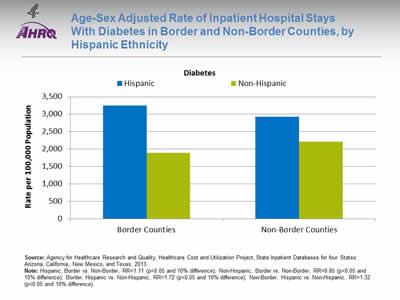
Age-Sex Adjusted Rate of Inpatient Hospital Stays With Diabetes in Border and Non-Border Counties, by Hispanic Ethnicity
Image: Bar chart shows rates per 100,000 population for Diabetes. Border Counties: Hispanic - 3,246; Non- Hispanic - 1,888. Non-Border Counties: Hispanic - 2,922; Non-Hispanic - 2,213.
Source: Agency for Healthcare Research and Quality, Healthcare Cost and Utilization Project, State Inpatient Databases for four States: Arizona, California, New Mexico, and Texas; 2013.
Note: Hispanic, Border vs. Non-Border, RR=1.11 (p<0.05 and 10% difference); Non-Hispanic, Border vs. Non-Border, RR=0.85 (p<0.05 and 10% difference); Border, Hispanic vs. Non-Hispanic, RR=1.72 (p<0.05 and 10% difference); Non-Border, Hispanic vs. Non-Hispanic, RR=1.32 (p<0.05 and 10% difference).
- For Hispanics in border counties, the rate of inpatient stays with diabetes was:
- 1.11 times as high as Hispanics in non-border counties.
- 1.72 times as high as non-Hispanics in border counties.
- Hispanics had higher rates of stays with diabetes than non-Hispanics, both in border and non-border counties.
- Among non-Hispanics, those in border counties had lower rates of stays with diabetes than those in non-border counties.
Slide 36
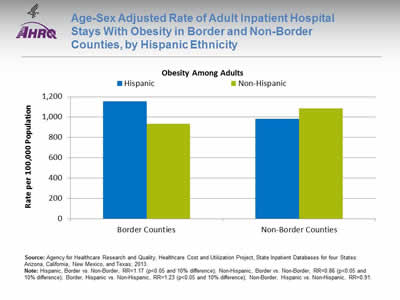
Age-Sex Adjusted Rate of Adult Inpatient Hospital Stays With Obesity in Border and Non-Border Counties, by Hispanic Ethnicity
Image: Bar chart shows rates per 100,000 population for Obesity Among Adults. Border Counties: Hispanic - 1,153; Non-Hispanic - 934. Non-Border Counties: Hispanic - 983; Non-Hispanic - 1,085.
Source: Agency for Healthcare Research and Quality, Healthcare Cost and Utilization Project, State Inpatient Databases for four States: Arizona, California, New Mexico, and Texas; 2013.
Note: Hispanic, Border vs. Non-Border, RR=1.17 (p<0.05 and 10% difference); Non-Hispanic, Border vs. Non-Border, RR=0.86 (p<0.05 and 10% difference); Border, Hispanic vs. Non-Hispanic, RR=1.23 (p<0.05 and 10% difference); Non-Border, Hispanic vs. Non-Hispanic, RR=0.91.
- For Hispanics in border counties, the rate of inpatient stays with adult obesity was:
- 1.17 times as high as Hispanics in non-border counties.
- 1.23 times as high as non-Hispanics in border counties.
- Among non-Hispanics, those in border counties had lower rates of adult obesity than those in non- border counties.
Slide 37
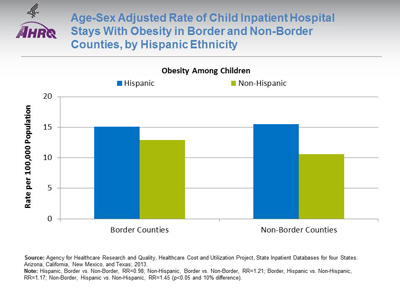
Age-Sex Adjusted Rate of Child Inpatient Hospital Stays With Obesity in Border and Non-Border Counties, by Hispanic Ethnicity
Image: Bar chart shows rates per 100,000 population for Obesity Among Children. Border Counties: Hispanic - 15.1; Non-Hispanic - 12.9. Non-Border Counties: Hispanic - 15.5; Non-Hispanic - 10.6.
Source: Agency for Healthcare Research and Quality, Healthcare Cost and Utilization Project, State Inpatient Databases for four States: Arizona, California, New Mexico, and Texas; 2013.
Note: Hispanic, Border vs. Non-Border, RR=0.98; Non-Hispanic, Border vs. Non-Border, RR=1.21; Border, Hispanic vs. Non-Hispanic, RR=1.17; Non-Border, Hispanic vs. Non-Hispanic, RR=1.45 (p<0.05 and 10% difference).
- In non-border counties, Hispanics had higher rates of child obesity than non-Hispanics.
Slide 38
AHRQ Health Care Innovations on the Border
- Location: Laredo, Texas, and Ciudad Victoria, Tamaulipas.
- Population: Mexican-American and other at-risk youth.
- Intervention: Comprehensive and culturally competent school-based behavior modification program intended to prevent or delay the onset of type 2 diabetes.
- Outcomes: Reduced risk factors, including body mass index, percentage of children with waist circumference at or above the 90th percentile, fasting insulin levels, and prevalence of obesity.
Slide 39
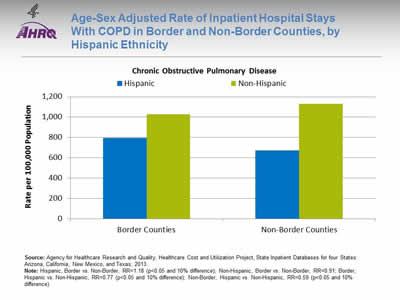
Age-Sex Adjusted Rate of Inpatient Hospital Stays With COPD in Border and Non-Border Counties, by Hispanic Ethnicity
Image: Bar chart shows rates per 100,000 population for Chronic Obstructive Pulmonary Disease. Border Counties: Hispanic - 793; Non-Hispanic - 1,027. Non-Border Counties: Hispanic - 672; Non-Hispanic - 1,132.
Source: Agency for Healthcare Research and Quality, Healthcare Cost and Utilization Project, State Inpatient Databases for four States: Arizona, California, New Mexico, and Texas; 2013.
Note: Hispanic, Border vs. Non-Border, RR=1.18 (p<0.05 and 10% difference); Non-Hispanic, Border vs. Non-Border, RR=0.91; Border, Hispanic vs. Non-Hispanic, RR=0.77 (p<0.05 and 10% difference); Non- Border, Hispanic vs. Non-Hispanic, RR=0.59 (p<0.05 and 10% difference).
- Among Hispanics, those in border counties had higher rates of COPD than those in non-border counties.
- Hispanics had lower rates of COPD than non-Hispanics, both in border and non-border counties.
Slide 40
AHRQ Health Care Innovations on the Border
El Rio Inner-City Asthma Intervention
- Location: Tucson, Arizona.
- Population: Low-income, inner-city Latino children with moderate or severe persistent asthma.
- Intervention: Comprehensive bilingual, bicultural program.
- Outcomes: Significantly reduced asthma-related emergency department visits, hospitalizations, missed school days, and sick days.
Slide 41
Hospital Care on the U.S.-Mexico Border
Complications of Inpatient Hospitals Stays with Diabetes
Slide 42
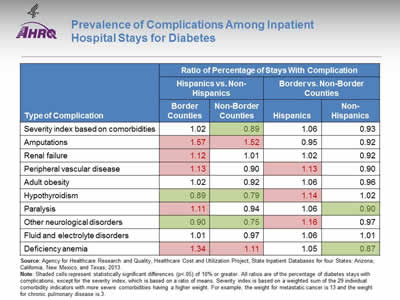
Prevalence of Complications Among Inpatient Hospital Stays for Diabetes
| Type of Complication | Ratio of Percentage of Stays With Complication | |||
|---|---|---|---|---|
| Hispanics vs. Non-Hispanics | Border vs. Non-Border Counties | |||
| Border Counties | Non-Border | Hispanics | Non-Hispanics | |
| Severity index based on comorbidities | 1.02 | 0.89(b) | 1.06 | 0.93 |
| Amputations | 1.57(a) | 1.52(a) | 0.95 | 0.92 |
| Renal failure | 1.12(a) | 1.01 | 1.02 | 0.92 |
| Peripheral vascular disease | 1.13(a) | 0.90 | 1.13(a) | 0.90 |
| Adult obesity | 1.02 | 0.92 | 1.06 | 0.96 |
| Hypothyroidism | 0.89(b) | 0.79(b) | 1.14(a) | 1.02 |
| Paralysis | 1.11(a) | 0.94 | 1.06 | 0.90(b) |
| Other neurologic disorders | 0.90(b) | 0.75(b) | 1.16(a) | 0.97 |
| Fluid and electrolyte disorders | 1.01 | 0.97 | 1.06 | 1.01 |
| Deficiency anemia | 1.34(a) | 1.11(a) | 1.05 | 0.87(b) |
Source: Agency for Healthcare Research and Quality, Healthcare Cost and Utilization Project, State Inpatient Databases for four States: Arizona, California, New Mexico, and Texas; 2013.
Note: Shaded cells (a = pink, b = green) represent statistically significant differences (p<.05) of 10% or greater. All ratios are of the percentage of diabetes stays with complications, except for the severity index, which is based on a ratio of means. Severity index is based on a weighted sum of the 29 individual comorbidity indicators with more severe comorbidities having a higher weight. For example, the weight for metastatic cancer is 13 and the weight for chronic pulmonary disease is 3.
- Compared with non-Hispanics, Hispanics generally had higher rates of complications associated with diabetes, especially in border counties.
- Among Hispanics, those in border counties had higher rates of complications associated with diabetes compared with non-border counties.
Slide 43
Amputations Among Inpatient Stays With Diabetes
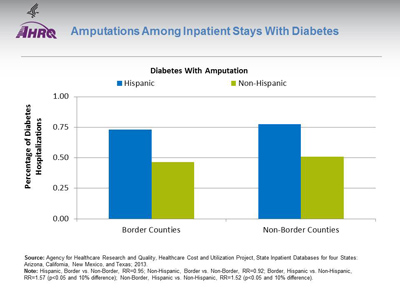
Image: Bar chart shows percentage of hospitalizations for diabetes with amputation. Border Counties: Hispanic - 0.73; Non-Hispanic - 0.47. Non-Border Counties: Hispanic - 0.78; Non-Hispanic - 0.51.
Source: Agency for Healthcare Research and Quality, Healthcare Cost and Utilization Project, State Inpatient Databases for four States: Arizona, California, New Mexico, and Texas; 2013.
Note: Hispanic, Border vs. Non-Border, RR=0.95; Non-Hispanic, Border vs. Non-Border, RR=0.92; Border, Hispanic vs. Non-Hispanic, RR=1.57 (p<0.05 and 10% difference); Non-Border, Hispanic vs. Non-Hispanic, RR=1.52 (p<0.05 and 10% difference).
- Hispanics with diabetes were more likely to have an amputation compared with non-Hispanics with diabetes, both in border and non-border counties.
Slide 44
Renal Failure Among Inpatient Stays With Diabetes
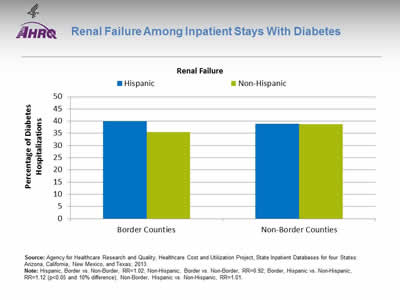
Image: Bar chart shows percentage of hospitalizations for diabetes with renal failure. Border Counties: Hispanic - 39.9; Non-Hispanic - 35.5. Non-Border Counties: Hispanic - 39.0; Non-Hispanic - 38.7.
Source: Agency for Healthcare Research and Quality, Healthcare Cost and Utilization Project, State Inpatient Databases for four States: Arizona, California, New Mexico, and Texas; 2013.
Note: Hispanic, Border vs. Non-Border, RR=1.02; Non-Hispanic, Border vs. Non-Border, RR=0.92; Border, Hispanic vs. Non-Hispanic, RR=1.12 (p<0.05 and 10% difference); Non-Border, Hispanic vs. Non-Hispanic, RR=1.01.
- A higher percentage of Hispanics in border counties with an inpatient stay for diabetes had renal failure (listed as any diagnosis), compared with non-Hispanics in border counties.
Slide 45
Peripheral Vascular Disease Among Inpatient Stays With Diabetes
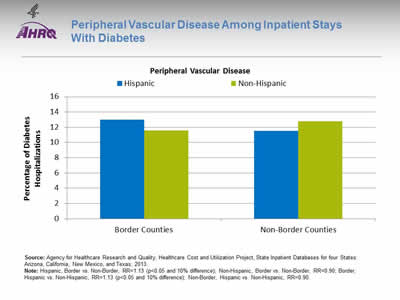
Image: Bar chart shows percentage of hospitalizations for diabetes with peripheral vascular disease. Border Counties: Hispanic - 13.0; Non-Hispanic - 11.6. Non-Border Counties: Hispanic - 11.5; Non-Hispanic - 12.8.
Source: Agency for Healthcare Research and Quality, Healthcare Cost and Utilization Project, State Inpatient Databases for four States: Arizona, California, New Mexico, and Texas; 2013.
Note: Hispanic, Border vs. Non-Border, RR=1.13 (p<0.05 and 10% difference); Non-Hispanic, Border vs. Non-Border, RR=0.90; Border, Hispanic vs. Non-Hispanic, RR=1.13 (p<0.05 and 10% difference); Non- Border, Hispanic vs. Non-Hispanic, RR=0.90.
- A higher percentage of Hispanics in border counties with an inpatient stay for diabetes had peripheral vascular disease, compared with:
- Non-Hispanics in border counties.
- Hispanics in non-border counties.
Slide 46
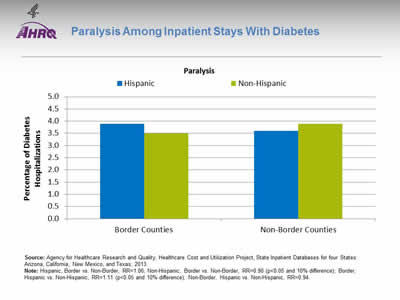
Paralysis Among Inpatient Stays With Diabetes
Image: Bar chart shows percentage of hospitalizations for diabetes with paralysis. Border Counties: Hispanic - 3.9; Non-Hispanic - 3.5. Non-Border Counties: Hispanic - 3.6; Non-Hispanic - 3.9.
Source: Agency for Healthcare Research and Quality, Healthcare Cost and Utilization Project, State Inpatient Databases for four States: Arizona, California, New Mexico, and Texas; 2013.
Note: Hispanic, Border vs. Non-Border, RR=1.06; Non-Hispanic, Border vs. Non-Border, RR=0.90 (p<0.05 and 10% difference); Border, Hispanic vs. Non-Hispanic, RR=1.11 (p<0.05 and 10% difference); Non- Border, Hispanic vs. Non-Hispanic, RR=0.94.
- Among non-Hispanics with diabetes, those in border counties had a lower prevalence of paralysis than those in non-border counties.
- In border counties, Hispanics with diabetes had a higher prevalence of paralysis than non-Hispanics with diabetes.
Slide 47
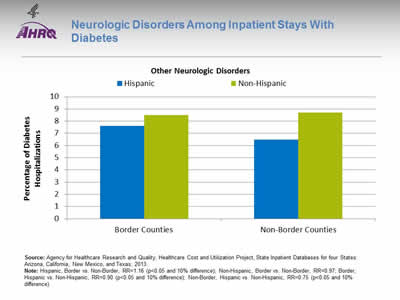
Neurologic Disorders Among Inpatient Stays With Diabetes
Image: Bar chart shows percentage of hospitalizations for diabetes with other neurologic disorders. Border Counties: Hispanic - 7.6; Non-Hispanic - 8.5. Non-Border Counties: Hispanic - 6.5; Non-Hispanic - 8.7.
Source: Agency for Healthcare Research and Quality, Healthcare Cost and Utilization Project, State Inpatient Databases for four States: Arizona, California, New Mexico, and Texas; 2013.
Note: Hispanic, Border vs. Non-Border, RR=1.16 (p<0.05 and 10% difference); Non-Hispanic, Border vs. Non-Border, RR=0.97; Border, Hispanic vs. Non-Hispanic, RR=0.90 (p<0.05 and 10% difference); Non- Border, Hispanic vs. Non-Hispanic, RR=0.75 (p<0.05 and 10% difference).
- A higher percentage of Hispanics in border counties with an inpatient stay for diabetes had neurologic disorders, compared with Hispanics in non-border counties.
- Hispanics with diabetes had lower rates of neurologic disorders than non-Hispanics with diabetes, both in border and non-border counties.
Slide 48
Hospital Care on the U.S.-Mexico Border
Complications Among Inpatient Hospital Stays For Mental Health or Substance Abuse
Slide 49
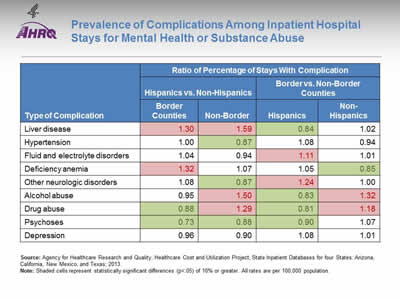
Prevalence of Complications Among Inpatient Hospital Stays for Mental Health or Substance Abuse
| Type of Complication | Ratio of Percentage of Stays With Complication | |||
|---|---|---|---|---|
| Hispanics vs. Non-Hispanics | Border vs. Non-Border Counties | |||
| Border Counties | Non-Border | Hispanics | Non-Hispanics | |
| Liver disease | 1.30(a) | 1.59(a) | 0.84(b) | 1.02 |
| Hypertension | 1.00 | 0.87(b) | 1.08 | 0.94 |
| Fluid and electrolyte disorders | 1.04 | 0.94 | 1.11(a) | 1.01 |
| Deficiency anemia | 1.32(a) | 1.07 | 1.05 | 0.85(b) |
| Other neurologic disorders | 1.08 | 0.87(b) | 1.24(a) | 1.00 |
| Alcohol abuse | 0.95 | 1.50(a) | 0.83(b) | 1.32(a) |
| Drug abuse | 0.88(b) | 1.29(a) | 0.81(b) | 1.18(a) |
| Psychoses | 0.73(b) | 0.88(b) | 0.90(b) | 1.07 |
| Depression | 0.96 | 0.90 | 1.08 | 1.01 |
Source: Agency for Healthcare Research and Quality, Healthcare Cost and Utilization Project, State Inpatient Databases for four States: Arizona, California, New Mexico, and Texas; 2013.
Note: Shaded cells (a = pink, b = green) represent statistically significant differences (p<.05) of 10% or greater. All rates are per 100,000 population.
- Compared with non-Hispanics, Hispanics were more likely to have a code for liver disease, both in border and non-border counties.
- Among Hispanics, compared with those in non-border counties, those in border counties were:
- Less likely to have a code for liver disease, alcohol and drug abuse, and psychoses.
- More likely to have fluid and electrolyte disorders and other neurologic disorders.
- Among non-Hispanics, those in border counties were more likely to have a code for drug or alcohol abuse than those in non-border counties.
Slide 50
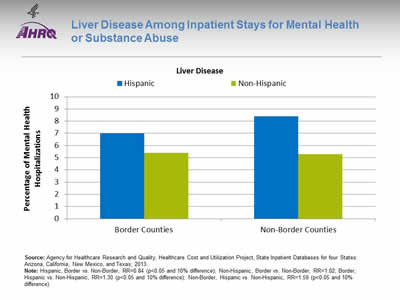
Liver Disease Among Inpatient Stays for Mental Health or Substance Abuse
Image: Bar chart shows percentage of mental health hospitalizations with liver disease. Border Counties: Hispanic - 7.0; Non-Hispanic - 5.4. Non-Border Counties: Hispanic - 8.4; Non-Hispanic - 5.3.
Source: Agency for Healthcare Research and Quality, Healthcare Cost and Utilization Project, State Inpatient Databases for four States: Arizona, California, New Mexico, and Texas; 2013.
Note: Hispanic, Border vs. Non-Border, RR=0.84 (p<0.05 and 10% difference); Non-Hispanic, Border vs. Non-Border, RR=1.02; Border, Hispanic vs. Non-Hispanic, RR=1.30 (p<0.05 and 10% difference); Non- Border, Hispanic vs. Non-Hispanic, RR=1.59 (p<0.05 and 10% difference).
- Compared with non-Hispanics, a higher percentage of Hispanics with an inpatient stay for mental health had liver disease, in both border and non-border counties.
- Among Hispanics, those in border counties were less likely to have liver disease than those in non- border counties.
Slide 51
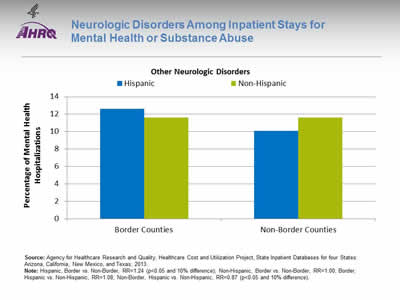
Neurologic Disorders Among Inpatient Stays for Mental Health or Substance Abuse
Image: Bar chart shows percentage of mental health hospitalizations with other neurologic disorders. Border Counties: Hispanic - 12.6; Non-Hispanic - 11.6. Non-Border Counties: Hispanic - 10.1; Non-Hispanic - 11.6.
Source: Agency for Healthcare Research and Quality, Healthcare Cost and Utilization Project, State Inpatient Databases for four States: Arizona, California, New Mexico, and Texas; 2013.
Note: Hispanic, Border vs. Non-Border, RR=1.24 (p<0.05 and 10% difference); Non-Hispanic, Border vs. Non-Border, RR=1.00; Border, Hispanic vs. Non-Hispanic, RR=1.08; Non-Border, Hispanic vs. Non-Hispanic, RR=0.87 (p<0.05 and 10% difference).
- A greater percentage of Hispanics in border counties with an inpatient stay for mental health had neurologic disorders, compared with Hispanics in non-border counties.
Slide 52
Hospital Care on the U.S.-Mexico Border
Border County Residents Treated at Non-Border Hospitals
Slide 53
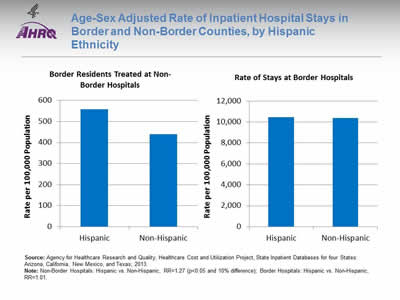
Age-Sex Adjusted Rate of Inpatient Hospital Stays in Border and Non-Border Counties, by Hispanic Ethnicity
Image: Bar charts show rate per 100,000 Population. Border Residents Treated at Non-Border Hospitals: Hispanic - 559, Non-Hispanic - 439. Rate of Stays at Border Hospitals: Hispanic - 10,459, Non-Hispanic - 10,381.
Source: Agency for Healthcare Research and Quality, Healthcare Cost and Utilization Project, State Inpatient Databases for four States: Arizona, California, New Mexico, and Texas; 2013.
Note: Non-Border Hospitals: Hispanic vs. Non-Hispanic, RR=1.27 (p<0.05 and 10% difference); Border Hospitals: Hispanic vs. Non-Hispanic, RR=1.01.
- By excluding border residents treated at non-border hospitals from the analyses above, we lost about 600 stays per 100,000 population.
- The rate of stays at border hospitals was similar for Hispanics and non-Hispanics. However, the rate of stays for border residents treated at non-border hospitals was 1.3 times as high for Hispanics as for non- Hispanics.
Slide 54
Percentage of Inpatient Stays, by Age Group
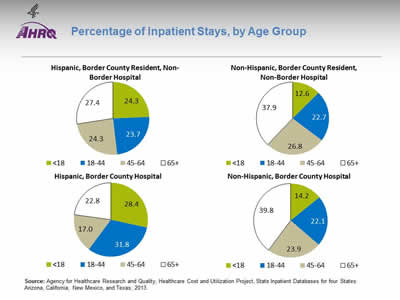
Image: Pie charts show percentage of Inpatient Stays, by Age Group. Hispanic, Border County Resident, Non- Border Hospital: Less than 18 - 24.3; 18-44 - 23.7; 45-64 - 24.3; 65 plus - 27.4. Hispanic, Border County Hospital: Less than 18 - 28.4; 18-44 - 31.8; 45-64 - 17.0; 65 plus - 22.8. Non-Hispanic, Border County Resident, Non-Border Hospital: Less than 18 - 12.6; 18-44 - 22.7; 45-64 - 26.8; 65 plus - 37.9. Non-Hispanic, Border County Hospital: Less than 18 - 14.2; 18-44 - 22.1; 45-64 - 23.9; 65 plus - 39.8.
Source: Agency for Healthcare Research and Quality, Healthcare Cost and Utilization Project, State Inpatient Databases for four States: Arizona, California, New Mexico, and Texas; 2013.
Note:
- The age distribution was generally similar for stays based on border county hospitals and border county residents treated at non-border hospitals.
Slide 55
Percentage of Inpatient Stays, by Service Line
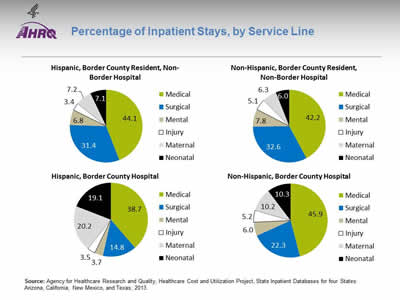
Image: Pie charts show percentage of Inpatient Stays, by Service Line. Hispanic, Border County Resident, Non- Border Hospital: Medical - 44.1; Surgical - 31.4; Mental - 6.8; Injury - 3.4; Maternal - 7.2; Neonatal - 7.1. Hispanic, Border County Hospital: Medical - 38.7; Surgical - 14.8; Mental - 3.7; Injury - 3.5; Maternal - 20.2; Neonatal - 19.1. Non-Hispanic, Border County Resident, Non-Border Hospital: Medical - 42.2; Surgical - 32.6; Mental - 7.8; Injury - 5.1; Maternal - 6.3; Neonatal - 6.0. Non-Hispanic, Border County Hospital: Medical - 45.9; Surgical - 22.3; Mental - 6.0; Injury - 5.2; Maternal - 10.2; Neonatal - 10.3.
Source: Agency for Healthcare Research and Quality, Healthcare Cost and Utilization Project, State Inpatient Databases for four States: Arizona, California, New Mexico, and Texas; 2013.
Note:
- Most discharges among border county residents treated at non-border hospitals were for surgical or medical reasons (75%) (versus, for instance, about 50% among Hispanics in border counties).
Slide 56
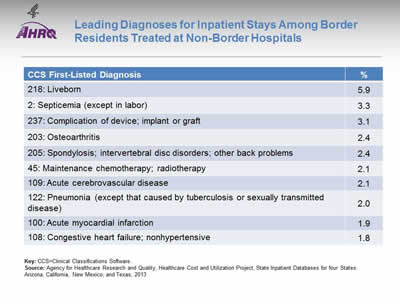
Leading Diagnoses for Inpatient Stays Among Border Residents Treated at Non-Border Hospitals
| Diagnosis | % |
|---|---|
| 218: Liveborn | 5.9 |
| 2: Septicemia (except in labor) | 3.3 |
| 237: Complication of device; implant or graft | 3.1 |
| 203: Osteoarthritis | 2.4 |
| 205: Spondylosis; intervertebral disc disorders; other back problems | 2.4 |
| 45: Maintenance chemotherapy; radiotherapy | 2.1 |
| 109: Acute cerebrovascular disease | 2.1 |
| 122: Pneumonia (except that caused by tuberculosis or sexually transmitted disease) | 2.0 |
| 100: Acute myocardial infarction | 1.9 |
| 108: Congestive heart failure; nonhypertensive | 1.8 |
Key: CCS=Clinical Classifications Software.
Source: Agency for Healthcare Research and Quality, Healthcare Cost and Utilization Project, State Inpatient Databases for four States: Arizona, California, New Mexico, and Texas; 2013
Slide 57
National Healthcare Quality and Disparities Report Chartbook on Health Care for Hispanics
Part 4: Health Care of Residents of the U.S.-Mexico Border
Summary
Slide 58
Key Findings
- Hospital data can be used to assess health care received by residents of the U.S.-Mexico border.
- Access to health care: Hispanics in border counties had the highest rates of uninsurance.
- Hispanics in border counties had higher hospitalization rates than Hispanics in non-border counties for:
- Diabetes.
- Injuries.
- Maternal and neonatal care.
- COPD.
- Chronic kidney disease.
- Obesity.
Slide 59
Key Findings
- When hospitalized for diabetes in border hospitals, Hispanics were more likely than non-Hispanics to experience:
- Amputation.
- Renal failure.
- Peripheral vascular disease.
- Paralysis.
- When hospitalized for mental health or substance abuse in border hospitals, Hispanics were more likely than non-Hispanics to have:
- Liver disease.
- Hispanics in border counties were more likely to be hospitalized in non-border hospitals than non- Hispanics.
Slide 60
National Healthcare Quality and Disparities Report Chartbook on Health Care for Hispanics
Part 4: Health Care of Residents of the U.S.-Mexico Border
Definitions
Slide 61
Conditions of Interest
- Cancers: Any Dx in CCS 24 (breast), 26 (cervix), 29 (prostate), or in range 140.x-149.x (oral).
- Cardiovascular: Any Dx in CCS 96-109.
- Diabetes: Any Dx in CCS 49-50:
- Lower-extremity amputation based on AHRQ PQI 16.
- HIV/AIDS: Any Dx in CCS 5.
- Maternal and Neonatal:
- Newborn: PDx in CCS 218 (normal) and CCS 219-224 (complicated):
- Neural tube defects: PDx in 756.17, 741.
- Delivery: PDx in CCS 196 (normal) and CCS 176-195 (complicated).
- Newborn: PDx in CCS 218 (normal) and CCS 219-224 (complicated):
- Mental Health and Substance Use: Any Dx in CCS 650-659, 662-670 (mental health) and CCS 660-661 (substance use).
- Environmental health: Any Dx in CCS 128 (asthma), 127 (COPD), 131 (respiratory failure), 122 and 132 (other respiratory including pneumonia).
- Injuries: Any external cause of injury code indicating motor vehicle accident and unintentional injuries (screen based on CDC classification for injuries).
- Obesity: Any Dx of 278.00, 278.01, and V778 by age (18+ adults; 0-17 children).
- Renal Failure: Any Dx in CCS 157 (acute) or CCS158 (chronic).
Key: Dx = diagnosis; CCS = Clinical Classifications Software; PQI = Prevention Quality Indicator; CDC = Centers for Disease Control and Prevention.
Slide 62
Service Line and Comorbidities
- Service line:
- Maternal: PDx in CCS 176-196.
- Neonatal: PDx in CCS 218-224.
- Mental Health: PDx in 650-670.
- Injury: PDX in range 800-990.4, 909.9, 910-994.9, and 995 (with some exclusions).
- Surgical: Surgical diagnosis-related group.
- Medical: All other discharges.
- Every discharge is assigned to one of the hospital service lines, based on the following hierarchical order: maternal and neonatal, mental health, injury, surgical, and medical.
- Comorbidities:
- AHRQ indicators for 29 comorbidities.
- Severity index is based on a weighted sum of the individual comorbidity indicators with more severe comorbidities having a higher weight. For example, the weight for metastatic cancer is 13 and the weight for chronic pulmonary disease is 3.


