Chartbook on Effective Treatment: Slide Presentation
National Healthcare Quality and Disparities Report
- Introduction
- Cardiovascular Disease.
- Cancer.
- Chronic Kidney Disease.
- Diabetes.
- HIV and AIDS.
- Mental Health and Substance Abuse.
- Musculoskeletal Diseases.
- Respiratory Diseases.
Slide 1
National Healthcare Quality and Disparities Report
Chartbook on Effective Treatment
September 2016
Slide 2
Organization of the Chartbook on Effective Treatment
- Part of a series related to the National Healthcare Quality and Disparities Report (QDR).
- Contents:
- Overview of the QDR.
- Overview of Effective Treatment, one of the priorities of the National Quality Strategy.
- Summary of trends and disparities in Effective Treatment from the QDR.
- Tracking of individual measures of Effective Treatment:
- Cardiovascular Disease.
- Cancer.
- Chronic Kidney Disease.
- Diabetes.
- HIV and AIDS.
- Mental Health and Substance Abuse.
- Musculoskeletal Diseases.
- Respiratory Diseases.
Slide 3
National Healthcare Quality and Disparities Report
- Annual report to Congress mandated in the Healthcare Research and Quality Act of 1999 (P.L. 106-129).
- Provides a comprehensive overview of:
- Quality of health care received by the general U.S. population.
- Disparities in care experienced by different racial, ethnic, and socioeconomic groups.
- Assesses the performance of our health system and identifies areas of strengths and weaknesses along three main axes:
- Access to health care.
- Quality of health care.
- Priorities of the National Quality Strategy.
Slide 4
National Healthcare Quality and Disparities Report
- Based on more than 250 measures of quality and disparities covering a broad array of health care services and settings.
- Data generally available through 2013.
- Produced with the help of an Interagency Work Group led by the Agency for Healthcare Research and Quality and submitted on behalf of the Secretary of Health and Human Services.
Note:
- Rates of uninsurance have been tracked through the first half of 2015.
Slide 5
Changes for 2015
- New National Healthcare Quality and Disparities Report (QDR):
- Integrates the National Healthcare Quality and Disparities Report and National Quality Strategy Update in a joint effort to address the progress made against the National Quality Strategy priorities at the 5-year anniversary of the Strategy.
- Describes the nation’s progress in improving health care access, quality, and disparities.
Notes:
- Beginning with the 2015 report, the National Healthcare Quality and Disparities Report and National Quality Strategy Update have been integrated into a single document that describes the Nation’s progress in improving health care access, quality, and disparities.
- The National Quality Strategy is backed by the National Healthcare Quality and Disparities Report data. Integration of these two efforts within the Agency for Healthcare Research and Quality supports the development of a more comprehensive report on the success of efforts to achieve better health and health care and reduce disparities.
Slide 6
Key Findings of the 2015 QDR
- The Nation has made progress in improving the health care system to achieve the three aims of better care, smarter spending, and healthier people, but there is still work to do, specifically to address disparities in care.
- Access to health care has improved dramatically, led by sustained reductions in the number of Americans without health insurance and increases in the number of Americans with a usual source of medical care.
- Quality of health care continues to improve, but wide variation exists across the National Quality Strategy priorities.
- Disparities related to race and socioeconomic status persist among measures of access and all National Quality Strategy priorities, but progress is being made in some areas.
Note:
- Disparities in quality of care and disparities in access to care typically follow the same pattern, although disparities in access tend to be more common than disparities in quality.
Slide 7
Chartbooks
- QDR supported by a series of related chartbooks that:
- Present information on individual measures.
- Are updated periodically.
- Are posted on the Web (http://www.ahrq.gov/research/findings/nhqrdr/chartbooks/index.html)
- Order and topics of chartbooks:
- Access to care.
- Priorities of the National Quality Strategy.
- Access and quality of care for different priority populations.
Slide 8
Chartbooks Organized Around Priorities of the National Quality Strategy
- Making care safer by reducing harm caused in the delivery of care.
- Ensuring that each person and family is engaged as partners in their care.
- Promoting effective communication and coordination of care.
- Promoting the most effective prevention and treatment practices for the leading causes of mortality, starting with cardiovascular disease.
- Working with communities to promote wide use of best practices to enable healthy living.
- Making quality care more affordable for individuals, families, employers, and governments by developing and spreading new health care delivery models.
Note:
- Effective Treatment is one of the six national priorities identified by the National Quality Strategy.
Slide 9
Priority 4: Promoting the most effective prevention and treatment practices for the leading causes of mortality, starting with cardiovascular disease
Long-Term Goals:
- Promote cardiovascular health through community interventions that result in improvement of social, economic, and environmental factors.
- Promote cardiovascular health through interventions that result in adoption of the most healthy lifestyle behaviors across the lifespan.
- Promote cardiovascular health through receipt of effective clinical preventive services across the lifespan in clinical and community settings.
Notes:
- Improving the quality of American health care demands an intense focus on preventing and treating cardiovascular disease. The lessons from this effort will feed into efforts addressing conditions such as HIV/AIDS and other chronic illnesses. Future initiatives will address a broad range of diseases and age ranges.
- This chartbook begins with measures of effective treatment of cardiovascular disease. This is followed by measures of effective treatment of seven other leading causes of death in the United States.
Slide 10
Chartbook on Effective Treatment
- This chartbook includes:
- Summary of trends across measures of Effective Treatment from the QDR.
- Figures illustrating select measures of Effective Treatment.
- Introduction and Methods contains information about methods used in the chartbook.
- A Data Query tool provides access to all data tables.
Slide 11
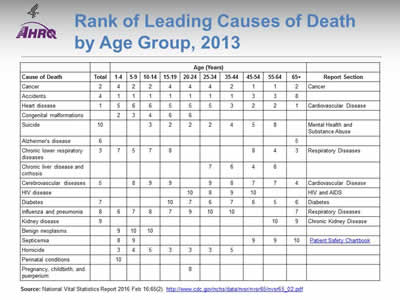
Rank of Leading Causes of Death by Age Group, 2013
| Cause of Death | Total | Age (Years) | Report Section | |||||||||
|---|---|---|---|---|---|---|---|---|---|---|---|---|
| 1-4 | 5-9 | 10-14 | 15-19 | 20-24 | 25-34 | 35-44 | 45-54 | 55-64 | 65+ | |||
| Cancer | 2 | 4 | 2 | 2 | 4 | 4 | 4 | 2 | 1 | 1 | 2 | Cancer |
| Accidents | 4 | 1 | 1 | 1 | 1 | 1 | 1 | 1 | 3 | 3 | 8 | |
| Heart disease | 1 | 5 | 6 | 6 | 5 | 5 | 5 | 3 | 2 | 2 | 1 | Cardiovascular Disease |
| Congenital malformations | 2 | 3 | 4 | 6 | 6 | |||||||
| Suicide | 10 | 3 | 2 | 2 | 2 | 4 | 5 | 8 | Mental Health and Substance Abuse | |||
| Alzheimer's disease | 6 | 5 | ||||||||||
| Chronic lower respiratory diseases | 3 | 7 | 5 | 7 | 8 | 8 | 4 | 3 | Respiratory Diseases | |||
| Chronic liver disease and cirrhosis | 7 | 6 | 4 | 6 | ||||||||
| Cerebrovascular diseases | 5 | 8 | 9 | 9 | 9 | 8 | 7 | 7 | 4 | Cardiovascular Disease | ||
| HIV disease | 10 | 8 | 9 | 10 | HIV and AIDS | |||||||
| Diabetes | 7 | 10 | 7 | 6 | 7 | 6 | 5 | 6 | Diabetes | |||
| Influenza and pneumonia | 8 | 6 | 7 | 8 | 7 | 9 | 10 | 10 | 7 | Respiratory Diseases | ||
| Kidney disease | 9 | 10 | 9 | Chronic Kidney Disease | ||||||||
| Benign neoplasms | 9 | 10 | 10 | |||||||||
| Septicemia | 8 | 9 | 9 | 9 | 10 | Patient Safety Chartbook | ||||||
| Homicide | 3 | 4 | 5 | 3 | 3 | 3 | 5 | |||||
| Perinatal conditions | 10 | |||||||||||
| Pregnancy, childbirth, and puerperium | 8 | |||||||||||
Source: National Vital Statistics Report 2016 Feb 16;65(2). http://www.cdc.gov/nchs/data/nvsr/nvsr65/nvsr65_02.pdf (4.9 MB).
Notes:
- Consistent with the NQS priority "Promoting the most effective prevention and treatment of the leading causes of mortality," identified in the National Strategy for Quality Improvement in Health Care, the conditions tracked in this chartbook include the leading causes of death in the United States for which significant health care quality measurement activity exists.
- Some leading causes of death, such as accidents and homicide, cannot be tracked in this chartbook because related performance standards and quality measures are not well defined.
- Other leading causes of death cannot be tracked in this chartbook because robust national data sources are lacking.
Slide 12
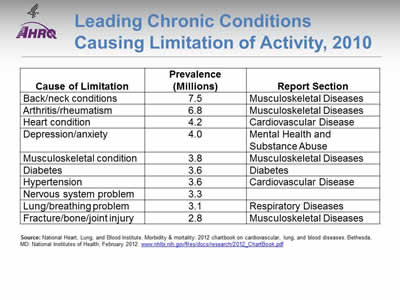
Leading Chronic Conditions Causing Limitation of Activity, 2010
| Cause of Limitation | Prevalence (Millions) |
Report Section |
|---|---|---|
| Back/neck conditions | 7.5 | Musculoskeletal Diseases |
| Arthritis/rheumatism | 6.8 | Musculoskeletal Diseases |
| Heart condition | 4.2 | Cardiovascular Disease |
| Depression/anxiety | 4.0 | Mental Health and Substance Abuse |
| Musculoskeletal condition | 3.8 | Musculoskeletal Diseases |
| Diabetes | 3.6 | Diabetes |
| Hypertension | 3.6 | Cardiovascular Disease |
| Nervous system problem | 3.3 | |
| Lung/breathing problem | 3.1 | Respiratory Diseases |
| Fracture/bone/joint injury | 2.8 | Musculoskeletal Diseases |
Source: National Heart, Lung, and Blood Institute. Morbidity & mortality: 2012 chartbook on cardiovascular, lung, and blood diseases. Bethesda, MD: National Institutes of Health; February 2012. www.nhlbi.nih.gov/files/docs/research/2012_ChartBook.pdf (3.8 MB).
Note:
- Musculoskeletal disease is not a leading cause of death, but it is included in this chartbook because it is a leading cause of functional limitation in the United States.
Slide 13
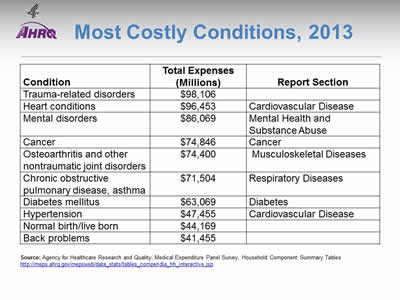
Most Costly Conditions, 2013
| Condition | Total Expenses (Millions) | Report Section |
|---|---|---|
| Trauma-related disorders | $98,106 | |
| Heart conditions | $96,453 | Cardiovascular Disease |
| Mental disorders | $86,069 | Mental Health and Substance Abuse |
| Cancer | $74,846 | Cancer |
| Osteoarthritis and other nontraumatic joint disorders | $74,400 | Musculoskeletal Diseases |
| Chronic obstructive pulmonary disease, asthma | $71,504 | Respiratory Diseases |
| Diabetes mellitus | $63,069 | Diabetes |
| Hypertension | $47,455 | Cardiovascular Disease |
| Normal birth/live born | $44,169 | |
| Back problems | $41,455 |
Source: Agency for Healthcare Research and Quality, Medical Expenditure Panel Survey, Household Component Summary Tables. http://meps.ahrq.gov/mepsweb/data_stats/tables_compendia_hh_interactive.jsp.
Note:
- The conditions tracked in this chartbook are also prominent on the list of conditions with the highest health care expenses.
Slide 14
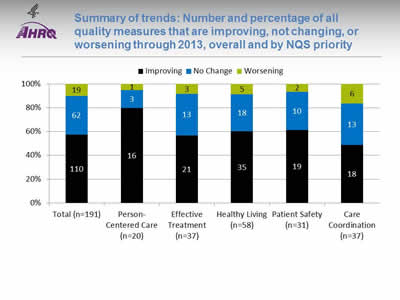
Summary of trends: Number and percentage of all quality measures that are improving, not changing, or worsening through 2013, overall and by NQS priority
Image: Bar graph shows number and percentage of all quality measures that are improving, not changing, or worsening by National Quality Strategy Priorities:
| NQS Priority | Improving | No Change | Worsening |
|---|---|---|---|
| Total (n=191) | 110 | 62 | 19 |
| Person-Centered Care (n=20) | 16 | 3 | 1 |
| Effective Treatment (n=37) | 21 | 13 | 3 |
| Healthy Living (n=58) | 35 | 18 | 5 |
| Patient Safety (n=31) | 19 | 10 | 2 |
| Care Coordination (n=37) | 18 | 13 | 6 |
Key: n = number of measures.
Notes: For the majority of measures, trend data are available from 2001 to 2013.
For each measure with at least four estimates over time, log-linear regression is used to calculate average annual percentage change and to assess statistical significance. Measures are aligned so that positive change indicates improved access to care.
- Improving = Rates of change are positive at 1% per year or greater and are statistically significant.
- No Change = Rate of change is less than 1% per year or is not statistically significant.
- Worsening = Rates of change are negative at -1% per year or greater and are statistically significant.
- About 60% of Effective Treatment measures were improving, similar to the total.
Slide 15
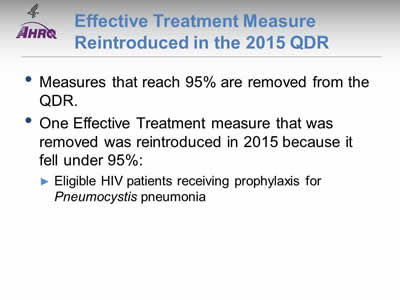
Effective Treatment Measure Reintroduced in the 2015 QDR
- Measures that reach 95% are removed from the QDR.
- One Effective Treatment measure that was removed was reintroduced in 2015 because it fell under 95%:
- Eligible HIV patients receiving prophylaxis for Pneumocystis pneumonia.
Slide 16
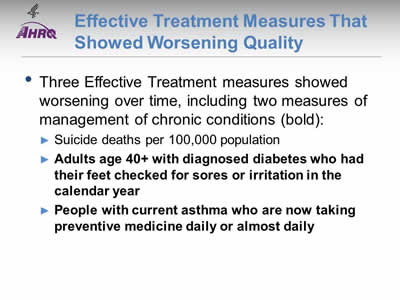
Effective Treatment Measures That Showed Worsening Quality
- Three Effective Treatment measures showed worsening over time, including two measures of management of chronic conditions (bold):
- Suicide deaths per 100,000 population.
- Adults age 40+ with diagnosed diabetes who had their feet checked for sores or irritation in the calendar year.
- People with current asthma who are now taking preventive medicine daily or almost daily.
Slide 17
Effective Treatment Measures With Elimination of Disparities
- One measure showed elimination of Black-White, Asian-White, and Hispanic-Non-Hispanic White disparities:
- Women under age 70 treated for breast cancer with breast-conserving surgery who received radiation therapy to the breast within 1 year of diagnosis.
- One measure showed elimination of a Hispanic-Non-Hispanic White disparity:
- Admissions for diabetes with short-term complications per 100,000 population, age 18 and over.
Slide 18
Effective Treatment Measures With Elimination of Disparities
- One measure showed elimination of income-related disparities:
- People with current asthma who are now taking preventive medicine daily or almost daily (either oral or inhaler).
- Two measures showed elimination of rural-urban disparities:
- Adults age 40 and over with diagnosed diabetes who had their feet checked for sores or irritation in the calendar year.
- Admissions for uncontrolled diabetes without complications per 100,000 population, age 18 and over.
Slide 19
Effective Treatment Measures With Widening of Disparities
- One measure showed widening of American Indian/Alaska Native-White disparities:
- New HIV cases per 100,000 population age 13 and over.
- Three measures showed widening of income-related disparities:
- Admissions for diabetes with short-term complications per 100,000 population, age 18 and over.
- Admissions for diabetes with long-term complications per 100,000 population, age 18 and over.
- Hospital admissions for lower extremity amputations per 1,000 population age 18 and over with diabetes.
Slide 20
Effective Treatment Measures With Widening of Disparities
- Two measures showed widening of urban-rural disparities:
- Deaths per 1,000 hospital admissions with acute myocardial infarction, age 18 and over.
- Deaths per 1,000 hospital admissions with congestive heart failure, age 18 and over.
- Two measure showed widening of uninsured-privately insured disparities:
- Deaths per 1,000 hospital admissions with percutaneous transluminal coronary angioplasty, age 40 and over.
- Adults age 40 and over with diagnosed diabetes who received a dilated eye examination in the calendar year.
Slide 21
Measures of Effective Treatment
- This chartbook tracks measures of Effective Treatment through 2013 and 2014, overall and for populations defined by age, race, ethnicity, income, education, insurance, and number of chronic conditions.
- Measures of Effective Treatment include:
- Receipt of processes that reflect high-quality care.
- Outcomes related in part to receipt of high-quality care.
Slide 22
Conditions Covered
- This chartbook is organized around eight conditions that are the leading causes of mortality and morbidity in the United States:
- Cardiovascular disease.
- Cancer.
- Chronic kidney disease.
- Diabetes.
- HIV and AIDS.
- Mental health and substance abuse.
- Musculoskeletal diseases.
- Respiratory diseases.
Slide 23
National Healthcare Quality and Disparities Report
Chartbook on Effective Treatment
Cardiovascular Disease
Slide 24
Measures of Effective Treatment of Cardiovascular Disease
- Treatment of Hypertension:
- Outcome: Adults with hypertension whose blood pressure is under control.
- Outcome: Children with high total cholesterol.
- Treatment of Heart Attack:
- Process: Hospital patients with heart attack given fibrinolytic medication within 30 minutes of arrival.
- Outcome: Inpatient deaths per 1,000 adult hospital admissions with heart attack.
- Treatment of Congestive Heart Failure:
- Outcome: Adult admissions for congestive heart failure per 100,000 population.
Note:
- Measures of screening for cardiovascular disease and risk factors are in the Healthy Living chartbook.
Slide 25
Cardiovascular Disease Measures for Which Disparities Were Eliminated
- Inpatient deaths per 1,000 adult hospital admissions for heart attack:
- Medicare vs. any private insurance.
Slide 26
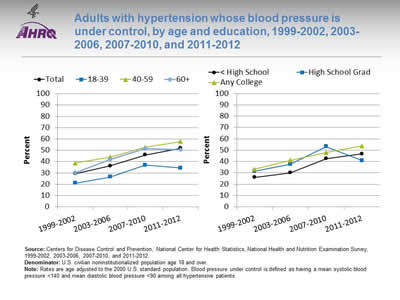
Adults with hypertension whose blood pressure is under control, by age and education, 1999-2002, 2003-2006, 2007-2010, and 2011-2012
Image: Charts show adults with hypertension whose blood pressure is under control:
Left Chart:
| Age | 1999-2002 | 2003-2006 | 2007-2010 | 2011-2012 |
|---|---|---|---|---|
| Total | 29.4 | 36.2 | 45.9 | 51.8 |
| 18-39 | 20.9 | 26.4 | 37.0 | 34.4 |
| 40-59 | 38.7 | 44.1 | 52.7 | 57.7 |
| 60+ | 30.4 | 41.9 | 51.6 | 50.5 |
Right Chart:
| Education | 1999-2002 | 2003-2006 | 2007-2010 | 2001-2012 |
|---|---|---|---|---|
| < High School | 26.0 | 30.0 | 42.6 | 46.7 |
| High School Grad | 31.4 | 37.5 | 53.2 | 40.8 |
| Any College | 33.1 | 41.1 | 47.8 | 53.7 |
Source: Centers for Disease Control and Prevention, National Center for Health Statistics, National Health and Nutrition Examination Survey, 1999-2002, 2003-2006, 2007-2010, and 2011-2012.
Denominator: U.S. civilian noninstitutionalized population age 18 and over.
Notes: Rates are age adjusted to the 2000 U.S. standard population. Blood pressure under control is defined as having a mean systolic blood pressure <140 and mean diastolic blood pressure <90 among all hypertensive patients.
- Importance: Although progress has been made in raising awareness of blood pressure screening and monitoring, blood pressure control among people with diagnosed high blood pressure remains a problem.
- Trends: From 1999-2002 to 2011-2012, the percentage of adults with hypertension who had their blood pressure under control improved overall. The percentage also improved for adults with less than a high school education and adults with any college. There was no statistically significant change among high school graduates.
- Groups With Disparities: In all years, adults with hypertension ages 40-59 and 60 years and over were more likely than adults ages 18-39 with hypertension to have their blood pressure under control.
Slide 27
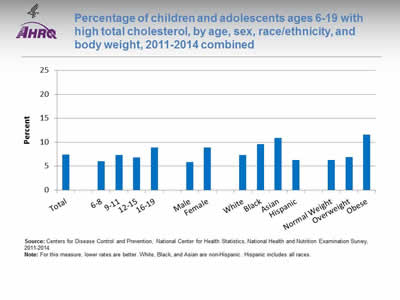
Percentage of children and adolescents ages 6-19 with high total cholesterol, by age, sex, race/ethnicity, and body weight, 2011-2014 combined
Image: Chart shows percentage of children and adolescents with high total cholesterol:
- Total - 7.4.
- Age:
- 6-8 - 6.
- 9-11- 7.3.
- 12-15 - 6.8.
- 16-19 - 8.9.
- Sex:
- Male - 5.9.
- Female - 8.9.
- Race/ethnicity:
- White - 7.3.
- Black - 9.6.
- Asian - 10.9.
- Hispanic - 6.3.
- Body weight:
- Normal Weight - 6.3.
- Overweight - 6.9.
- Obese - 11.6.
Source: Centers for Disease Control and Prevention, National Center for Health Statistics, National Health and Nutrition Examination Survey, 2011-2014.
Notes: For this measure, lower rates are better. White, Black, and Asian are non-Hispanic. Hispanic includes all races.
- Importance: Serum lipid concentrations track from childhood into adulthood (Chauhan & Paunikar, 2014). Among adults in the United States, dyslipidemia is associated with cardiovascular events, including premature death (Kit BK, et al, 2015). Early identification of dyslipidemia may improve long-term health outcomes. Current evidence-based clinical practice guidelines recommend universal screening of serum lipid concentrations during childhood (Chauhan & Paunikar, 2014).
- Overall Rate: During 2011-2014, overall, 7.4% of children and adolescents ages 6-19 had high total cholesterol.
- Groups With Disparities:
- The percentage of children and adolescents with high cholesterol was lower among children ages 6-8 (6.0%) than adolescents ages 16-19 (8.9%).
- A higher percentage of females (8.9%) had high total cholesterol compared with males (5.9%).
- A higher percentage of Black (9.6%) and Asian (10.9%) children and adolescents had high total cholesterol compared with White (7.3%) children and adolescents.
- The percentage of obese children and adolescents who had high total cholesterol was nearly twice the percentage of normal weight children with high total cholesterol (11.6% compared with 6.3%).
Slide 28
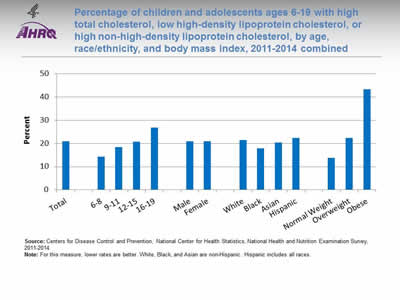
Percentage of children and adolescents ages 6-19 with high total cholesterol, low high-density lipoprotein cholesterol, or high non-high-density lipoprotein cholesterol, by age, race/ethnicity, and body mass index, 2011-2014 combined
Image: Chart shows percentage of children and adolescents with high total cholesterol, low high-density lipoprotein cholesterol, or high non-high-density lipoprotein cholesterol:
- Total - 21.0.
- Age:
- 6-8 - 14.3.
- 9-11 - 18.5.
- 12-15 - 20.8.
- 16-19 - 26.9.
- Sex:
- Male - 20.9.
- Female - 21.0.
- Race/ethnicity:
- White - 21.5.
- Black - 17.8.
- Asian - 20.4.
- Hispanic - 22.3.
- Body mass index:
- Normal Weight - 13.8.
- Overweight - 22.3.
- Obese - 43.3.
Source: Centers for Disease Control and Prevention, National Center for Health Statistics, National Health and Nutrition Examination Survey, 2011-2014.
Notes: For this measure, lower rates are better. White, Black, and Asian are non-Hispanic. Hispanic includes all races.
- Importance: Studies have shown that atherosclerosis begins in childhood and can lead to coronary heart disease in adults. It has also been shown that there is a strong correlation between pediatric hyperlipidemia, carotid intimal thickening, and cardiovascular events in adults (Chauhan & Paunikar, 2014). The Bogalusa Heart Study demonstrated that non-high-density lipoprotein cholesterol is a better predictor of adult dyslipidemia than low-density lipoprotein cholesterol (Srinivasan, et al., 2006).
- Overall Rate: During 2011-2014, overall, 21.0% of children and adolescents had an abnormal cholesterol measure.
- Groups With Disparities:
- The percentage of children and adolescents who had at least one abnormal cholesterol reading increased with age. Approximately 14% of children ages 6-8 had at least one abnormal cholesterol reading and 26.9% of adolescents ages 16-19 had at least one abnormal cholesterol measure.
- The percentage of Black children and adolescents with at least one abnormal cholesterol reading was lower than the percentage of White children and adolescents with at least one abnormal cholesterol reading (17.8% compared with 21.5%).
- The percentage of obese children with at least one abnormal cholesterol measure (43.3%) was more than three times as high as the percentage among children of normal weight (13.8%).
Slide 29
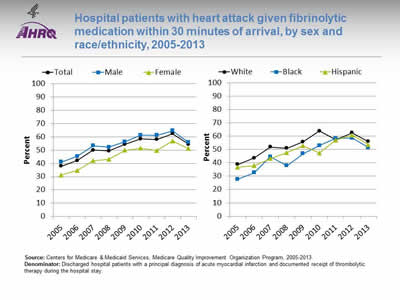
Hospital patients with heart attack given fibrinolytic medication within 30 minutes of arrival, by sex and race/ethnicity, 2005-2013
Image: Charts show hospital patients with heart attack given fibrinolytic medication within 30 minutes of arrival:
Left Chart:
| Sex | 2005 | 2006 | 2007 | 2008 | 2009 | 2010 | 2011 | 2012 | 2013 |
|---|---|---|---|---|---|---|---|---|---|
| Total | 37.9 | 42.1 | 50 | 49.4 | 54.4 | 58.4 | 57.9 | 62.3 | 54.3 |
| Female | 31.1 | 34.6 | 42 | 43.0 | 49.8 | 51.3 | 49.6 | 56.9 | 51 |
| Male | 41.1 | 45.2 | 53.3 | 52.1 | 56.3 | 61.2 | 61.1 | 64.6 | 55.8 |
Right Chart:
| Race/Ethnicity | 2005 | 2006 | 2007 | 2008 | 2009 | 2010 | 2011 | 2012 | 2013 |
|---|---|---|---|---|---|---|---|---|---|
| White | 38.7 | 43.6 | 51.8 | 51.0 | 55.7 | 63.8 | 57.3 | 62.5 | 55.9 |
| Black | 27.7 | 32.6 | 44.5 | 37.8 | 46.8 | 53 | 58.2 | 58.5 | 51.4 |
| Hispanic | 36.8 | 37.8 | 43.2 | 47.6 | 52.8 | 47.3 | 57 | 60.8 | 53.5 |
Source: Centers for Medicare & Medicaid Services, Medicare Quality Improvement Organization Program, 2005-2013.
Denominator: Discharged hospital patients with a principal diagnosis of acute myocardial infarction and documented receipt of thrombolytic therapy during the hospital stay.
Notes:
- Importance: Some heart attacks are caused by blood clots. Early actions, such as fibrinolytic medication, may open blockages caused by blood clots, reduce heart muscle damage, and save lives. To be effective, these actions need to be performed quickly after the start of a heart attack.
- Trends: From 2005 to 2013, the percentage of patients who received timely fibrinolytic medication improved overall, for both sexes, and for all racial/ethnic groups.
- Groups With Disparities:
- In 7 of 9 years, the percentage of patients who received timely fibrinolytic medication was significantly higher for males than for females. In the 2 most recent years, there was no statistically significant difference in the percentage of male and female patients who received timely fibrinolytic medication.
- From 2005 to 2010, the percentage of patients who received timely fibrinolytic medication was significantly higher for Whites than for Blacks. From 2011 to 2013, there was no statistically significant difference in the percentage of White and Black patients who received timely fibrinolytic medication.
Slide 30
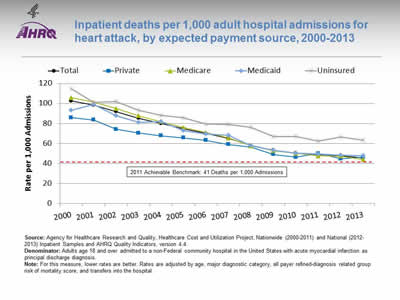
Inpatient deaths per 1,000 adult hospital admissions for heart attack, by expected payment source, 2000-2013
Image: Charts show inpatient deaths per 1,000 adult hospital admissions for heart attack:
| Payment Source | 2000 | 2001 | 2002 | 2003 | 2004 | 2005 | 2006 | 2007 | 2008 | 2009 | 2010 | 2011 | 2012 | 2013 |
|---|---|---|---|---|---|---|---|---|---|---|---|---|---|---|
| Total | 102.4 | 98.3 | 91.8 | 85.2 | 79.9 | 74.7 | 69.9 | 65.0 | 57.9 | 53.0 | 50.2 | 48.7 | 47.6 | 45.4 |
| Private | 85.9 | 83.6 | 74.2 | 70.4 | 67.6 | 65.5 | 63.1 | 58.8 | 56.3 | 49.0 | 46.3 | 49.9 | 44.5 | 46.2 |
| Medicaid | 93.2 | 98.9 | 87.9 | 81.2 | 82.1 | 72.6 | 69.2 | 68.0 | 57.8 | 53.0 | 50.4 | 49.3 | 48.3 | 47.7 |
| Medicare | 105.8 | 101.2 | 94.9 | 87.6 | 81.8 | 75.8 | 70.7 | 65.5 | 57.5 | 52.7 | 50.0 | 47.5 | 47.2 | 43.9 |
| Uninsured | 114.9 | 101.3 | 101.7 | 93.1 | 88.0 | 85.7 | 79.3 | 79.2 | 76.0 | 67.1 | 66.7 | 62.3 | 66.7 | 63.1 |
2011 Achievable Benchmark: 41 Deaths per 1,000 Admissions.
Source: Agency for Healthcare Research and Quality, Healthcare Cost and Utilization Project, Nationwide (2000-2011) and National (2012-2013) Inpatient Samples and AHRQ Quality Indicators, version 4.4.
Denominator: Adults age 18 and over admitted to a non-Federal community hospital in the United States with acute myocardial infarction as principal discharge diagnosis.
Notes: For this measure, lower rates are better. Rates are adjusted by age, major diagnostic category, all payer refined-diagnosis related group risk of mortality score, and transfers into the hospital.
- Importance: Heart attack is a common life-threatening condition that requires rapid recognition and efficient treatment in a hospital to reduce the risk of serious heart damage and death.
- Trends: From 2000 to 2013, the risk-adjusted inpatient mortality rate for hospital admissions with heart attack decreased significantly overall and for all insurance groups.
- Groups With Disparities: In all years, uninsured patients had higher inpatient mortality rates for hospital admissions with heart attack than privately insured patients.
- Achievable Benchmark:
- The 2011 top 4 State achievable benchmark for inpatient heart attack mortality was 41 deaths per 1,000 admissions. The top 4 States that contributed to the achievable benchmark are Arizona, Georgia, Michigan, and Ohio.
- At the current rate of improvement, the 2011 benchmark could be met for the total population in approximately 1 year.
- At current rates of improvement, uninsured patients could reach the 2011 benchmark in 6 years while other insurance groups could reach it in less than 2 years.
Slide 31
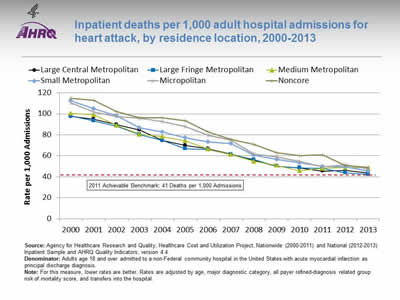
Inpatient deaths per 1,000 adult hospital admissions for heart attack, by residence location, 2000-2013
Image: Chart shows inpatient deaths per 1,000 adult hospital admissions for heart attack:
| Residence Location | 2000 | 2001 | 2002 | 2003 | 2004 | 2005 | 2006 | 2007 | 2008 | 2009 | 2010 | 2011 | 2012 | 2013 |
|---|---|---|---|---|---|---|---|---|---|---|---|---|---|---|
| Large Central Metropolitan | 97.6 | 94.9 | 89.8 | 84.7 | 74.5 | 69.9 | 66.8 | 61.4 | 55.7 | 50.2 | 48.5 | 45.5 | 46.0 | 43.9 |
| Large Fringe Metropolitan | 97.9 | 93.4 | 88.2 | 80.4 | 74.7 | 66.8 | 66.0 | 61.2 | 56.2 | 50.1 | 48.6 | 47.9 | 43.8 | 42.4 |
| Medium Metropolitan | 100.4 | 99.1 | 89.1 | 80.5 | 78.3 | 74.4 | 66.3 | 61.3 | 54.7 | 51.0 | 45.7 | 48.0 | 48.8 | 48.3 |
| Small Metropolitan | 112.4 | 104.9 | 98.4 | 86.6 | 82.7 | 77.3 | 73.3 | 71.7 | 60.5 | 56.4 | 53.5 | 50.0 | 49.4 | 45.4 |
| Micropolitan | 110.3 | 101.7 | 97.3 | 96.0 | 92.5 | 87.9 | 79.6 | 74.8 | 61.7 | 59.0 | 54.5 | 49.6 | 51.6 | 47.5 |
| Noncore | 114.9 | 112.9 | 102.3 | 96.3 | 96.3 | 93.4 | 82.8 | 75.6 | 71.0 | 62.9 | 60.1 | 60.9 | 50.5 | 49.0 |
2011 Achievable Benchmark: 41 Deaths per 1,000 Admissions.
Source: Agency for Healthcare Research and Quality, Healthcare Cost and Utilization Project, Nationwide (2000-2011) and National (2012-2013) Inpatient Sample and AHRQ Quality Indicators, version 4.4.
Denominator: Adults age 18 and over admitted to a non-Federal community hospital in the United States with acute myocardial infarction as principal discharge diagnosis.
Notes: For this measure, lower rates are better. Rates are adjusted by age, major diagnostic category, all payer refined-diagnosis related group risk of mortality score, and transfers into the hospital.
- Importance: Urban-rural disparities in cardiovascular mortality have been observed.
- Trends: From 2000 to 2013, the risk-adjusted inpatient mortality rate for hospital admissions with heart attack decreased significantly for all residence location groups.
- Groups With Disparities: In all years, residents of micropolitan and noncore areas had higher inpatient mortality rates for hospital admissions with heart attack than residents of large fringe metropolitan areas.
- Achievable Benchmark:
- The 2011 top 4 State achievable benchmark for inpatient heart attack mortality was 41 deaths per 1,000 admissions. The top 4 States that contributed to the achievable benchmark are Arizona, Georgia, Michigan, and Ohio.
- At current rates of improvement, patients from large fringe, large central, and small metropolitan areas could reach the 2011 benchmark in less than a year while patients from micropolitan, noncore, and medium metropolitan areas could reach the benchmark in a year and a half.
Slide 32
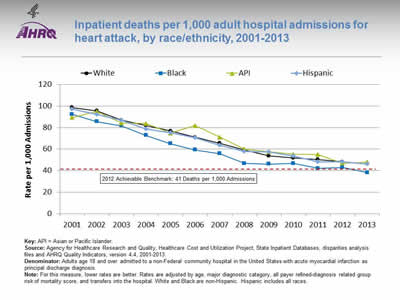
Inpatient deaths per 1,000 adult hospital admissions for heart attack, by race/ethnicity, 2001-2013
Image: Chart shows inpatient deaths per 1,000 adult hospital admissions for heart attack:
| Year | White | Black | API | Hispanic |
|---|---|---|---|---|
| 2001 | 98.7 | 92.2 | 89.5 | 97.2 |
| 2002 | 95.5 | 85.5 | 95.0 | 92.0 |
| 2003 | 86.9 | 81.6 | 84.2 | 86.6 |
| 2004 | 81.8 | 72.9 | 83.9 | 78.8 |
| 2005 | 76.9 | 65.2 | 75.0 | 75.2 |
| 2006 | 71.2 | 59.2 | 81.8 | 70.4 |
| 2007 | 65.4 | 55.8 | 71.1 | 63.6 |
| 2008 | 59.1 | 46.8 | 60.0 | 57.6 |
| 2009 | 53.7 | 46.1 | 57.5 | 57.5 |
| 2010 | 51.7 | 46.7 | 55.2 | 53.6 |
| 2011 | 50.5 | 42.1 | 55.0 | 48.1 |
| 2012 | 48.3 | 43.0 | 47.0 | 48.0 |
| 2013 | 46.1 | 38.3 | 48.1 | 46.4 |
2012 Achievable Benchmark: 41 Deaths per 1,000 Admissions.
Key: API = Asian or Pacific Islander.
Source: Agency for Healthcare Research and Quality, Healthcare Cost and Utilization Project, State Inpatient Databases, disparities analysis files and AHRQ Quality Indicators, version 4.4, 2001-2013.
Denominator: Adults age 18 and over admitted to a non-Federal community hospital in the United States with acute myocardial infarction as principal discharge diagnosis.
Notes: For this measure, lower rates are better. Rates are adjusted by age, major diagnostic category, all payer refined-diagnosis related group risk of mortality score, and transfers into the hospital. White and Black are non-Hispanic. Hispanic includes all races.
- Importance: Racial disparities in heart attack care have been observed.
- Trends: From 2001 to 2013, the risk-adjusted inpatient mortality rate for hospital admissions with heart attack decreased significantly for all racial/ethnic groups.
- Groups With Disparities: In 10 of 13 years, Black patients had lower inpatient mortality rates for hospital admissions with heart attack than White patients.
- Achievable Benchmark:
- The 2011 top 4 State achievable benchmark for inpatient heart attack mortality was 41 deaths per 1,000 admissions. The top 4 States that contributed to the achievable benchmark are Arizona, Georgia, Michigan, and Ohio.
- In 2013, Blacks had achieved the benchmark.
- At current rates of improvement, all other racial/ethnic groups could reach the benchmark in less than 2 years.
Slide 33
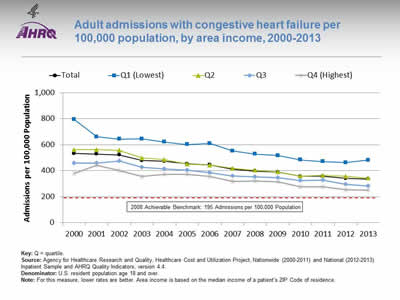
Adult admissions with congestive heart failure per 100,000 population, by area income, 2000-2013
Image: Chart shows adult admissions with congestive heart failure per 100,000 population:
| Year | Total | Q1 (Lowest) |
Q2 | Q3 | Q4 (Highest) |
|---|---|---|---|---|---|
| 2000 | 532.4 | 796.1 | 561.6 | 458.0 | 379.5 |
| 2001 | 528.6 | 660.8 | 561.8 | 459.4 | 441.3 |
| 2002 | 522.7 | 643.9 | 556.9 | 476.1 | 402.2 |
| 2003 | 478.1 | 645.7 | 498.7 | 426.3 | 356.4 |
| 2004 | 472.8 | 620.9 | 484.5 | 412.5 | 370.9 |
| 2005 | 453.0 | 601.4 | 450.8 | 405.1 | 373.8 |
| 2006 | 444.6 | 610.2 | 443.9 | 385.2 | 357.6 |
| 2007 | 410.7 | 551.6 | 418.0 | 360.5 | 316.6 |
| 2008 | 397.3 | 528.5 | 402.9 | 352.0 | 320.7 |
| 2009 | 388.5 | 517.6 | 391.5 | 345.2 | 314.0 |
| 2010 | 357.2 | 483.7 | 359.3 | 324.5 | 275.3 |
| 2011 | 357.6 | 471.3 | 364.1 | 329.0 | 276.5 |
| 2012 | 341.0 | 462.0 | 357.6 | 296.5 | 254.9 |
| 2013 | 337.1 | 481.6 | 343.3 | 282.1 | 252.0 |
2008 Achievable Benchmark: 195 Admissions per 100,000 Population.
Key: Q = quartile.
Source: Agency for Healthcare Research and Quality, Healthcare Cost and Utilization Project, Nationwide (2000-2011) and National (2012-2013) Inpatient Sample and AHRQ Quality Indicators, version 4.4.
Denominator: U.S. resident population age 18 and over.
Notes: For this measure, lower rates are better. Area income is based on the median income of a patient’s ZIP Code of residence.
- Importance: Some hospitalizations for heart failure are unavoidable, but rates of hospitalization can be influenced by the quality of outpatient care.
- Trends: From 2000 to 2013, the rate of admission for congestive heart failure among adults decreased significantly overall and for all area income groups.
- Groups With Disparities: In all years, rates of admission for congestive heart failure were higher among residents in the lowest and second area income quartiles compared with residents in the highest area income quartile.
- Achievable Benchmark:
- The 2008 top 4 State achievable benchmark for adult congestive heart failure admissions was 195 admissions per 100,000 population. The top 4 States that contributed to the achievable benchmark are Colorado, Oregon, Utah, and Vermont.
- At current rates of improvement, residents in the highest area income quartile could achieve the benchmark in 4 years while residents in the lowest area income quartile would need 15 years.
Slide 34
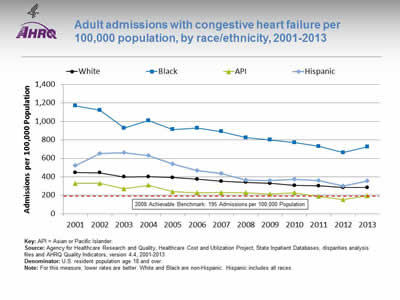
Adult admissions with congestive heart failure per 100,000 population, by race/ethnicity, 2001-2013
Image: Chart shows adult admissions with congestive heart failure per 100,000 population:
| Year | White | Black | API | Hispanic |
|---|---|---|---|---|
| 2001 | 445.4 | 1169.8 | 328.0 | 519.5 |
| 2002 | 444.1 | 1121.8 | 328.4 | 653.0 |
| 2003 | 399.5 | 927.8 | 269.9 | 662.2 |
| 2004 | 400.9 | 1009.3 | 307.6 | 629.9 |
| 2005 | 392.8 | 912.4 | 239.4 | 538.0 |
| 2006 | 373.0 | 927.5 | 226.7 | 465.9 |
| 2007 | 350.8 | 890.2 | 230.0 | 437.1 |
| 2008 | 339.9 | 824.6 | 228.1 | 362.8 |
| 2009 | 329.7 | 799.2 | 211.0 | 360.2 |
| 2010 | 306.3 | 771.4 | 227.8 | 372.7 |
| 2011 | 301.1 | 730.5 | 186.5 | 359.2 |
| 2012 | 283.2 | 662.2 | 152.0 | 298.9 |
| 2013 | 282.5 | 726.1 | 192.8 | 356.7 |
2008 Achievable Benchmark: 195 Admissions per 100,000 Population.
Key: API = Asian or Pacific Islander.
Source: Agency for Healthcare Research and Quality, Healthcare Cost and Utilization Project, State Inpatient Databases, disparities analysis files and AHRQ Quality Indicators, version 4.4, 2001-2013.
Denominator: U.S. resident population age 18 and over.
Notes: For this measure, lower rates are better. White and Black are non-Hispanic. Hispanic includes all races.
- Importance: Racial disparities in care for congestive heart failure have been observed.
- Trends: From 2001 to 2013, the rate of admission for congestive heart failure among adults decreased significantly for all racial/ethnic groups.
- Groups With Disparities: In all years, rates of admission for congestive heart failure were higher among Blacks and lower among Asians and Pacific Islanders (API) compared with Whites.
- Achievable Benchmark:
- The 2008 top 4 State achievable benchmark for adult congestive heart failure admissions was 195 admissions per 100,000 population. The top 4 States that contributed to the achievable benchmark are Colorado, Oregon, Utah, Vermont.
- At current rates of improvement, the benchmark could be achieved by Hispanics in 5 years and Whites could achieve it in 6 years. Blacks would need 15 years to achieve the benchmark.
- APIs have already achieved the benchmark.
Slide 35
References
Chauhan A, Paunikar P. Update on pediatric hyperlipidemia. Curr Opin Pediatr 2014 Apr;26(2):252-8. PMID: 24553633.
Kit BK, Kuklina E, Carroll MD, Ostchega Y, Freedman DS, Ogden CL. Prevalence of and trends in dyslipedmia and blood pressure among children and adolescents, 1999-2012. JAMA Pediatr 2015;169(3):272-279
Srinivasan SR, Frontini MG, Xu J, et al. Utility of childhood non-high-density lipoprotein cholesterol levels in predicting adult dyslipidemia and other cardiovascular risks: the Bogalusa Heart Study. Pediatrics 2006 Jul;118(1):201-6. http://pediatrics.aappublications.org/content/118/1/201.long?sso=1&sso_redirect_count=1&nfstatus=401&nftoken=00000000-0000-0000-0000-000000000000&nfstatusdescription=ERROR%3a+No+local+token. Accessed August 29, 2016.
Slide 36

National Healthcare Quality and Disparities Report
Chartbook on Effective Treatment
Cancer
Slide 37
Measures of Effective Treatment of Cancer
- Process:
- Women with clinical stage I-IIb breast cancer who received axillary node dissection or sentinel lymph node biopsy at the time of surgery.
- Women under age 70 treated for breast cancer with breast-conserving surgery who received radiation therapy to the breast within 1 year of diagnosis.
- Outcome:
- Age-adjusted breast cancer deaths per 100,000 population.
Note:
- Measures of screening for cancer are located in the Healthy Living chartbook.
Slide 38
Cancer Measures for Which Disparities Were Eliminated
- Women under age 70 treated for breast cancer with breast-conserving surgery who received radiation therapy to the breast within 1 year of diagnosis:
- White vs. Black.
- White vs. Asian.
Slide 39
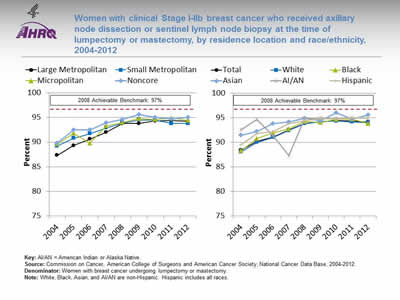
Women with clinical Stage I-IIb breast cancer who received axillary node dissection or sentinel lymph node biopsy at the time of lumpectomy or mastectomy, by residence location and race/ethnicity, 2004-2012
Image: Charts show women with clinical Stage I-IIb breast cancer who received axillary node dissection or sentinel lymph node biopsy at the time of lumpectomy or mastectomy:
Left Chart:
| Location | 2004 | 2005 | 2006 | 2007 | 2008 | 2009 | 2010 | 2011 | 2012 |
|---|---|---|---|---|---|---|---|---|---|
| Large Metropolitan | 87.3 | 89.3 | 90.6 | 92.0 | 93.8 | 93.8 | 94.3 | 94.4 | 94.2 |
| Small Metropolitan | 89.2 | 90.8 | 91.7 | 92.9 | 93.9 | 94.5 | 94.5 | 93.8 | 93.8 |
| Micropolitan | 89.6 | 91.8 | 89.8 | 93.3 | 94.0 | 94.8 | 94.6 | 94.9 | 94.4 |
| Noncore | 89.8 | 92.5 | 92.5 | 93.9 | 94.6 | 95.6 | 95.0 | 94.7 | 95.0 |
Right Chart:
| Race/Ethnicity | 2004 | 2005 | 2006 | 2007 | 2008 | 2009 | 2010 | 2011 | 2012 |
|---|---|---|---|---|---|---|---|---|---|
| Total | 88.4 | 90.2 | 91.0 | 92.5 | 93.8 | 94.2 | 94.4 | 94.3 | 94.1 |
| White | 88.1 | 90.0 | 91.0 | 92.4 | 93.8 | 94.2 | 94.3 | 94.1 | 94.0 |
| Black | 88.3 | 90.8 | 91.9 | 92.7 | 94.2 | 94.0 | 94.6 | 94.7 | 93.8 |
| Hispanic | 89.5 | 91.8 | 92.2 | 93.8 | 94.3 | 94.8 | 94.7 | 95.0 | 95.0 |
| AI/AN | 92.5 | 94.6 | 91.3 | 87.3 | 94.8 | 95.0 | 94.9 | 95.0 | 94.9 |
| Asian | 91.4 | 92.2 | 93.8 | 94.1 | 94.9 | 94.4 | 96.0 | 94.7 | 95.6 |
2008 Achievable Benchmark: 97%.
Key: AI/AN = American Indian or Alaska Native.
Source: Commission on Cancer, American College of Surgeons and American Cancer Society, National Cancer Data Base, 2004-2012.
Denominator: Women with breast cancer undergoing lumpectomy or mastectomy.
Notes: White, Black, Asian, and AI/AN are non-Hispanic. Hispanic includes all races.
- Importance: Recommended cancer treatment depends on different factors, such as the stage or extent of the cancer within the body, especially whether the disease has spread from the original site to other parts of the body. If cancer cells have spread to the lymph nodes, there is a higher chance that the cells could have metastasized to other sites in the body. The more lymph nodes with breast cancer cells, the more likely it is that the cancer may be found in other organs as well. Therefore, finding cancer in one or more lymph nodes often affects the treatment plan.
- Trends: From 2004 to 2012, the percentage of women with clinical stage I-IIb breast cancer who received axillary node dissection or sentinel lymph node biopsy at the time of lumpectomy or mastectomy improved overall and for all residence location and racial/ethnic groups except American Indians and Alaska Natives (AI/ANs).
- Groups With Disparities:
- In 7 of 9 years, the percentage of women who received axillary node dissection or sentinel lymph node biopsy was higher for residents of noncore areas than for residents of large metropolitan areas.
- In 7 of 9 years, the percentage of women who received axillary node dissection or sentinel lymph node biopsy was higher for Asian women than for White women.
- Achievable Benchmark:
- The 2008 top 6 State achievable benchmark was 97%. The top 6 States that contributed to the achievable benchmark are Alaska, Arkansas, Nevada, Mississippi, Montana, and Oklahoma.
- At the current rates of improvement, the achievable benchmark could be attained overall in 4 years, in less than 6 years for all residence locations, and in less than 5 years for all racial/ethnic groups.
Slide 40
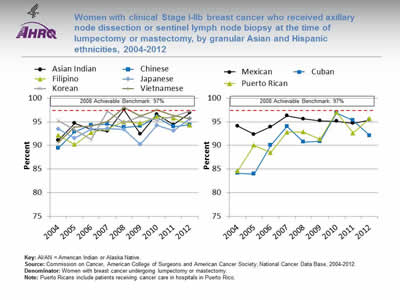
Women with clinical Stage I-IIb breast cancer who received axillary node dissection or sentinel lymph node biopsy at the time of lumpectomy or mastectomy, by granular Asian and Hispanic ethnicities, 2004-2012
Image: Charts show women with clinical Stage I-IIb breast cancer who received axillary node dissection or sentinel lymph node biopsy at the time of lumpectomy or mastectomy, by granular Asian and Hispanic ethnicities:
Left Chart:
| Ethnicity | 2004 | 2005 | 2006 | 2007 | 2008 | 2009 | 2010 | 2011 | 2012 |
|---|---|---|---|---|---|---|---|---|---|
| Asian Indian | 91.1 | 94.7 | 93.4 | 93.0 | 97.6 | 92.4 | 96.6 | 94.4 | 96.9 |
| Chinese | 89.4 | 92.9 | 94.3 | 94.5 | 93.8 | 94.1 | 96.0 | 94.0 | 94.4 |
| Filipino | 92.2 | 90.2 | 92.7 | 93.6 | 95.0 | 94.7 | 96.1 | 95.8 | 94.3 |
| Japanese | 93.5 | 91.5 | 93.5 | 93.6 | 93.4 | 90.2 | 94.3 | 93.1 | 95.7 |
| Korean | 95.2 | 93.3 | 91.3 | 97.3 | 94.8 | 96.2 | 95.3 | 96.1 | 97.3 |
| Vietnamese | 90.7 | 93.9 | 94.1 | 95.1 | 98.1 | 96.2 | 97.5 | 96.3 | 95.7 |
Right Chart:
| Ethnicity | 2004 | 2005 | 2006 | 2007 | 2008 | 2009 | 2010 | 2011 | 2012 |
|---|---|---|---|---|---|---|---|---|---|
| Mexican | 94.1 | 92.4 | 94.0 | 96.3 | 95.6 | 95.2 | 95.1 | 94.7 | 95.4 |
| Cuban | 84.1 | 83.9 | 90.0 | 94.0 | 90.7 | 90.9 | 96.9 | 95.3 | 92.1 |
| Puerto Rican | 84.6 | 90.0 | 88.5 | 92.8 | 92.8 | 91.4 | 97.0 | 92.6 | 95.7 |
2008 Achievable Benchmark: 97%.
Key: AI/AN = American Indian or Alaska Native.
Source: Commission on Cancer, American College of Surgeons and American Cancer Society, National Cancer Data Base, 2004-2012.
Denominator: Women with breast cancer undergoing lumpectomy or mastectomy.
Notes: Puerto Ricans include patients receiving cancer care in hospitals in Puerto Rico.
- Importance: Asian and Hispanic groups are not homogeneous. Data on granular Asian and Hispanic ethnicities are limited but often show variation in care.
- Trends: From 2004 to 2012, the percentage of women with clinical stage I-IIb breast cancer who received axillary node dissection or sentinel lymph node biopsy at the time of lumpectomy or mastectomy improved for Chinese, Filipino, Vietnamese, Cuban, and Puerto Rican women.
- Achievable Benchmark:
- The 2008 top 6 State achievable benchmark was 97%. The top 6 States that contributed to the achievable benchmark are Alaska, Arkansas, Nevada, Mississippi, Montana, and Oklahoma.
- Koreans have achieved the benchmark.
- At the current rates of improvement, Asian Indian women will achieve the benchmark in less than 1 year, Puerto Ricans in 1 year, Vietnamese women in 2 years, Cubans in less than 4 years, Filipinos in less than 5 years, Chinese women in 6 years, and Mexicans and Japanese women in about 7 years.
Slide 41
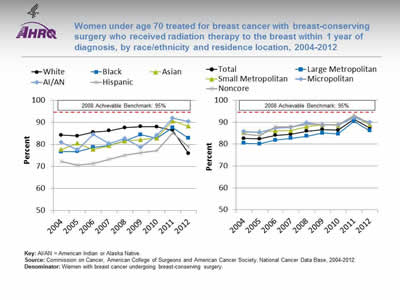
Women under age 70 treated for breast cancer with breast-conserving surgery who received radiation therapy to the breast within 1 year of diagnosis, by race/ethnicity and residence location, 2004-2012
Image: Charts show women under age 70 treated for breast cancer with breast-conserving surgery who received radiation therapy to the breast within 1 year of diagnosis:
Left Chart:
| Year | White | Black | Hispanic | AI/AN | Asian |
|---|---|---|---|---|---|
| 2004 | 84.2 | 76.7 | 72.3 | 81 | 77.7 |
| 2005 | 83.8 | 76.8 | 70.5 | 77.5 | 80.5 |
| 2006 | 85.5 | 78.6 | 71.4 | 84.6 | 77.7 |
| 2007 | 86.2 | 79.6 | 73.2 | 80.4 | 79.4 |
| 2008 | 87.6 | 81.7 | 75.1 | 82.6 | 81.6 |
| 2009 | 88.1 | 84.4 | 76.2 | 78.7 | 82.1 |
| 2010 | 88 | 82.7 | 77.2 | 84.1 | 82.9 |
| 2011 | 86.4 | 87.6 | 85.2 | 91.9 | 90.6 |
| 2012 | 75.8 | 82.8 | 78.8 | 90.4 | 88.3 |
Right Chart:
| Year | Total | Large Metropolitan | Small Metropolitan | Micropolitan | Noncore |
|---|---|---|---|---|---|
| 2004 | 82.6 | 80.4 | 85.3 | 85.8 | 84.6 |
| 2005 | 82.4 | 80.1 | 85.7 | 85.4 | 83.8 |
| 2006 | 84 | 81.8 | 86.1 | 87.3 | 87.8 |
| 2007 | 84.5 | 82.7 | 86.2 | 87.6 | 87.8 |
| 2008 | 85.9 | 83.6 | 88 | 89.7 | 88.9 |
| 2009 | 86.7 | 85 | 88.8 | 88.7 | 88.9 |
| 2010 | 86.4 | 84.7 | 88.5 | 88.8 | 88.8 |
| 2011 | 91.3 | 90.4 | 92.7 | 92 | 93.2 |
| 2012 | 87.4 | 86.1 | 88.8 | 90 | 89.1 |
2008 Achievable Benchmark: 95%.
Key: AI/AN = American Indian or Alaska Native.
Source: Commission on Cancer, American College of Surgeons and American Cancer Society, National Cancer Data Base, 2004-2012.
Denominator: Women with breast cancer undergoing breast-conserving surgery.
Notes:
- Importance: Radiotherapy decreases local recurrence rates and improves outcomes for women with invasive breast cancer who undergo breast-conserving surgery. For breast-conserving surgery patients younger than 70 years, delivery of radiotherapy within 1 year is a Commission on Cancer quality-of-cancer-care measure with an expected compliance rate of 90% or more (Hieken, et al., 2016).
- Trends: From 2004 to 2012, the percentage of women treated for breast cancer with breast-conserving surgery who received radiation therapy improved overall and for all racial/ethnic groups except Whites and for all residence locations.
- Groups With Disparities:
- In 7 of 9 years, Black, Asian, and Hispanic women who were treated for breast cancer with breast-conserving surgery were less likely than White women to receive radiation therapy.
- In all years, residents of small metropolitan, micropolitan, and noncore areas who were treated for breast cancer with breast-conserving surgery were more likely than residents of large metropolitan areas to receive radiation therapy.
- Achievable Benchmark:
- The 2008 top 5 State achievable benchmark was 95%. The top 5 States that contributed to the achievable benchmark are Kansas, Minnesota, Montana, New Hampshire, and Wisconsin.
- At the current rates of improvement, Asian and AI/AN women could achieve the benchmark in less than 5 years.
- Hispanic and Black women could achieve the benchmark in about 11 years.
- White women are making no progress toward the benchmark.
Slide 42
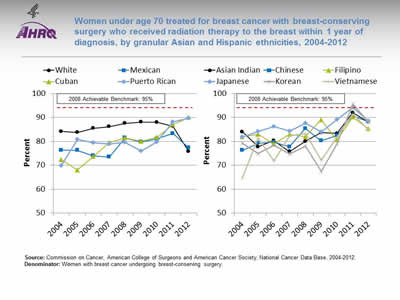
Women under age 70 treated for breast cancer with breast-conserving surgery who received radiation therapy to the breast within 1 year of diagnosis, by granular Asian and Hispanic ethnicities, 2004-2012
Image: Charts show women under age 70 treated for breast cancer with breast-conserving surgery who received radiation therapy to the breast within 1 year of diagnosis, by granular Asian and Hispanic ethnicities:
Left Chart:
| Year | White | Mexican | Cuban | Puerto Rican |
|---|---|---|---|---|
| 2004 | 84.2 | 76.4 | 72.4 | 69.9 |
| 2005 | 83.8 | 76.3 | 68 | 80.9 |
| 2006 | 85.5 | 74 | 73.7 | 79.5 |
| 2007 | 86.2 | 73.5 | 79.5 | 79 |
| 2008 | 87.6 | 81.5 | 81.5 | 79.7 |
| 2009 | 88.1 | 79.8 | 80 | 75.9 |
| 2010 | 88 | 81.1 | 81.7 | 79.8 |
| 2011 | 86.4 | 83.3 | 87.1 | 88.2 |
| 2012 | 75.8 | 77.3 | 90 | 89.7 |
Right Chart:
| Year | Asian Indian | Chinese | Filipino | Japanese | Korean | Vietnamese |
|---|---|---|---|---|---|---|
| 2004 | 84 | 76.3 | 81.9 | 81.9 | 79.3 | 64.6 |
| 2005 | 77.8 | 79.2 | 83 | 84.1 | 75 | 81.3 |
| 2006 | 80.4 | 79.7 | 79.1 | 86.3 | 78.4 | 71.8 |
| 2007 | 75.8 | 77.8 | 83 | 84.3 | 74.8 | 82.4 |
| 2008 | 80 | 85.4 | 81.9 | 87.7 | 78 | 83.3 |
| 2009 | 83.7 | 80.3 | 89.1 | 83.9 | 67.5 | 72.2 |
| 2010 | 83.3 | 82.5 | 80.6 | 89.2 | 79.1 | 81.9 |
| 2011 | 92 | 90.6 | 90.2 | 94.2 | 95.7 | 91.4 |
| 2012 | 88.1 | 88.3 | 85.3 | 88.5 | 88.2 | 84.8 |
2008 Achievable Benchmark: 95%.
Source: Commission on Cancer, American College of Surgeons and American Cancer Society, National Cancer Data Base, 2004-2012.
Denominator: Women with breast cancer undergoing breast-conserving surgery.
Notes:
- Importance: Breast-conserving surgery followed by radiation therapy is an established standard of care for early stage breast cancer with equivalent survival for invasive breast cancer patients compared with mastectomy. Minority women with early stage breast cancer have been reported to have double the risk for failing to receive necessary adjuvant treatments compared with White women (Parise, et al., 2012).
- Groups With Disparities:
- In 7 of 9 years, Mexican women who were treated for breast cancer with breast-conserving surgery were less likely than White women to receive radiation therapy.
- In 2012, Cuban, Puerto Rican, Asian Indian, Chinese, Japanese, and Korean women who were treated for breast cancer with breast-conserving surgery were more likely than White women to receive radiation therapy.
- Achievable Benchmark:
- The 2008 top 5 State achievable benchmark was 95%. The top 5 States that contributed to the achievable benchmark are Kansas, Minnesota, Montana, New Hampshire and Wisconsin.
- At the current rates of improvement, Cubans could reach the benchmark in 2 years, Puerto Ricans in 3 years but it would take Mexican women nearly 24 years to achieve the benchmark.
- Korean women achieved the benchmark in 2011.
- At the current rates of improvement, Chinese women could achieve the benchmark in 2.5 years, Vietnamese in 5 years, Asian Indians and Japanese in about 6 years and Filipinos in 13 years.
Slide 43
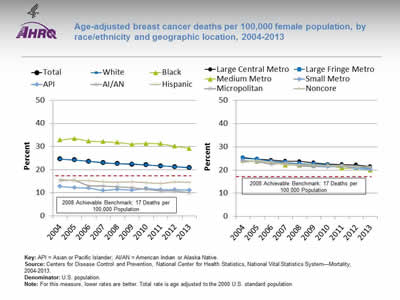
Age-adjusted breast cancer deaths per 100,000 female population, by race/ethnicity and geographic location, 2004-2013
Image: Charts show age-adjusted breast cancer deaths per 100,000 female population:
Left Chart:
| Race/Ethnicity | 2004 | 2005 | 2006 | 2007 | 2008 | 2009 | 2010 | 2011 | 2012 | 2013 |
|---|---|---|---|---|---|---|---|---|---|---|
| Total | 24.6 | 24.2 | 23.6 | 23 | 22.6 | 22.3 | 22.1 | 21.6 | 21.3 | 20.8 |
| White | 24.6 | 24.2 | 23.6 | 23.1 | 22.6 | 22.5 | 22.1 | 21.6 | 21.3 | 20.9 |
| Black | 32.9 | 33.5 | 32.3 | 32.1 | 31.8 | 31 | 31.3 | 31.2 | 30.2 | 29.2 |
| Hispanic | 15.9 | 15.3 | 15.2 | 14.8 | 14.6 | 14.8 | 14.4 | 14.1 | 14.7 | 14.6 |
| AI/AN | 15.3 | 15.5 | 13.0 | 13 | 12.5 | 12.2 | 11.5 | 10.8 | 10.8 | 10.1 |
| API | 12.7 | 12.2 | 12.1 | 11 | 11.5 | 11.1 | 11.9 | 11.3 | 11.3 | 11.1 |
Right Chart:
| Year | Large Central Metro | Large Fringe Metro | Medium Metro | Small Metro | Micropolitan | Noncore |
|---|---|---|---|---|---|---|
| 2004 | 25.3 | 25.1 | 24 | 24 | 24 | 23.4 |
| 2005 | 24.7 | 24.6 | 23.6 | 23.7 | 23.7 | 24.1 |
| 2006 | 24.3 | 23.7 | 23.3 | 23.5 | 22.5 | 23.4 |
| 2007 | 23.8 | 23.3 | 22.1 | 22.8 | 23.1 | 22.5 |
| 2008 | 23.7 | 22.7 | 22.1 | 22 | 21.7 | 22.3 |
| 2009 | 23.1 | 22.6 | 21.9 | 21.5 | 21.6 | 22.2 |
| 2010 | 22.5 | 22.3 | 22 | 21.3 | 22 | 21.7 |
| 2011 | 22.4 | 21.7 | 20.8 | 21.7 | 21.5 | 22.1 |
| 2012 | 22.2 | 21.2 | 20.8 | 20.6 | 21.5 | 21.3 |
| 2013 | 21.5 | 20.8 | 20 | 20.2 | 21.1 | 21.3 |
2008 Achievable Benchmark: 17 Deaths per 100,000 Population.
Key: API = Asian or Pacific Islander; AI/AN = American Indian or Alaska Native.
Source: Centers for Disease Control and Prevention, National Center for Health Statistics, National Vital Statistics System—Mortality, 2004-2013.
Denominator: U.S. population.
Notes: For this measure, lower rates are better. Total rate is age adjusted to the 2000 U.S. standard population.
- Importance: The death rate from a disease is a function of many factors, including the causes of the disease; social forces; and effectiveness of the health care system in providing prevention, treatment, and management of the disease. Breast cancer deaths reflect the impact of breast cancer screening, diagnosis, and treatment.
- Trends: From 2004 to 2013, the age-adjusted breast cancer death rate improved overall and for all racial/ethnic groups and geographic locations.
- Groups With Disparities:
- In all years, the breast cancer death rate was lower for Asian and Pacific Islander (API), AI/AN, and Hispanic females than for White females.
- In all years, the breast cancer death rate was higher for Black females than for White females.
- Achievable Benchmark:
- The 2008 top 5 State achievable benchmark was 17 deaths per 100,000 population. The top 5 States that contributed to the achievable benchmark are Alaska, Hawaii, Montana, Vermont, and Wyoming.
- The benchmark has been achieved by API, AI/AN, and Hispanic females.
- At the current rates of improvement, the achievable benchmark could be attained overall and for Whites in 9 years but Blacks would require 30 years.
Slide 44
References
Hieken TJ, Mutter RW, Jakub JW, et al. A novel treatment schedule for rapid completion of surgery and radiation in early-stage breast cancer. Ann Surg Oncol 2016 Jun 22 [Epub ahead of print].
Parise CA, Bauer KR, Caggiano V. Disparities in receipt of adjuvant radiation therapy after breast-conserving surgery among the cancer-reporting regions of California. Cancer 2012;118:2516-24. http://onlinelibrary.wiley.com/doi/10.1002/cncr.26542/full. Accessed August 29, 2016.
Slide 45
National Healthcare Quality and Disparities Report
Chartbook on Effective Treatment
Chronic Kidney Disease
Slide 46
Measures of Effective Treatment of Chronic Kidney Disease
- Process:
- Nephrology care before kidney failure.
- Arteriovenous fistula as primary mode of vascular access.
- Registration for transplantation.
- Outcome:
- Hemodialysis death rate.
Slide 47
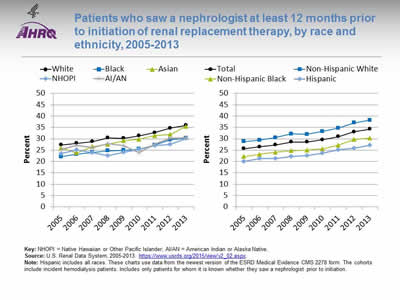
Patients who saw a nephrologist at least 12 months prior to initiation of renal replacement therapy, by race and ethnicity, 2005-2013
Image: Charts show patients who saw a nephrologist at least 12 months prior to initiation of renal replacement therapy:
Left Chart:
| Race | 2005 | 2006 | 2007 | 2008 | 2009 | 2010 | 2011 | 2012 | 2013 |
|---|---|---|---|---|---|---|---|---|---|
| White | 27.3 | 28.0 | 28.8 | 30.4 | 30.2 | 31.3 | 32.7 | 34.7 | 35.9 |
| Black | 22.1 | 23.2 | 24 | 24.7 | 24.9 | 25.5 | 27.2 | 29.6 | 30.2 |
| Asian | 25.9 | 23.8 | 26.6 | 27.6 | 29.1 | 29.8 | 31.4 | 31.9 | 35.5 |
| AI/AN | 25.3 | 27.2 | 26.1 | 27.9 | 26.9 | 23.8 | 27.8 | 30.2 | 30.5 |
| NHOPI | 23.5 | 25.2 | 23.9 | 22.5 | 24.0 | 25.4 | 27.0 | 27.5 | 30.1 |
Right Chart:
| Race/Ethnicity | 2005 | 2006 | 2007 | 2008 | 2009 | 2010 | 2011 | 2012 | 2013 |
|---|---|---|---|---|---|---|---|---|---|
| Total | 25.7 | 26.5 | 27.3 | 28.6 | 28.6 | 29.6 | 31 | 33.1 | 34.3 |
| Hispanic | 20 | 21.3 | 21.3 | 22.3 | 22.6 | 23.7 | 25.1 | 25.8 | 27.1 |
| Non-Hispanic Black | 22.2 | 23.2 | 24.1 | 24.7 | 25.0 | 25.6 | 27.2 | 29.7 | 30.3 |
| Non-Hispanic White | 28.8 | 29.4 | 30.5 | 32.2 | 32.0 | 33.3 | 34.7 | 37 | 38.2 |
Key: NHOPI = Native Hawaiian or Other Pacific Islander; AI/AN = American Indian or Alaska Native.
Source: U.S. Renal Data System, 2005-2013.
Notes: Hispanic includes all races. These charts use data from the newest version of the ESRD Medical Evidence CMS 2278 form. The cohorts include incident hemodialysis patients. Includes only patients for whom it is known whether they saw a nephrologist prior to initiation.
- Importance: Early referral to a nephrologist is important for patients with progressive chronic kidney disease who are approaching kidney failure. Patients who begin nephrology care more than a year before kidney failure are less likely to begin dialysis with a catheter, experience infections related to vascular access, or die during the months after dialysis initiation (USRDS, 2013a).
- Trends: From 2005 to 2013, the total percentage of chronic kidney disease patients receiving care from a nephrologist at least 12 months before the start of renal replacement therapy increased from 25.7% to 34.3%.
- Groups With Disparities:
- In all years, the percentage of new end stage renal disease (ESRD) patients who began nephrology care at least 12 months prior to initiation of renal replacement therapy was higher for non-Hispanic Whites than for Hispanics.
- In 2013, nearly 36% of White and Asian ESRD patients began nephrology care at least 12 months prior to initiation of renal replacement therapy while 30% of Black, American Indian/Alaska Native (AI/AN), and Native Hawaiian or Other Pacific Islander (NHOPI) patients began nephrology care at least 12 months prior to initiation of renal replacement therapy.
Slide 48
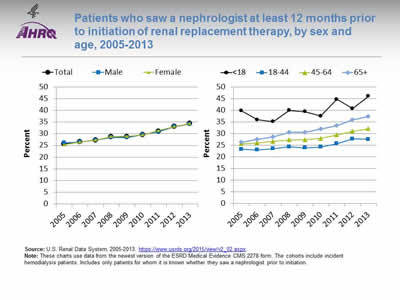
Patients who saw a nephrologist at least 12 months prior to initiation of renal replacement therapy, by sex and age, 2005-2013
Image: Charts show patients who saw a nephrologist at least 12 months prior to initiation of renal replacement therapy:
Left Chart:
| Sex | 2005 | 2006 | 2007 | 2008 | 2009 | 2010 | 2011 | 2012 | 2013 |
|---|---|---|---|---|---|---|---|---|---|
| Total | 25.7 | 26.5 | 27.3 | 28.6 | 28.6 | 29.6 | 31 | 33.1 | 34.3 |
| Male | 26.1 | 26.5 | 27.3 | 28.4 | 28.4 | 29.6 | 30.8 | 33.1 | 34.2 |
| Female | 25.3 | 26.4 | 27.3 | 28.8 | 28.9 | 29.5 | 31.4 | 33.1 | 34.4 |
Right Chart:
| Age | 2005 | 2006 | 2007 | 2008 | 2009 | 2010 | 2011 | 2012 | 2013 |
|---|---|---|---|---|---|---|---|---|---|
| <18 | 39.8 | 36 | 35.2 | 40.0 | 39.5 | 37.6 | 44.7 | 40.8 | 46.1 |
| 18-44 | 23.3 | 23 | 23.6 | 24.4 | 23.9 | 24.3 | 25.7 | 27.8 | 27.6 |
| 45-64 | 25.7 | 26.1 | 26.7 | 27.3 | 27.4 | 27.9 | 29.5 | 31.1 | 32.1 |
| 65+ | 26.2 | 27.5 | 28.6 | 30.5 | 30.5 | 32 | 33.4 | 35.9 | 37.4 |
Source: U.S. Renal Data System, 2005-2013. https://www.usrds.org/2015/view/v2_02.aspx ![]() .
.
Notes: These charts use data from the newest version of the ESRD Medical Evidence CMS 2278 form. The cohorts include incident hemodialysis patients. Includes only patients for whom it is known whether they saw a nephrologist prior to initiation.
- Importance: Early referral to a nephrologist is important for patients with progressive chronic kidney disease who are approaching kidney failure. Patients who begin nephrology care more than a year before kidney failure are less likely to begin dialysis with a catheter, experience infections related to vascular access, or die during the months after dialysis initiation (USRDS, 2013a).
- Trends: From 2005 to 2013, the percentage of male chronic kidney disease patients receiving care from a nephrologist at least 12 months before the start of renal replacement therapy increased from 26.1% to 34.2%. For female patients, the percentage increased from 25.3% to 34.4%.
- Groups With Disparities
- In 2013, 34% of both males and females began nephrology care at least 12 months prior to initiation of renal replacement therapy.
- In all years, the percentage of ESRD patients who began nephrology care at least 12 months prior to initiation of renal replacement therapy was higher for patients under age 18 than for patients ages 18-44, 45-64, and 65 and over.
Slide 49
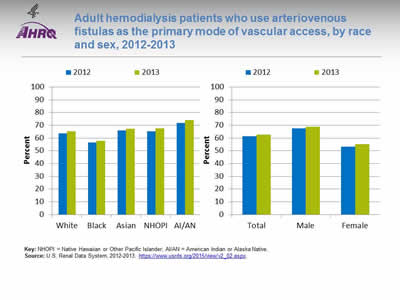
Adult hemodialysis patients who use arteriovenous fistulas as the primary mode of vascular access, by race and sex, 2012-2013
Image: Charts show adult hemodialysis patients who use arteriovenous fistulas as the primary mode of vascular access:
Left Chart:
| Race | 2012 | 2013 |
|---|---|---|
| White | 63.8 | 65.2 |
| Black | 56.4 | 57.8 |
| Asian | 65.8 | 67.3 |
| NHOPI | 65.2 | 67.7 |
| AI/AN | 71.8 | 74.2 |
Right Chart:
| Sex | 2012 | 2013 |
|---|---|---|
| Total | 61.4 | 62.8 |
| Male | 67.7 | 68.8 |
| Female | 53.2 | 55.1 |
Key: NHOPI = Native Hawaiian or Other Pacific Islander; AI/AN = American Indian or Alaska Native.
Source: U.S. Renal Data System, 2012-2013. https://www.usrds.org/2015/view/v2_02.aspx ![]() .
.
Notes:
- Importance: Among hemodialysis patients, a usable arteriovenous fistula was associated with the lowest risk of death, infection, and cardiovascular events, compared with other types of vascular access (USRDS, 2015).
- Overall: In 2013, 62.8% of adult hemodialysis patients used arteriovenous fistulas as the primary mode of vascular access.
- Groups With Disparities:
- In 2013, 74.2% of AI/AN patients, 67.7% of NHOPI patients, 67.3% of Asian patients, 65.2% of White patients, and 57.8% of Black hemodialysis patients used arteriovenous fistulas as the primary mode of vascular access.
- In 2013, 68.8% of males and 55.1% of female hemodialysis patients used arteriovenous fistulas as the primary mode of vascular access.
Slide 50
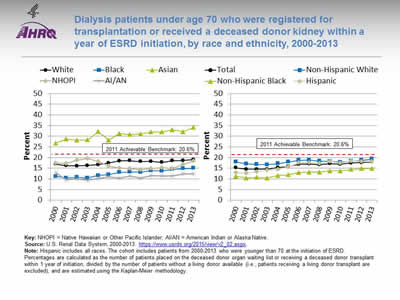
Dialysis patients under age 70 who were registered for transplantation or received a deceased donor kidney within a year of ESRD initiation, by race and ethnicity, 2000-2013
Image: Charts show dialysis patients under age 70 who were registered for transplantation or received a deceased donor kidney within a year of ESRD initiation:
Left Chart:
| Race | 2000 | 2001 | 2002 | 2003 | 2004 | 2005 | 2006 | 2007 | 2008 | 2009 | 2010 | 2011 | 2012 | 2013 |
|---|---|---|---|---|---|---|---|---|---|---|---|---|---|---|
| White | 17 | 16.2 | 16.1 | 16.3 | 16.7 | 17.5 | 18.4 | 18.5 | 18.1 | 18.2 | 17.8 | 18.5 | 18.6 | 19.0 |
| Black | 11.2 | 10.5 | 10.7 | 10.5 | 11.6 | 12.0 | 13.1 | 13.3 | 13.2 | 13.9 | 13.8 | 14.4 | 14.8 | 15.0 |
| Asian | 26.8 | 28.7 | 28.2 | 28.3 | 32.2 | 28.2 | 31.3 | 30.8 | 31.1 | 32.0 | 32.0 | 33.0 | 32.1 | 34.1 |
| AI/AN | 12.9 | 9.7 | 10.1 | 9.5 | 10.3 | 10.9 | 10.4 | 11.4 | 10.5 | 11.5 | 11.4 | 11.3 | 12.3 | 12.4 |
| NHOPI | 17.4 | 17.3 | 18.7 | 19.6 | 18.2 | 16.1 | 15.1 | 14.9 | 14.3 | 14.8 | 15.2 | 14.8 | 16.9 | 18.3 |
Right Chart:
| Race/Ethnicity | 2000 | 2001 | 2002 | 2003 | 2004 | 2005 | 2006 | 2007 | 2008 | 2009 | 2010 | 2011 | 2012 | 2013 |
|---|---|---|---|---|---|---|---|---|---|---|---|---|---|---|
| Total | 15.2 | 14.5 | 14.5 | 14.5 | 15.3 | 15.8 | 16.9 | 17 | 16.7 | 17.2 | 16.9 | 17.5 | 17.7 | 18 |
| Hispanic | 12.9 | 12.7 | 13.3 | 14.1 | 14.5 | 15.7 | 17.6 | 17.7 | 17.3 | 18.2 | 17.5 | 18.4 | 18.1 | 18.2 |
| Non-Hispanic Black | 11.2 | 10.5 | 10.7 | 10.5 | 11.6 | 11.9 | 13 | 13.2 | 13.2 | 13.8 | 13.8 | 14.4 | 14.8 | 14.9 |
| Non-Hispanic White | 18 | 17.1 | 16.8 | 16.7 | 17.2 | 18 | 18.7 | 18.8 | 18.3 | 18.2 | 17.9 | 18.3 | 18.7 | 19.3 |
2011 Achievable Benchmark: 20.6%.
Key: NHOPI = Native Hawaiian or Other Pacific Islander; AI/AN = American Indian or Alaska Native.
Source: U.S. Renal Data System, 2000-2013. https://www.usrds.org/2015/view/v2_02.aspx ![]() .
.
Notes: Hispanic includes all races. The cohort includes patients from 2000-2013 who were younger than 70 at the initiation of ESRD. Percentages are calculated as the number of patients placed on the deceased donor organ waiting list or receiving a deceased donor transplant within 1 year of initiation, divided by the number of patients without a living donor available (i.e., patients receiving a living donor transplant are excluded), and are estimated using the Kaplan-Meier methodology.
- Importance: Kidney transplantation is a renal replacement therapy that replaces the failing kidney with a healthy donor kidney. ESRD patients who receive a kidney transplant have lower mortality and hospitalization rates than those on dialysis. First-year all-cause mortality rates in hemodialysis patients, for example, are nearly five times higher than rates among transplant patients (USRDS, 2013b).
- Trends: From 2000 to 2013, the total percentage of dialysis patients under age 70 who were registered for transplantation within 1 year of progressing to ESRD increased from 15.2% to 18.0%.
- Groups With Disparities:
- In all years, Blacks and AI/ANs were less likely than Whites to be registered for transplantation within 1 year of progressing to ESRD. Asians were more likely than Whites to be registered.
- From 2000 to 2013, the percentage of dialysis patients registered for transplantation within 1 year of progressing to ESRD was lower for non-Hispanic Blacks than for non-Hispanic Whites and Hispanics.
- Achievable Benchmark:
- The 2011 top 5 State achievable benchmark for registration for transplantation within 1 year of progressing to ESRD was 20.6%. The top 5 States that contributed to the achievable benchmark are Colorado, Delaware, Minnesota, South Dakota, and Vermont.
- Hispanics could achieve the benchmark in 5 years, Whites in 8 years, and Blacks in 15 years. AI/ANs and NHOPIs are making no progress toward the benchmark.
- Asians have already surpassed the 2011 achievable benchmark.
Slide 51
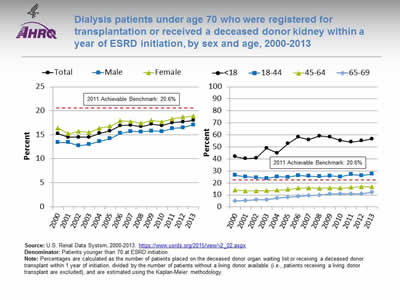
Dialysis patients under age 70 who were registered for transplantation or received a deceased donor kidney within a year of ESRD initiation, by sex and age, 2000-2013
Image: Charts show dialysis patients under age 70 who were registered for transplantation or received a deceased donor kidney within a year of ESRD initiation:
Left Chart:
| Sex | 2000 | 2001 | 2002 | 2003 | 2004 | 2005 | 2006 | 2007 | 2008 | 2009 | 2010 | 2011 | 2012 | 2013 |
|---|---|---|---|---|---|---|---|---|---|---|---|---|---|---|
| Total | 15.2 | 14.5 | 14.5 | 14.5 | 15.3 | 15.8 | 16.9 | 17 | 16.7 | 17.2 | 16.9 | 17.5 | 17.7 | 18 |
| Male | 13.4 | 13.4 | 12.7 | 13 | 13.6 | 14.2 | 15.3 | 15.7 | 15.6 | 15.8 | 15.7 | 16.3 | 16.5 | 17.1 |
| Female | 16.4 | 15.2 | 15.7 | 15.5 | 16.4 | 16.8 | 17.9 | 17.8 | 17.4 | 18.0 | 17.7 | 18.3 | 18.7 | 18.9 |
Right Chart:
| Age | 2000 | 2001 | 2002 | 2003 | 2004 | 2005 | 2006 | 2007 | 2008 | 2009 | 2010 | 2011 | 2012 | 2013 |
|---|---|---|---|---|---|---|---|---|---|---|---|---|---|---|
| <18 | 41.9 | 40.2 | 40.8 | 48.9 | 44.9 | 52.7 | 58.2 | 56 | 59.0 | 58.2 | 55.3 | 54 | 55.1 | 56.6 |
| 18-44 | 26.4 | 25.2 | 24.5 | 23.8 | 25.2 | 24.9 | 26.2 | 25.6 | 25.3 | 25.9 | 25.2 | 27 | 26.2 | 27.4 |
| 45-64 | 14.1 | 13.4 | 13.4 | 13.5 | 14 | 14.6 | 15.7 | 15.9 | 15.5 | 15.8 | 15.7 | 16.3 | 16.8 | 16.7 |
| 65-69 | 5 | 5.3 | 6 | 6.2 | 7.4 | 8 | 8.9 | 9.4 | 9.9 | 10.9 | 10.9 | 10.8 | 10.9 | 12.1 |
2011 Achievable Benchmark: 20.6%.
Source: U.S. Renal Data System, 2000-2013. https://www.usrds.org/2015/view/v2_02.aspx ![]() .
.
Denominator: Patients younger than 70 at ESRD initiation.
Notes: Percentages are calculated as the number of patients placed on the deceased donor organ waiting list or receiving a deceased donor transplant within 1 year of initiation, divided by the number of patients without a living donor available (i.e., patients receiving a living donor transplant are excluded), and are estimated using the Kaplan-Meier methodology.
- Importance: Kidney transplantation is a renal replacement therapy that replaces the failing kidney with a healthy donor kidney. ESRD patients who receive a kidney transplant have lower mortality and hospitalization rates than those on dialysis. First-year all-cause mortality rates in hemodialysis patients, for example, are nearly five times higher than rates among transplant patients (USRDS, 2013b).
- Groups With Disparities:
- In 2013, 18.9% of females and 17.1% of males were registered for transplantation within 1 year of progressing to ESRD.
- In all years, patients under age 18 years were more likely than patients ages 18-44 years, 45-64 years, and 65-69 years to be registered for transplantation within 1 year of progressing to ESRD.
- Achievable Benchmark:
- The 2011 top 5 State achievable benchmark for registration for transplantation within 1 year of progressing to ESRD was 20.6%. The top 5 States that contributed to the achievable benchmark are Colorado, Delaware, Minnesota, South Dakota, and Vermont.
- Patients ages 18 and under and 18-44 have already surpassed the 2011 achievable benchmark. Patients ages 45-64 and 65-69 could not achieve the benchmark for approximately 15 years.
- Female patients could achieve the benchmark in 6 years and males in 11 years.
Slide 52
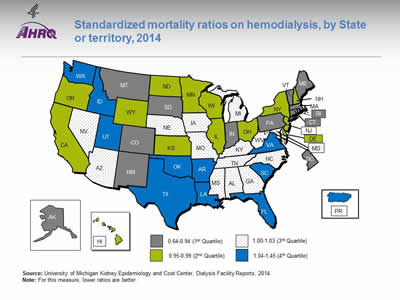
Standardized mortality ratios on hemodialysis, by State or territory, 2014
Image: Map of the United States is color-coded by state to show standardized mortality ratios on hemodialysis. States are divided into quartiles: First quartile, 0.64-0.94, AK, CO, CT, DC, IN, MA, ME, MT, NM, PA, RI, SD, VT; second quartile, 0.95-0.99, CA, DE, HI, IL, KS, MN, ND, NH, NY, OH, OR, WI, WY; third quartile, 1.00-1.03, AL, AZ, GA, IA, KY, MD, MO, MS, NC, NE, NV, TN, WV; fourth quartile, 1.04-1.45, AR, FL, ID, LA, OK, PR, SC, TX, UT, VA, WA.
Source: University of Michigan Kidney Epidemiology and Cost Center, Dialysis Facility Reports, 2014.
Notes: For this measure, lower ratios are better.
- Importance:
- Hemodialysis patient mortality varies across dialysis facilities and, correspondingly, across States.
- The standardized mortality ratio (SMR) is designed to summarize the observed death rate at a facility relative to the death rate that was expected based on national death rates during that year for patients with the same characteristics as those in a given facility.
- Geographic Variation:
- SMRs vary across U.S. States and territories, from a low in South Dakota to a high in Puerto Rico.
- South Dakota’s SMR of 0.64 indicates facility death rates that are typically 36% below the national death rate.
- Puerto Rico’s SMR of 1.45 indicates facility death rates that are 45% above the national death rate.
Slide 53
U.S. Renal Data System. USRDS 2013 annual data report: atlas of chronic kidney disease and end-stage renal disease in the United States. Bethesda, MD: National Institutes of Health, National Institute of Diabetes and Digestive and Kidney Diseases; 2013a. https://www.usrds.org/atlas13.aspx. Accessed August 19, 2016.
U.S. Renal Data System. USRDS 2013 annual data report reference tables. Bethesda, MD: National Institutes of Health, National Institute of Diabetes and Digestive and Kidney Diseases; 2013b. https://www.usrds.org/atlas13.aspx. Accessed August 19, 2016.
U.S. Renal Data System. USRDS 2015 annual data report reference tables. Bethesda, MD: National Institutes of Health, National Institute of Diabetes and Digestive and Kidney Diseases; 2015. https://www.usrds.org/2015/download/vol2_04_VascularAccess_15.pdf (3.35 MB) Accessed August 19, 2016.
Slide 54

National Healthcare Quality and Disparities Report
Chartbook on Effective Treatment
Diabetes
Slide 55
Measures of Effective Treatment of Diabetes
- Process:
- Receipt of four recommended diabetes services.
- People with current diabetes who have a written diabetes management plan.
- Outcome:
- Adults age 40 and over with diabetes who felt confident they could control and manage their diabetes.
- Hospital admissions for uncontrolled diabetes.
- New cases of end stage renal disease due to diabetes.
Slide 56
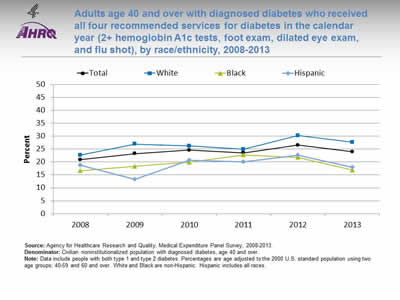
Adults age 40 and over with diagnosed diabetes who received all four recommended services for diabetes in the calendar year (2+ hemoglobin A1c tests, foot exam, dilated eye exam, and flu shot), by race/ethnicity, 2008-2013
Image: Chart shows adults age 40 and over with diagnosed diabetes who received all four recommended services for diabetes in the calendar year:
| Race/Ethnicity | 2008 | 2009 | 2010 | 2011 | 2012 | 2013 |
|---|---|---|---|---|---|---|
| Total | 21.0 | 23.2 | 24.6 | 23.6 | 26.6 | 24.0 |
| White | 22.7 | 26.9 | 26.2 | 25.0 | 30.3 | 27.7 |
| Black | 16.6 | 18.3 | 20.0 | 22.8 | 21.8 | 16.9 |
| Hispanic | 18.7 | 13.3 | 20.7 | 20.1 | 22.7 | 18.0 |
Source: Agency for Healthcare Research and Quality, Medical Expenditure Panel Survey, 2008-2013.
Denominator: Civilian noninstitutionalized population with diagnosed diabetes, age 40 and over.
Notes: Data include people with both type 1 and type 2 diabetes. Percentages are age adjusted to the 2000 U.S. standard population using two age groups: 40-59 and 60 and over. White and Black are non-Hispanic. Hispanic includes all races.
- Importance:
- Regular hemoglobin A1c (HbA1c) tests, foot exams, dilated eye exams, and flu shots help people keep their diabetes under control and avoid diabetic complications.
- A composite measure is used to track the national rate of receipt of all four of these recommended annual diabetes interventions.
- Trends: From 2008 to 2013, among adults age 40 and over with diagnosed diabetes, there were no statistically significant improvements overall or among any racial/ethnic groups.
- Groups With Disparities: In 3 of 6 years, including 2012 and 2013, Hispanics and Blacks were less likely than Whites to receive the recommended services.
Slide 57
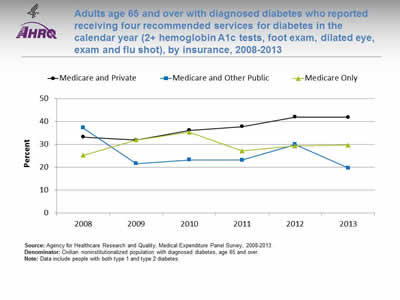
Adults age 65 and over with diagnosed diabetes who reported receiving four recommended services for diabetes in the calendar year (2+ hemoglobin A1c tests, foot exam, dilated eye, exam and flu shot), by insurance, 2008-2013
Image: Chart shows adults age 65 and over with diagnosed diabetes who reported receiving four recommended services for diabetes in the calendar year:
| Insurance | 2008 | 2009 | 2010 | 2011 | 2012 | 2013 |
|---|---|---|---|---|---|---|
| Medicare Only | 25.2 | 31.9 | 35.3 | 27.1 | 29.3 | 29.7 |
| Medicare and Private | 33.2 | 31.9 | 36.2 | 37.8 | 41.9 | 41.9 |
| Medicare and Other Public | 37.2 | 21.6 | 23.2 | 23.1 | 29.9 | 19.7 |
Source: Agency for Healthcare Research and Quality, Medical Expenditure Panel Survey, 2008-2013.
Denominator: Civilian noninstitutionalized population with diagnosed diabetes, age 65 and over.
Notes: Data include people with both type 1 and type 2 diabetes.
- Importance: Diabetes prevalence increases with age, so monitoring older adults is important.
- Trends: From 2008 to 2013, improvement was observed for adults with Medicare and private insurance.
- Groups With Disparities:
- In the last 4 years, among adults age 65 and over, those with Medicare and other public insurance were less likely than those with Medicare and private insurance to receive all four recommended services.
- In the last 3 years, among adults age 65 and over, those with Medicare only were less likely than those with Medicare and private insurance to receive all four recommended services.
- Between 2008 and 2013, among adults age 65 and over, the gap between those with Medicare and private insurance and Medicare only grew, indicating worsening disparities.
- Between 2008 and 2013, among adults age 65 and over, the gap between those with Medicare and private insurance and Medicare and public insurance grew, indicating worsening disparities.
Slide 58
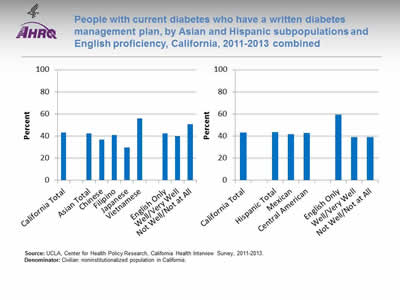
People with current diabetes who have a written diabetes management plan, by Asian and Hispanic subpopulations and English proficiency, California, 2011-2013 combined
Image: Charts show people with current diabetes who have a written diabetes management plan, by Asian and Hispanic subpopulations and English proficiency for California:
Left Chart:
- California Total - 43.2.
- Ethnicity:
- Asian Total - 42.3.
- Chinese - 36.9.
- Filipino - 40.8.
- Japanese - 29.7.
- Vietnamese - 55.9.
- English proficiency:
- English Only - 42.3.
- Well/Very Well - 39.8.
- Not Well/Not at All - 50.6.
Right Chart:
- California Total - 43.2.
- Ethnicity:
- Hispanic Total - 43.3.
- Mexican - 41.6.
- Central American - 42.9.
- English proficiency:
- English Only - 59.4.
- Well/Very Well - 38.9.
- Not Well/Not at All - 39.
Source: UCLA, Center for Health Policy Research, California Health Interview Survey, 2011-2013.
Denominator: Civilian noninstitutionalized population in California.
Notes:
- Importance:
- Self-care and perceived confidence to take action to manage chronic illness and to maintain such skills over time have been shown to be associated with better health outcomes (Ludman, et al., 2013).
- A successful partnership for diabetes care requires providers to educate patients about daily management of their diabetes. Thus, providers should develop a written diabetes management plan, especially for patients with a history of uncontrolled diabetes.
- National data on diabetes management and outcomes for some underserved populations are not available from the national data sources in the QDR. These populations include people with limited English proficiency; individuals who speak a language other than English at home; lesbian, gay, bisexual, and transgender individuals; and Asian and Hispanic subpopulations. To address some of these data gaps, we show additional data from the California Health Interview Survey.
- Overall Rate: Only 43.2% of Californians with current diabetes had a written diabetes management plan in 2011-2013.
- Groups With Disparities:
- Among Asian Californians with diabetes, the percentage who had a written diabetes management plan was 29.7% for Japanese, 36.9% for Chinese, 40.8% for Filipino, and 55.9% for Vietnamese people.
- Among Hispanic Californians with diabetes, those who spoke English well/very well and those who did not speak English well or at all were less likely than those who spoke English only to have a written diabetes management plan.
Slide 59
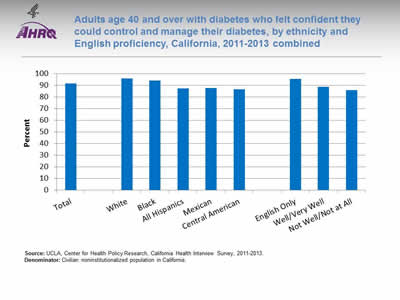
Adults age 40 and over with diabetes who felt confident they could control and manage their diabetes, by ethnicity and English proficiency, California, 2011-2013 combined
Image: Chart shows adults age 40 and over with diabetes who felt confident they could control and manage their diabetes:
- Total - 91.7.
- Race/Ethnicity:
- White - 95.9.
- Black - 94.2.
- All Hispanics - 87.4.
- Mexican - 87.8.
- Central American - 86.9.
- English proficiency:
- English Only - 95.5.
- Well/Very Well - 88.9.
- Not Well/Not at All - 86.1.
Source: UCLA, Center for Health Policy Research, California Health Interview Survey, 2011-2013.
Denominator: Civilian noninstitutionalized population in California.
Notes:
- Importance: Self-care and perceived confidence in taking action to manage chronic illness and maintain such skills over time have been shown to be associated with better health outcomes (Ludman, et al., 2013).
- Overall Rate: In 2011-2013, 91.7% of California adults age 40 and over with diagnosed diabetes felt confident that they could control and manage their diabetes.
- Groups With Disparities:
- In 2011-2013, Hispanics of all races, Mexicans, and Central Americans were less likely than Whites to report that they felt confident they could control and manage their diabetes.
- California adults who spoke English well or very well and adults who did not speak English well or at all were less likely than adults who spoke only English to report that they felt confident they could control and manage their diabetes.
Slide 60
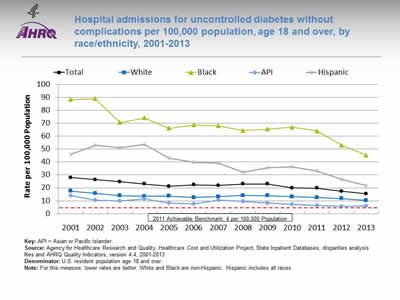
Hospital admissions for uncontrolled diabetes without complications per 100,000 population, age 18 and over, by race/ethnicity, 2001-2013
Image: Chart shows hospital admissions for uncontrolled diabetes without complications per 100,000 population:
| Race/Ethnicity | 2001 | 2002 | 2003 | 2004 | 2005 | 2006 | 2007 | 2008 | 2009 | 2010 | 2011 | 2012 | 2013 |
|---|---|---|---|---|---|---|---|---|---|---|---|---|---|
| Total | 27.9 | 26.4 | 24.8 | 23.0 | 21.2 | 22.4 | 21.8 | 23.0 | 22.9 | 20.0 | 19.8 | 17.3 | 15.4 |
| White | 17.6 | 15.8 | 14.0 | 13.5 | 13.6 | 12.6 | 13.2 | 14.1 | 14.0 | 13.1 | 12.4 | 11.7 | 10.3 |
| Black | 88.3 | 89.1 | 70.6 | 74.2 | 66.1 | 68.7 | 68.1 | 64.4 | 65.5 | 66.9 | 64.0 | 53.1 | 45.3 |
| API | 14.2 | 10.4 | 9.9 | 11.3 | 8.3 | 7.7 | 10.6 | 9.6 | 8.2 | 7.3 | 6.2 | 5.5 | 5.9 |
| Hispanic | 46.0 | 52.9 | 51.1 | 53.8 | 42.9 | 39.8 | 39.3 | 32.2 | 35.8 | 36.4 | 33.1 | 26.7 | 21.7 |
2011 Achievable Benchmark: 4 per 100,000 Population.
Key: API = Asian or Pacific Islander.
Source: Agency for Healthcare Research and Quality, Healthcare Cost and Utilization Project, State Inpatient Databases, disparities analysis files and AHRQ Quality Indicators, version 4.4, 2001-2013.
Denominator: U.S. resident population age 18 and over.
Notes: For this measure, lower rates are better. White and Black are non-Hispanic. Hispanic includes all races.
- Importance: Individuals who do not achieve good control of their diabetes may develop symptoms that require correction through hospitalization. Admission rates for uncontrolled diabetes may be reduced by better outpatient treatment and patients’ tighter adherence to the recommended diet and medication.
- Trends:
- The rate of hospital admissions for uncontrolled diabetes without complications per 100,000 population decreased from 27.9% in 2001 to 15.4% in 2013.
- From 2001 to 2013, the percentage of hospital admissions decreased for all populations:
- For Whites, from 17.6% to 10.3%.
- For Blacks, from 88.3% to 45.3%.
- For APIs, from 14.2% to 5.9%.
- For Hispanics, from 46.0% to 21.7%.
- Groups With Disparities: In all years, the rate of hospital admissions for uncontrolled diabetes was higher for Blacks and Hispanics and lower for Asians and Pacific Islanders (APIs) compared with Whites.
- Achievable Benchmark:
- The 2011 top 4 State achievable benchmark was 4 admissions per 100,000 population age 18 and over. The top 4 States that contributed to the achievable benchmark are Maine, Montana, Utah, and Vermont.
- At the current rate, the benchmark would not be met for the total population, Whites, and Blacks for approximately 15 years.
- APIs could reach the benchmark in 3 years and Hispanics in 7 years.
Slide 61
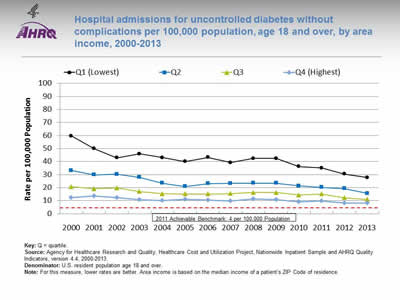
Hospital admissions for uncontrolled diabetes without complications per 100,000 population, age 18 and over, by area income, 2000-2013
Image: Chart shows hospital admissions for uncontrolled diabetes without complications per 100,000 population:
| Area Income | 2000 | 2001 | 2002 | 2003 | 2004 | 2005 | 2006 | 2007 | 2008 | 2009 | 2010 | 2011 | 2012 | 2013 |
|---|---|---|---|---|---|---|---|---|---|---|---|---|---|---|
| Q1 (Lowest) | 59.6 | 49.9 | 43.0 | 45.9 | 43.1 | 40.0 | 43.3 | 39.2 | 42.4 | 42.5 | 36.2 | 35.1 | 30.5 | 27.8 |
| Q2 | 33.2 | 29.9 | 30.3 | 27.9 | 23.5 | 20.9 | 23.1 | 23.2 | 23.4 | 23.5 | 21.3 | 20.3 | 19.2 | 15.6 |
| Q3 | 20.7 | 19.1 | 19.7 | 17.0 | 15.3 | 15.1 | 15.1 | 15.5 | 16.2 | 16.3 | 14.4 | 15.1 | 12.2 | 11.0 |
| Q4 (Highest) | 12.4 | 13.7 | 12.2 | 10.7 | 10.1 | 11.2 | 10.3 | 9.7 | 11.5 | 10.8 | 9.2 | 9.9 | 8.3 | 8.2 |
2011 Achievable Benchmark: 4 per 100,000 Population.
Key: Q = quartile.
Source: Agency for Healthcare Research and Quality, Healthcare Cost and Utilization Project, Nationwide Inpatient Sample and AHRQ Quality Indicators, version 4.4, 2000-2013.
Denominator: U.S. resident population age 18 and over.
Notes: For this measure, lower rates are better. Area income is based on the median income of a patient’s ZIP Code of residence.
- Importance: Low-income neighborhoods may have insufficient health resources to meet the needs of all people with diabetes.
- Trends: From 2000 to 2013, the rates showed improvement for all income populations.
- Groups With Disparities:
- In all years, the rate of hospital admissions for uncontrolled diabetes was higher for residents of the lowest, second, and third income quartiles than for residents of the highest income quartile.
- Achievable Benchmark:
- The 2011 top 4 State achievable benchmark was 4 admissions per 100,000 population age 18 and over. The top 4 States that contributed to the achievable benchmark are Maine, Montana, Utah, and Vermont.
- At the current rates of improvement:
- Residents of the lowest income quartile could achieve the benchmark in less than 14 years.
- Residents of the second income quartile could achieve the benchmark in 11 years.
- Residents of the third income quartile could achieve the benchmark in less than 12 years.
- Residents of the highest income quartile could achieve the benchmark in less than 13 years.
Slide 62
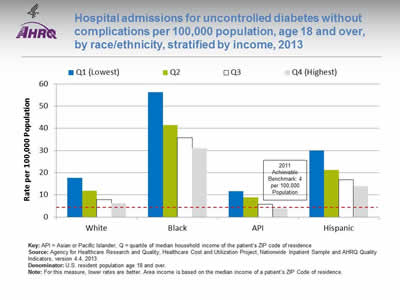
Hospital admissions for uncontrolled diabetes without complications per 100,000 population, age 18 and over, by race/ethnicity, stratified by income, 2013
Image: Chart shows hospital admissions for uncontrolled diabetes without complications per 100,000 population:
| Race/Ethnicity | Q1 (Lowest) | Q2 | Q3 | Q4 (Highest) |
|---|---|---|---|---|
| White | 17.7 | 11.8 | 7.9 | 6.3 |
| Black | 56.2 | 41.4 | 35.7 | 30.9 |
| API | 11.6 | 8.8 | 5.7 | 3.7 |
| Hispanic | 30 | 21.3 | 16.8 | 13.9 |
2011 Achievable Benchmark: 4 per 100,000 Population.
Key: API = Asian or Pacific Islander; Q = quartile of median household income of the patient’s ZIP code of residence.
Source: Agency for Healthcare Research and Quality, Healthcare Cost and Utilization Project, Nationwide Inpatient Sample and AHRQ Quality Indicators, version 4.4, 2013.
Denominator: U.S. resident population age 18 and over.
Notes: For this measure, lower rates are better. Area income is based on the median income of a patient’s ZIP Code of residence.
- Importance: Low-income neighborhoods may have insufficient health resources to meet the needs of all people with diabetes.
- Groups With Disparities:
- In 2013, the rate of hospital admissions for uncontrolled diabetes was higher for Black and Hispanic residents than for White residents in all income quartiles.
- Black residents in the highest quartile had higher rates of hospital admissions for uncontrolled diabetes than White residents in the lowest income quartile.
- Achievable Benchmark:
- The 2011 top 4 State achievable benchmark was 4 admissions per 100,000 population age 18 and over. The top 4 States that contributed to the achievable benchmark are Maine, Montana, Utah, and Vermont.
- The only group to achieve the benchmark was API residents in the highest income quartile.
Slide 63
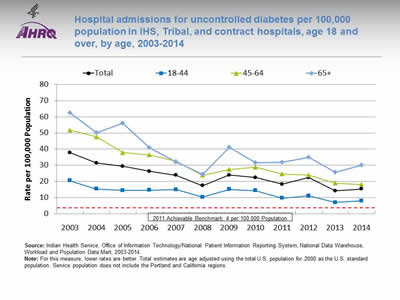
Hospital admissions for uncontrolled diabetes per 100,000 population in IHS, Tribal, and contract hospitals, age 18 and over, by age, 2003-2014
Image: Chart shows hospital admissions for uncontrolled diabetes per 100,000 population in IHS, Tribal, and contract hospitals:
| Age | 2003 | 2004 | 2005 | 2006 | 2007 | 2008 | 2009 | 2010 | 2011 | 2012 | 2013 | 2014 |
|---|---|---|---|---|---|---|---|---|---|---|---|---|
| Total | 37.8 | 31.4 | 29.3 | 26.3 | 23.8 | 17.3 | 23.9 | 22.4 | 18.3 | 22.4 | 14.2 | 15.3 |
| 18-44 | 20.5 | 15.3 | 14.4 | 14.5 | 14.9 | 10.3 | 15.1 | 14.3 | 9.6 | 11.0 | 6.9 | 7.9 |
| 45-64 | 51.7 | 47.7 | 37.8 | 36.5 | 32.6 | 23.8 | 27.4 | 28.8 | 24.6 | 23.9 | 18.9 | 18.2 |
| 65+ | 62.5 | 50.1 | 56.2 | 40.9 | 32.2 | 24.5 | 41.1 | 31.7 | 31.9 | 35.0 | 25.6 | 30.1 |
2011 Achievable Benchmark: 4 per 100,000 Population.
Source: Indian Health Service, Office of Information Technology/National Patient Information Reporting System, National Data Warehouse, Workload and Population Data Mart, 2003-2014.
Notes: For this measure, lower rates are better. Total estimates are age adjusted using the total U.S. population for 2000 as the U.S. standard population. Service population does not include the Portland and California regions.
- Importance:
- Diabetes is one of the leading causes of morbidity and mortality among American Indian and Alaska Native (AI/AN) populations. Its prevention and control are a major focus of the Indian Health Service (IHS) Director’s Chronic Disease Initiative and the IHS Health Promotion/Disease Prevention Initiative. Addressing barriers to health care is a large part of the overall IHS goal of ensuring that comprehensive, culturally acceptable personal and public health services are available and accessible to AI/ANs.
- AI/ANs who are members of federally recognized Tribes are eligible for services provided by IHS. About 2 million AI/ANs in the United States receive care directly from IHS, through tribally contracted and operated health programs or through services purchased by IHS from other providers. Due to low numbers and lack of data, information about AI/AN hospitalizations is difficult to obtain in most Federal and State hospital utilization data sources. The QDR addresses this gap by examining utilization data from IHS, Tribal, and contract hospitals.
- Trends: From 2003 to 2014, the age-adjusted rate of hospitalizations for uncontrolled diabetes in IHS, Tribal, and contract hospitals decreased overall and among all age groups.
- Groups With Disparities: In all years, patients ages 18-44 had lower rates than patients ages 45-64 and 65 and over.
- Achievable Benchmark:
- The 2011 top 4 State achievable benchmark was 4 admissions per 100,000 population age 18 and over. The top 4 States that contributed to the achievable benchmark are Maine, Montana, Utah, and Vermont.
- At the current rates, the benchmark could be met overall in 7 years, by patients ages 18-44 in 4 years, ages 45-64 in 5 years, and age 65 and over in 10 years.
Slide 64
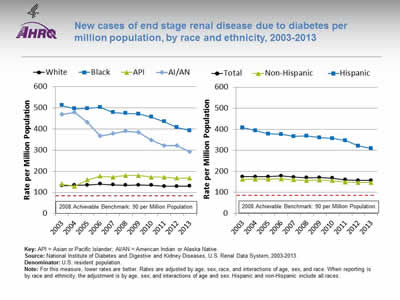
New cases of end stage renal disease due to diabetes per million population, by race and ethnicity, 2003-2013
Image: Charts show new cases of end stage renal disease due to diabetes per million population:
Left Chart:
| Race | 2003 | 2004 | 2005 | 2006 | 2007 | 2008 | 2009 | 2010 | 2011 | 2012 | 2013 |
|---|---|---|---|---|---|---|---|---|---|---|---|
| White | 132.2 | 134.2 | 135.1 | 139.6 | 136.3 | 134.0 | 135.0 | 134.4 | 129.1 | 128.8 | 130.0 |
| Black | 511.2 | 496.4 | 497.1 | 502.9 | 478.5 | 474.2 | 471.4 | 456.9 | 435.4 | 407.2 | 392.7 |
| AI/AN | 469.3 | 478.9 | 431.1 | 366.4 | 378.8 | 391.1 | 384.3 | 347.5 | 321.5 | 320.9 | 291.6 |
| API | 139.7 | 128.9 | 159.7 | 177.2 | 172.7 | 179.7 | 180.0 | 172.3 | 172.4 | 167.5 | 167.9 |
Right Chart:
| Ethnicity | 2003 | 2004 | 2005 | 2006 | 2007 | 2008 | 2009 | 2010 | 2011 | 2012 | 2013 |
|---|---|---|---|---|---|---|---|---|---|---|---|
| Total | 174.4 | 174.2 | 174.2 | 177.6 | 171.7 | 169.1 | 169.6 | 166.9 | 159.5 | 156.4 | 155.9 |
| Hispanic | 407.5 | 393.8 | 377.7 | 375.5 | 366.2 | 367.7 | 359.8 | 355.8 | 346.1 | 320.5 | 308.2 |
| Non-Hispanic | 161.3 | 162.1 | 162.0 | 164.4 | 158.9 | 156.5 | 157.8 | 155.2 | 148.1 | 146.4 | 146.8 |
2008 Achievable Benchmark: 90 per Million Population.
Key: API = Asian or Pacific Islander; AI/AN = American Indian or Alaska Native.
Source: National Institute of Diabetes and Digestive and Kidney Diseases, U.S. Renal Data System, 2003-2013.
Denominator: U.S. resident population.
Notes: For this measure, lower rates are better. Rates are adjusted by age, sex, race, and interactions of age, sex, and race. When reporting is by race and ethnicity, the adjustment is by age, sex, and interactions of age and sex. Hispanic and non-Hispanic include all races.
- Importance: Diabetes is the most common cause of kidney failure. Keeping blood glucose levels under control can prevent or slow the progression of kidney disease. When kidney disease is detected early, medication can slow the disease’s progress; when detected late, it commonly progresses to end stage renal disease (ESRD) requiring dialysis or kidney transplantation. While some cases of kidney failure due to diabetes cannot be avoided, other cases reflect inadequate control of blood glucose or delayed detection and treatment of early kidney disease due to diabetes.
- Trends: From 2003 to 2013, the overall rate of new cases of ESRD due to diabetes improved from 174.4 to 155.9 per million population. Hispanics improved from 407.5 to 308.2, Blacks improved from 511.2 to 392.7, and AI/ANs improved from 469.3 to 291.6 per million population.
- Groups With Disparities: In all years, Blacks and AI/ANs had higher rates than Whites, and Hispanics had higher rates than non-Hispanics.
- Achievable Benchmark:
- The 2008 top 5 State achievable benchmark was 90 per million population. The top 5 States that contributed to the achievable benchmark are Alaska, Maine, New Hampshire, Rhode Island, and Vermont.
- At current rates of change, the benchmark would not be achieved overall or by any racial or ethnic group for decades.
Slide 65
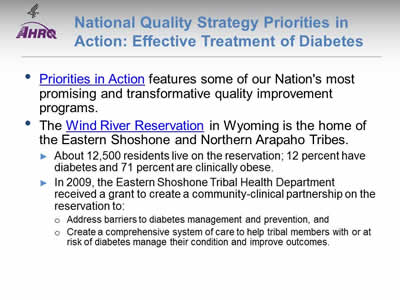
National Quality Strategy Priorities in Action: Effective Treatment of Diabetes
- Priorities in Action features some of our Nation's most promising and transformative quality improvement programs.
- The Wind River Reservation in Wyoming is the home of the Eastern Shoshone and Northern Arapaho Tribes.
- The reservation is in the heart of the Northern Plains in southwestern Wyoming.
- About 12,500 residents live on the reservation; 12 percent have diabetes and 71 percent are clinically obese.
- In 2009, the Eastern Shoshone Tribal Health Department received a grant to create a community-clinical partnership on the reservation to:
- Address barriers to diabetes management and prevention.
- Create a comprehensive system of care to help tribal members with or at risk of diabetes manage their condition and improve outcomes.
- The 5-year grant was in partnership with the Northern Arapaho Tribe, Indian Health Service, and Sundance Research Institute.
- The system of care included education and support services.
Slide 66
Reference
Ludman EJ, Peterson D, Katon WJ, et al. Improving confidence for self care in patients with depression and chronic illnesses. Behav Med 2013;391(1):1-6. https://www.ncbi.nlm.nih.gov/pmc/articles/PMC3628828/. Accessed August 29, 2016.
Slide 67

National Healthcare Quality and Disparities Report
Chartbook on Effective Treatment
HIV and AIDS
Slide 68
Overview
- HIV is a virus that kills or damages cells of the body’s immune system.
- AIDS is the most advanced stage of HIV infection.
- HIV can be spread through:
- Any unprotected sex with an infected person.
- Sharing of drug needles with an infected person.
- Contact with the blood of an infected person.
- Women can pass the virus to their babies during pregnancy, childbirth, or breastfeeding.
Note:
- For more information: http://www.cdc.gov/hiv/statistics/basics/ataglance.html.
Slide 69
Impact of HIV and AIDS
- The impact of HIV and AIDS is disproportionately higher for:
- Racial and ethnic minorities.
- People of lower income or education levels.
- Other vulnerable populations with high-risk behaviors, such as, men who have sex with men (MSM) and transgender people.
Slide 70
Access to Care for HIV and AIDS
- Although access to care has improved, several groups of people living with HIV remain less likely to have access to care and less likely to have optimal patterns of care:
- Blacks and Hispanics.
- Women.
- Injection drug users.
- Homeless people.
- Uninsured people (Colasanti, et al., 2016; Horberg, 2015; Moore, 2011).
Slide 71
Prevalence and Incidence of HIV Infection
- The Centers for Disease Control and Prevention estimates that:
- More than 1.2 million people age 13 years and over are living with HIV.
- About 13.0% of people living with HIV are unaware of their infection.
- From 2005 to 2014, the annual number of new HIV diagnoses declined by 19%, however the progress is uneven across different groups.
- The rate of new infections is high among certain groups, such as MSM and transgender people.
Note:
- For more information: http://www.cdc.gov/hiv/statistics/basics/ataglance.html.
Slide 72
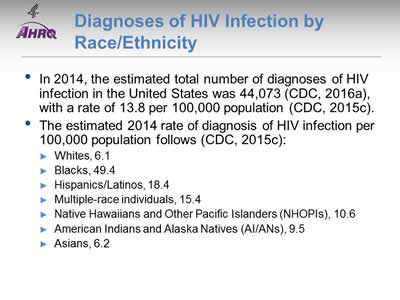
Diagnoses of HIV Infection by Race/Ethnicity
- In 2014, the estimated total number of diagnoses of HIV infection in the United States was 44,073 (CDC, 2016a), with a rate of 13.8 per 100,000 population (CDC, 2015c).
- The estimated 2014 rate of diagnosis of HIV infection per 100,000 population follows (CDC, 2015c):
- Whites, 6.1.
- Blacks, 49.4.
- Hispanics/Latinos, 18.4.
- Multiple-race individuals, 15.4.
- Native Hawaiians and Other Pacific Islanders (NHOPIs), 10.6.
- American Indians and Alaska Natives (AI/ANs), 9.5.
- Asians, 6.2.
Slide 73
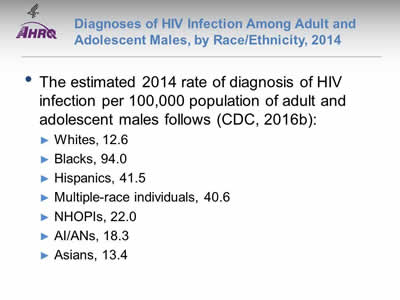
Diagnoses of HIV Infection Among Adult and Adolescent Males, by Race/Ethnicity, 2014
- The estimated 2014 rate of diagnosis of HIV infection per 100,000 population of adult and adolescent males follows (CDC, 2016b):
- Whites, 12.6.
- Blacks, 94.0.
- Hispanics, 41.5.
- Multiple-race individuals, 40.6.
- NHOPIs, 22.0.
- AI/ANs, 18.3.
- Asians, 13.4.
Slide 74
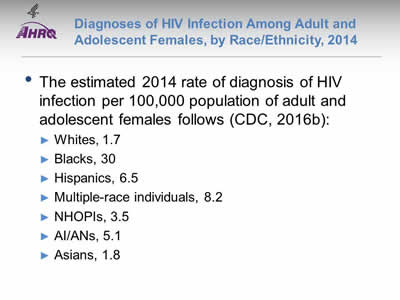
Diagnoses of HIV Infection Among Adult and Adolescent Females, by Race/Ethnicity, 2014
- The estimated 2014 rate of diagnosis of HIV infection per 100,000 population of adult and adolescent females follows (CDC, 2016b):
- Whites, 1.7.
- Blacks, 30.
- Hispanics, 6.5.
- Multiple-race individuals, 8.2.
- NHOPIs, 3.5.
- AI/ANs, 5.1.
- Asians, 1.8.
Slide 75
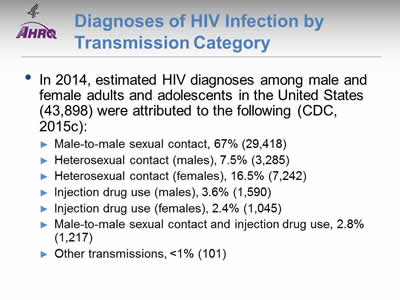
Diagnoses of HIV Infection by Transmission Category
- In 2014, estimated HIV diagnoses among male and female adults and adolescents in the United States (43,898) were attributed to the following (CDC, 2015c):
- Male-to-male sexual contact, 67% (29,418).
- Heterosexual contact (males), 7.5% (3,285).
- Heterosexual contact (females), 16.5% (7,242).
- Injection drug use (males), 3.6% (1,590).
- Injection drug use (females), 2.4% (1,045).
- Male-to-male sexual contact and injection drug use, 2.8% (1,217).
- Other transmissions, <1% (101).
Note:
- The estimated HIV diagnoses among male and female adults and adolescents excludes children under age 13.
Slide 76
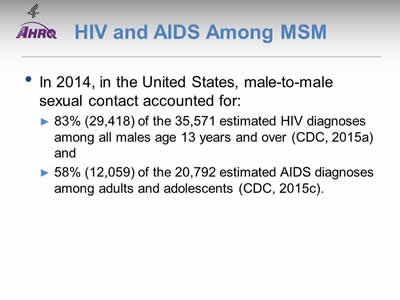
HIV and AIDS Among MSM
- In 2014, in the United States, male-to-male sexual contact accounted for:
- 83% (29,418) of the 35,571 estimated HIV diagnoses among all males age 13 years and over (CDC, 2015a).
- 58% (12,059) of the 20,792 estimated AIDS diagnoses among adults and adolescents (CDC, 2015c).
Notes:
- Gay, bisexual, and other men who have sex with men represent only 2% of the U.S. population but account for 55% of people living with HIV in the United States:
- From 2005 to 2014, HIV diagnoses decreased in the United States by 19% overall but increased by 6% among all gay and bisexual men, which was driven by increases among African American and Hispanic/Latino gay and bisexual men.
- In the same timeframe, increases in HIV diagnoses among all gay and bisexual men was less than 1%, although progress is different among racial/ethnic groups (CDC, 2015a).
Slide 77
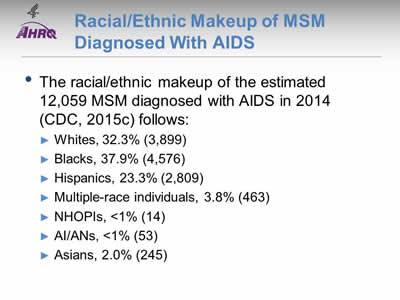
Racial/Ethnic Makeup of MSM Diagnosed With AIDS
- The racial/ethnic makeup of the estimated 12,059 MSM diagnosed with AIDS in 2014 (CDC, 2015c) follows:
- Whites, 32.3% (3,899).
- Blacks, 37.9% (4,576).
- Hispanics, 23.3% (2,809).
- Multiple-race individuals, 3.8% (463).
- NHOPIs, <1% (14).
- AI/ANs, <1% (53).
- Asians, 2.0% (245).
Slide 78
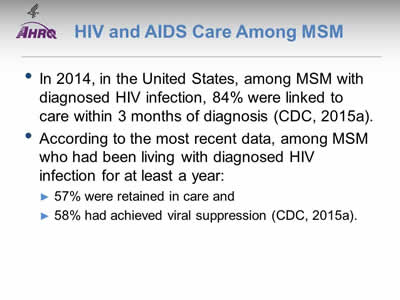
HIV and AIDS Care Among MSM
- In 2014, in the United States, among MSM with diagnosed HIV infection, 84% were linked to care within 3 months of diagnosis (CDC, 2015a).
- According to the most recent data, among MSM who had been living with diagnosed HIV infection for at least a year:
- 57% were retained in care.
- 58% had achieved viral suppression (CDC, 2015a).
Note:
- For more information: http://www.cdc.gov/hiv/group/msm/index.html.
Slide 79
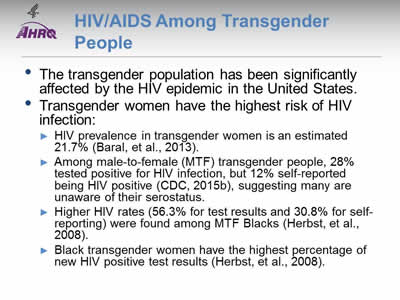
HIV/AIDS Among Transgender People
- The transgender population has been significantly affected by the HIV epidemic in the United States.
- Transgender women have the highest risk of HIV infection:
- HIV prevalence in transgender women is an estimated 21.7% (Baral, et al., 2013).
- Among male-to-female (MTF) transgender people, 28% tested positive for HIV infection, but 12% self-reported being HIV positive (CDC, 2015b), suggesting many are unaware of their serostatus.
- Higher HIV rates (56.3% for test results and 30.8% for self-reporting) were found among MTF Blacks (Herbst, et al., 2008).
- Black transgender women have the highest percentage of new HIV positive test results (Herbst, et al., 2008).
Note:
- For more information: http://www.cdc.gov/hiv/group/gender/transgender/index.html.
Slide 80
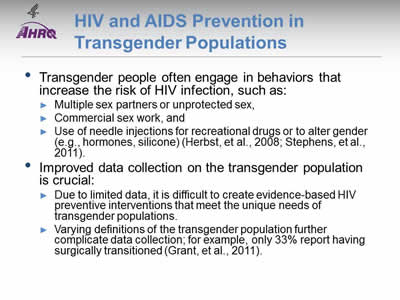
HIV and AIDS Prevention in Transgender Populations
- Transgender people often engage in behaviors that increase the risk of HIV infection, such as:
- Multiple sex partners or unprotected sex.
- Commercial sex work.
- Use of needle injections for recreational drugs or to alter gender (e.g., hormones, silicone) (Herbst, et al., 2008; Stephens, et al., 2011).
- Improved data collection on the transgender population is crucial:
- Due to limited data, it is difficult to create evidence-based HIV preventive interventions that meet the unique needs of transgender populations.
- Varying definitions of the transgender population further complicate data collection; for example, only 33% report having surgically transitioned (Grant, et al., 2011).
Note:
- For more information: http://www.cdc.gov/hiv/risk/transgender/index.html.
Slide 81
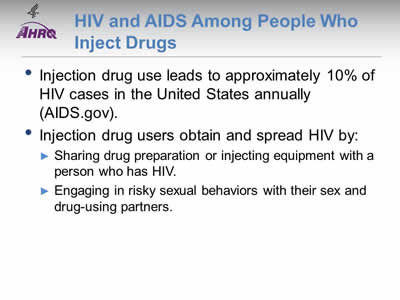
HIV and AIDS Among People Who Inject Drugs
- Injection drug use leads to approximately 10% of HIV cases in the United States annually (AIDS.gov).
- Injection drug users obtain and spread HIV by:
- Sharing drug preparation or injecting equipment with a person who has HIV.
- Engaging in risky sexual behaviors with their sex and drug-using partners.
Note:
- For more information: https://www.aids.gov/hiv-aids-basics/prevention/reduce-your-risk/substance-abuse-use/.
Slide 82
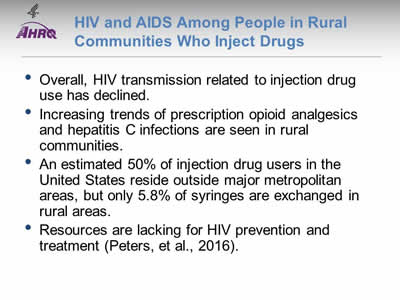
HIV and AIDS Among People in Rural Communities Who Inject Drugs
- Overall, HIV transmission related to injection drug use has declined.
- Increasing trends of prescription opioid analgesics and hepatitis C infections are seen in rural communities.
- An estimated 50% of injection drug users in the United States reside outside major metropolitan areas, but only 5.8% of syringes are exchanged in rural areas.
- Resources are lacking for HIV prevention and treatment (Peters, et al., 2016).
Note:
- For more information: https://www.aids.gov/hiv-aids-basics/prevention/reduce-your-risk/substance-abuse-use/.
Slide 83
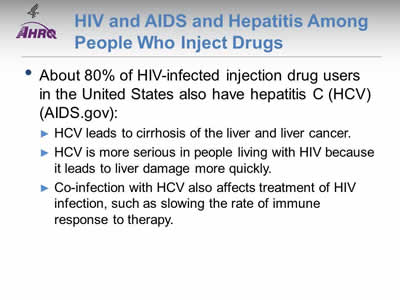
HIV and AIDS and Hepatitis Among People Who Inject Drugs
- About 80% of HIV-infected injection drug users in the United States also have hepatitis C (HCV) (AIDS.gov):
- HCV leads to cirrhosis of the liver and liver cancer.
- HCV is more serious in people living with HIV because it leads to liver damage more quickly.
- Co-infection with HCV also affects treatment of HIV infection, such as slowing the rate of immune response to therapy.
Note:
- For more information: https://www.aids.gov/hiv-aids-basics/prevention/reduce-your-risk/substance-abuse-use/.
Slide 84
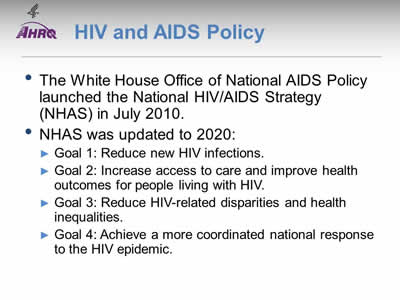
HIV and AIDS Policy
- The White House Office of National AIDS Policy launched the National HIV/AIDS Strategy (NHAS) in July 2010.
- NHAS was updated to 2020:
- Goal 1: Reduce new HIV infections.
- Goal 2: Increase access to care and improve health outcomes for people living with HIV.
- Goal 3: Reduce HIV-related disparities and health inequalities.
- Goal 4: Achieve a more coordinated national response to the HIV epidemic.
Note:
- For more information: https://www.aids.gov/federal-resources/national-hiv-aids-strategy/nhas-update.pdf (2.23 MB).
Slide 85
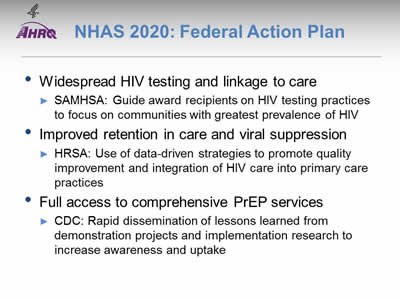
NHAS 2020: Federal Action Plan
- Widespread HIV testing and linkage to care:
- SAMHSA: Guide award recipients on HIV testing practices to focus on communities with greatest prevalence of HIV.
- Improved retention in care and viral suppression:
- HRSA: Use of data-driven strategies to promote quality improvement and integration of HIV care into primary care practices.
- Full access to comprehensive PrEP services:
- CDC: Rapid dissemination of lessons learned from demonstration projects and implementation research to increase awareness and uptake.
Note:
- For more information: https://www.whitehouse.gov/sites/default/files/docs/nhas_2020_federal_action_plan_2016-2020.pdf (580.92 KB).
Slide 86
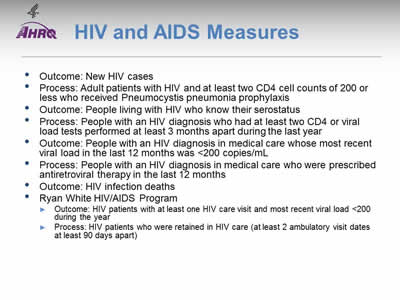
HIV and AIDS Measures
- Outcome: New HIV cases.
- Process: Adult patients with HIV and at least two CD4 cell counts of 200 or less who received Pneumocystis pneumonia prophylaxis.
- Outcome: People living with HIV who know their serostatus.
- Process: People with an HIV diagnosis who had at least two CD4 or viral load tests performed at least 3 months apart during the last year.
- Outcome: People with an HIV diagnosis in medical care whose most recent viral load in the last 12 months was <200 copies/mL.
- Process: People with an HIV diagnosis in medical care who were prescribed antiretroviral therapy in the last 12 months.
- Outcome: HIV infection deaths.
- Ryan White HIV/AIDS Program:
- Outcome: HIV patients with at least one HIV care visit and most recent viral load <200 during the year.
- Process: HIV patients who were retained in HIV care (at least 2 ambulatory visit dates at least 90 days apart).
Slide 87
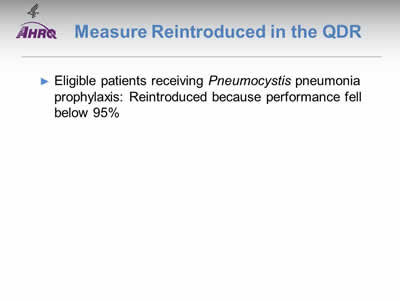
Measure Reintroduced in the QDR
- Eligible patients receiving Pneumocystis pneumonia prophylaxis: Reintroduced because performance fell below 95%.
Note:
- Measures that reach performance levels of 95% are no longer reported. Data on these measures will continue to be collected and these measures will be added back to the reports if their performance falls below 95%. Select for more information.
Slide 88

New HIV cases per 100,000 population age 13 and over, by race/ethnicity and sex, United States, 2008-2013
Image: Charts show new HIV cases per 100,000 population age 13 and over:
Left Chart:
| Race/Ethnicity | 2008 | 2009 | 2010 | 2011 | 2012 | 2013 |
|---|---|---|---|---|---|---|
| White | 7.9 | 7.5 | 7.2 | 7.0 | 7.2 | 7.7 |
| Black | 78.0 | 72.5 | 68.4 | 65.4 | 65.6 | 68.2 |
| Asian | 6.8 | 6.4 | 6.0 | 6.4 | 6.7 | 7.0 |
| AI/AN | 9.8 | 9.0 | 10.1 | 9.6 | 10.9 | 11.6 |
| NHOPI | 18.3 | 18.3 | 15.2 | 14.4 | 17.7 | 15.7 |
| Hispanic | 28.4 | 26.9 | 24.4 | 23.8 | 24.3 | 24.7 |
| >1 Race | 55.1 | 50.9 | 38.9 | 35.5 | 31.8 | 26.0 |
Right Chart:
| Sex | 2008 | 2009 | 2010 | 2011 | 2012 | 2013 |
|---|---|---|---|---|---|---|
| Total | 19.6 | 18.5 | 17.5 | 17.0 | 17.3 | 17.9 |
| Male | 30.4 | 29.1 | 28.0 | 27.4 | 28.2 | 29.4 |
| Female | 9.3 | 8.3 | 7.5 | 7.0 | 6.8 | 6.9 |
Key: AI/AN = American Indian and Alaska Native; NHOPI = Native Hawaiian or Other Pacific Islander.
Source: Centers for Disease Control and Prevention. CDC Fact Sheet: Estimates of new HIV infections in the United States. August 2008. https://www.cdc.gov/nchhstp/newsroom/docs/fact-sheet-on-hiv-estimates.pdf (1.3 MB). Accessed August 25, 2016; CDC, National Center for HIV, Viral Hepatitis, STD, and TB Prevention, HIV/AIDS Surveillance System, 2009-2013.
Notes: For this measure, lower rates are better. White, Black, Asian, NHOPI, and AI/AN are non-Hispanic. Hispanic includes all races.
- Importance: Determining the number of new cases helps to track the spread of HIV over time and can help identify target populations for public health interventions. Accurate estimates of new HIV infection rates are crucial for preventing the spread of the disease.
- Overall Rate: In 2013, the total rate of new HIV cases per 100,000 population for people age 13 and over was 17.9.
- Trends: From 2008 to 2013, the rates of new HIV cases decreased for Blacks, Hispanics, people of multiple races, and females. The rates increased for AI/ANs.
- Groups With Disparities:
- In all years, AI/ANs, Blacks, Hispanics, NHOPIs, and multiple-race people had higher rates of new HIV cases compared with Whites. The disparity between AI/ANs and Whites grew larger.
- In 3 of 6 years, Asians had a lower rate of new HIV cases compared with Whites.
- In all years, females had lower rates of new HIV cases compared with males.
Slide 89
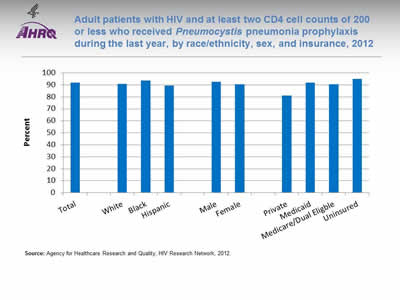
Adult patients with HIV and at least two CD4 cell counts of 200 or less who received Pneumocystis pneumonia prophylaxis during the last year, by race/ethnicity, sex, and insurance, 2012
Image: Chart shows adult patients with HIV and at least two CD4 cell counts of 200 or less who received Pneumocystis pneumonia prophylaxis during the last year:
- Total - 91.9.
- Race/ethnicity:
- White - 90.8.
- Black - 93.5.
- Hispanic - 89.5.
- Sex:
- Male - 92.4.
- Female - 90.5.
- Insurance:
- Private - 81.1.
- Medicaid - 91.8.
- Medicare/Dual Eligble - 90.4.
- Uninsured - 95.
Source: Agency for Healthcare Research and Quality, HIV Research Network, 2012.
Notes:
- Importance: Pneumocystis pneumonia (PCP, formerly known as Pneumocystis carinii pneumonia) is an opportunistic infection that affects immunocompromised individuals, particularly those infected with HIV/AIDs. Before the widespread use of PCP prophylaxis, PCP infection was more common, resulting in greater numbers of hospital admissions and related increases in cost, morbidity, and mortality. Since 1992, CDC has recommended prophylaxis for individuals with CD4 T-cell counts below. The use of prophylaxis has increased survival rates for immunocompromised patients (Fishman, 1998).
- Overall Rate: In 2012, 91.9% of adult patients with HIV had at least two CD4 cell counts of 200 or less and received PCP prophylaxis during the last year. The percentage of Adult patients with HIV and at least two CD4 cell counts of 200 or less who received PCP during the last year follows for various groups:
- Whites, 90.8%.
- Blacks, 93.5%.
- Hispanics, 89.5%.
- Males, 92.4%.
- Females, 90.5%.
- Private insurance, 81.1%.
- Medicaid, 91.8%.
- Medicare/dual eligible, 90.4%.
- Uninsured, 95%.
- Groups With Disparities:
- In 2012, the percentage of adults with HIV and at least two CD4 cell counts of 200 or less who received PCP was higher for those with Medicaid (91.8%) and Medicare/dual eligible (90.4%) compared to those with private (81.1%) insurance.
Slide 90
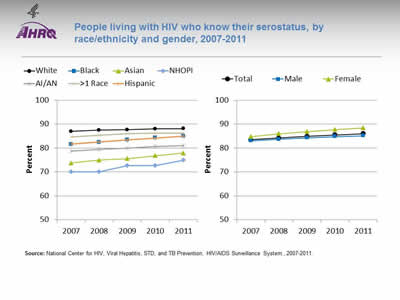
People living with HIV who know their serostatus, by race/ethnicity and gender, 2007-2011
Image: Charts show people living with HIV who know their serostatus:
Left Chart:
| Race/Ethnicity | 2007 | 2008 | 2009 | 2010 | 2011 |
|---|---|---|---|---|---|
| White | 87.0 | 87.5 | 87.7 | 88.0 | 88.1 |
| Black | 81.6 | 82.5 | 83.4 | 84.3 | 85.0 |
| Asian | 73.8 | 75.0 | 75.6 | 76.8 | 77.9 |
| AI/AN | 78.8 | 79.4 | 80.0 | 80.6 | 81.1 |
| NHOPI | 70.0 | 70.0 | 72.7 | 72.7 | 75.0 |
| Hispanic | 81.7 | 82.6 | 83.5 | 84.2 | 85.0 |
| >1 Race | 84.7 | 85.4 | 86.1 | 86.2 | 86.3 |
Right Chart:
| Sex | 2007 | 2008 | 2009 | 2010 | 2011 |
|---|---|---|---|---|---|
| Total | 83.5 | 84.2 | 84.9 | 85.5 | 86.0 |
| Male | 83.1 | 83.7 | 84.3 | 84.8 | 85.2 |
| Female | 84.8 | 86.0 | 86.9 | 87.8 | 88.5 |
Source: National Center for HIV, Viral Hepatitis, STD, and TB Prevention, HIV/AIDS Surveillance System, 2007-2011.
Notes:
- Importance: Those who are aware of a positive serostatus early on can gain early access to care and additional social services that can potentially improve quality of life. Also, knowledge of infection increases the likelihood of individuals to engage in safer sex practices with their partners compared with those who are unaware of their serostatus (CDC, 2013).
- Overall Rate: In 2011, the total percentage of people living with HIV who knew their serostatus was 86%.
- Trends: From 2007 to 2011, the percentage of people living with HIV who knew their serostatus improved for all racial/ethnic groups and both males and females.
- Groups With Disparities:
- In all years, the percentage of people living with HIV who knew their serostatus was lower for AI/ANs, Asians, Blacks, Hispanics, and NHOPIs compared with Whites.
- In all years, the percentage of people living with HIV who knew their serostatus was higher among women compared with men.
Slide 91
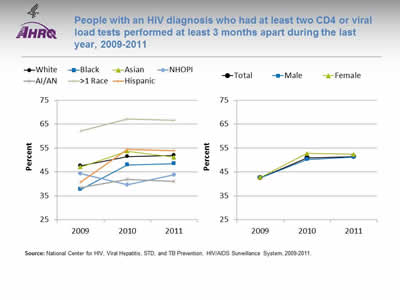
People with an HIV diagnosis who had at least two CD4 or viral load tests performed at least 3 months apart during the last year, 2009-2011
Image: Charts show people with an HIV diagnosis who had at least two CD4 or viral load tests performed at least 3 months apart during the last year:
Left Chart:
| Race/Ethnicity | 2009 | 2010 | 2011 |
|---|---|---|---|
| White | 47.6 | 51.5 | 52.0 |
| Black | 37.7 | 48.0 | 48.5 |
| Asian | 47.1 | 53.7 | 51.2 |
| AI/AN | 38.4 | 41.9 | 41.0 |
| NHOPI | 44.3 | 39.6 | 43.9 |
| Hispanic | 40.7 | 54.4 | 53.9 |
| >1 Race | 62.2 | 67.2 | 66.7 |
Right Chart:
| Sex | 2009 | 2010 | 2011 |
|---|---|---|---|
| Total | 42.6 | 50.9 | 51.5 |
| Male | 42.5 | 50.2 | 51.3 |
| Female | 42.8 | 52.8 | 52.4 |
Source: National Center for HIV, Viral Hepatitis, STD, and TB Prevention, HIV/AIDS Surveillance System, 2009-2011.
Notes:
- Importance: Checking the HIV viral load and CD4 T-cell count are methods of determining how well antiretroviral therapies are working to suppress the infection and for observing and managing HIV infection. Current treatment guidelines indicate that viral loads should be assessed at least every 3 months to determine whether the virus has been suppressed, and more often (every 4-8 weeks) if the patient’s medication regimen has changed (HHS, 2016).
- Overall Rate: In 2011, the total percentage of people with an HIV diagnosis who had at least two CD4 or viral load tests performed at least 3 months apart during the last year was 51.5%.
- Groups With Disparities:
- From 2009 to 2011, the percentage of people with an HIV diagnosis who had at least two CD4 or viral load tests performed at least 3 months apart during the last year was higher for multiple-race people compared with Whites. The percentage was lower for AI/ANs compared with Whites.
- In 2 of 3 years, the percentage of people with an HIV diagnosis who had at least two CD4 or viral load tests performed at least 3 months apart during the last year was lower for NHOPIs compared with Whites.
- There were no statistically significant differences by sex.
Slide 92
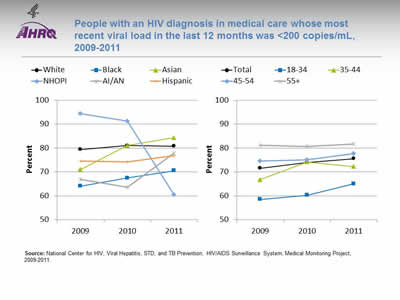
People with an HIV diagnosis in medical care whose most recent viral load in the last 12 months was <200 copies/mL, 2009-2011
Image: Charts show people with an HIV diagnosis in medical care whose most recent viral load in the last 12 months was less than 200 copies/mL:
Left Chart:
| Race/Ethnicity | 2009 | 2010 | 2011 |
|---|---|---|---|
| White | 79.4 | 81.1 | 80.8 |
| Black | 64.1 | 67.5 | 70.6 |
| Asian | 71.1 | 81.0 | 84.4 |
| NHOPI | 94.4 | 91.3 | 60.5 |
| AI/AN | 66.9 | 63.6 | 78.0 |
| Hispanic | 74.5 | 74.3 | 76.9 |
Right Chart:
| Age | 2009 | 2010 | 2011 |
|---|---|---|---|
| Total | 71.6 | 73.9 | 75.6 |
| 18-34 | 58.5 | 60.3 | 65.1 |
| 35-44 | 66.8 | 74.2 | 72.3 |
| 45-54 | 74.6 | 75.1 | 77.7 |
| 55+ | 81.2 | 80.6 | 81.8 |
Source: National Center for HIV, Viral Hepatitis, STD, and TB Prevention, HIV/AIDS Surveillance System, Medical Monitoring Project, 2009-2011.
Notes:
- Importance: Early access to care, effective HIV treatment, retention in care, and adherence to treatment regimens all help to increase viral load suppression. A suppressed viral load improves the health of people living with diagnosed HIV, increases survival, and reduces the risk of transmitting HIV to others. Patients with higher viral loads are at the highest risk of contracting opportunistic infections, experiencing non-AIDs morbidity, and dying. Initiating antiretroviral therapy (ART) is most critical for these patient groups (HHS, 2016).
- Overall Rate: In 2011, the total percentage of people with an HIV diagnosis in medical care whose most recent viral load in the last 12 months was less than 200 copies/mL was 75.6%.
- Groups With Disparities:
- From 2009 to 2011, the percentage of people with an HIV diagnosis in medical care whose most recent viral load in the last 12 months was less than 200 copies/mL was lower for Blacks compared with Whites.
- In all years, the percentage of people with an HIV diagnosis in medical care whose most recent viral load in the last 12 months was less than 200 copies/mL was lower for those ages 18-34 compared with those age 55 and over.
Slide 93
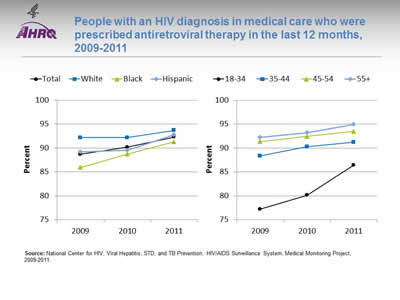
People with an HIV diagnosis in medical care who were prescribed antiretroviral therapy in the last 12 months, 2009-2011
Image: Charts show people with an HIV diagnosis in medical care who were prescribed antiretroviral therapy in the last 12 months:
Left Chart:
| Race/Ethnicity | 2009 | 2010 | 2011 |
|---|---|---|---|
| Total | 88.7 | 90.2 | 92.3 |
| White | 92.2 | 92.2 | 93.7 |
| Black | 86.0 | 88.7 | 91.3 |
| Hispanic | 89.2 | 89.5 | 92.8 |
Right Chart:
| Age | 2009 | 2010 | 2011 |
|---|---|---|---|
| 18-34 | 77.2 | 80.1 | 86.5 |
| 35-44 | 88.3 | 90.3 | 91.2 |
| 45-54 | 91.4 | 92.4 | 93.5 |
| 55+ | 92.2 | 93.2 | 95.0 |
Source: National Center for HIV, Viral Hepatitis, STD, and TB Prevention, HIV/AIDS Surveillance System, Medical Monitoring Project, 2009-2011.
Notes:
- Importance: Current treatment guidelines state that all HIV-infected people should receive anti-retroviral therapy (ART), also known as combination antiretroviral drug therapy (cART). ART decreases HIV-associated morbidity and mortality and helps to prevent transmission of the virus (HHS, 2016).
- Overall Rate: In 2011, the total percentage of people with an HIV diagnosis in medical care who were prescribed ART during the last 12 months was 92.3%.
- Groups With Disparities:
- From 2009 to 2011, the percentage of people with an HIV diagnosis in medical care who were prescribed ART during the last 12 months was lower for Blacks compared with Whites.
- In all years, the percentage of people with an HIV diagnosis in medical care who were prescribed ART during the last 12 months was lower for those ages 18-34 compared with those age 55 and over.
Slide 94
Deaths of People With HIV Infection
- A number of factors affect the death rate among people living with HIV, including:
- Underlying rates of HIV risk behaviors.
- Early detection and treatment of HIV disease.
- Management of HIV and its complications and comorbidities.
- With widespread use of antiretroviral therapy, a better understanding is needed of the patterns and risk factors for cause-specific mortality.
Slide 95
Hepatitis and Deaths of People Living With HIV
- An estimated one-third of people living with HIV are co-infected with hepatitis B or hepatitis C; hepatitis C is more common.
- Viral hepatitis progresses faster and causes more liver-related health problems in people with HIV than in those without HIV.
- Drug therapy has extended the life expectancy of people living with HIV, but liver disease has become the leading cause of non-AIDS-related death in this population (CDC, 2014).
- Hepatitis C increases the risk of death in people living with HIV by about 50% (Branch, et al., 2012).
- Current recommendations are to screen all people living with HIV for hepatitis C.
- Patients at high risk for hepatitis C should be screened annually and whenever this infection is suspected (AIDSinfo).
Slide 96
Antiretroviral Therapy and HIV Deaths
- ART has reduced the death rate of people living with HIV (PLWH), allowing their life expectancy to approach that of the general population.
- AIDS-related deaths in PLWH decrease with time on ART, but overall mortality among PLWH remains higher than in the general population.
- As the population of people living with HIV ages and time on ART increases, causes of death are changing:
- In high-income countries, deaths from cancer, cardiovascular disease, and liver disease have been identified among PLWH.
- Appropriate treatment based on the complex relationship between associated comorbidities and HIV disease could decrease mortality among PLWH and improve their quality of life (Ingle, et al., 2014).
Note:
- It is important to study cause-specific mortality to clarify whether deaths result from effects of ART, prolonged exposure to HIV, restoration of CD4 counts after severe immunosuppression, or aging and non-HIV risk factors.
Slide 97
HIV and Associated Comorbidities
- Pulmonary hypertension:
- For HIV-positive individuals, HIV proteins and HIV-related inflammation are associated with an increased risk of pulmonary hypertension (Triplette, et al., 2016).
- Frailty:
- HIV-related immunosenescence contributes to disease progression and adverse outcomes (Serrano-Villar, et al., 2016).
- Atherosclerosis:
- Protease inhibitors used to treat HIV are associated with intermediate factors that increase risk of cardiovascular disease (Bittencourt & Peixoto, 2015).
- Lower CD4 counts and higher plasma viral load have been shown to be important predictors of myocardial infarction (Bittencourt & Peixoto, 2015).
Slide 98
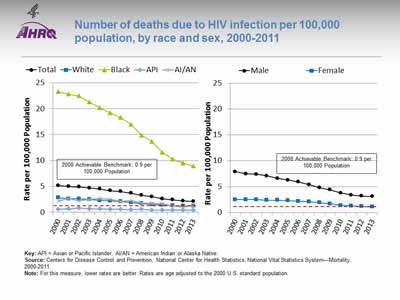
Number of deaths due to HIV infection per 100,000 population, by race and sex, 2000-2011
Image: Charts show number of deaths due to HIV infection per 100,000 population:
Left Chart:
| Race | 2000 | 2001 | 2002 | 2003 | 2004 | 2005 | 2006 | 2007 | 2008 | 2009 | 2010 | 2011 | 2012 | 2013 |
|---|---|---|---|---|---|---|---|---|---|---|---|---|---|---|
| Total | 5.2 | 5.0 | 4.9 | 4.7 | 4.5 | 4.2 | 4.0 | 3.7 | 3.3 | 3.0 | 2.6 | 2.4 | 2.2 | 2.1 |
| White | 2.8 | 2.6 | 2.6 | 2.5 | 2.3 | 2.2 | 2.1 | 1.9 | 1.7 | 1.5 | 1.4 | 1.3 | 1.2 | 1.2 |
| Black | 23.3 | 22.8 | 22.5 | 21.3 | 20.2 | 19.2 | 18.3 | 17.0 | 14.9 | 13.7 | 11.6 | 10.3 | 9.5 | 8.9 |
| API | 0.6 | 0.7 | 0.8 | 0.7 | 0.7 | 0.6 | 0.6 | 0.5 | 0.6 | 0.4 | 0.4 | 0.4 | 0.4 | 0.4 |
| AI/AN | 2.2 | 2.7 | 2.2 | 2.5 | 2.7 | 2.5 | 2.1 | 2.3 | 1.8 | 1.7 | 1.6 | 1.2 | 1.0 | 1.3 |
Right Chart:
| Sex | 2000 | 2001 | 2002 | 2003 | 2004 | 2005 | 2006 | 2007 | 2008 | 2009 | 2010 | 2011 | 2012 | 2013 |
|---|---|---|---|---|---|---|---|---|---|---|---|---|---|---|
| Male | 7.9 | 7.5 | 7.4 | 7.1 | 6.6 | 6.3 | 5.9 | 5.4 | 4.8 | 4.4 | 3.8 | 3.4 | 3.2 | 3.1 |
| Female | 2.5 | 2.5 | 2.5 | 2.4 | 2.4 | 2.3 | 2.2 | 2.1 | 1.9 | 1.7 | 1.4 | 1.3 | 1.2 | 1.1 |
2008 Achievable Benchmark: 0.9 per 100,000 Population.
Key: API = Asian or Pacific Islander, AI/AN = American Indian or Alaska Native.
Source: Centers for Disease Control and Prevention, National Center for Health Statistics, National Vital Statistics System—Mortality, 2000-2011.
Notes: For this measure, lower rates are better. Rates are age adjusted to the 2000 U.S. standard population.
- Importance: Death rates are influenced by numerous factors, such as modes of transmission, transmission rates, rates of underlying behavioral risk factors, and effectiveness of disease management and treatment. The number of deaths due to HIV reflects the effectiveness of HIV treatment and ART adherence.
- Overall Rate: In 2013, the total rate of HIV infection deaths was 2.1 per 100,000 population.
- Trend: From 2000 to 2013, the HIV infection death rates were decreasing overall and for all racial/ethnic groups and both sexes.
- Groups With Disparities:
- From 2000 to 2013, HIV infection death rates were higher for Blacks than for Whites.
- In all years, APIs had lower rates than Whites.
- In all years, the rate of HIV infection deaths was higher for males than for females.
- Achievable Benchmark:
- The 2008 top 4 State achievable benchmark for HIV deaths was 0.9 per 100,000 population. The top 4 States that contributed to the achievable benchmark are Kansas, Minnesota, Oregon, and Wisconsin.
- Overall, it would take the total population 5 years to reach the benchmark. At the current rate, Whites, Blacks, and AI/ANs could achieve the benchmark in 2, 7, and 3 years, respectively. APIs have already reached the benchmark.
- Women would take 2 years and men would take 5 years to achieve the benchmark.
Slide 99
Ryan White HIV/AIDS Program Overview
- The Ryan White HIV/AIDS Program (RWHAP) provides funds for primary care and support services for people living with and affected by HIV.
- Working with States, cities, and local community organizations, RWHAP works to improve the quality of HIV-related care for those who lack sufficient health care coverage or financial resources to cope with HIV.
- For a second year, we present RWHAP data:
- Data presented are limited to those who received care through RWHAP.
- Data are not representative of the entire HIV population, which is estimated to be about 1.2 million people in the United States.
Note:
- For more information: http://hab.hrsa.gov/abouthab/aboutprogram.html.
Slide 100
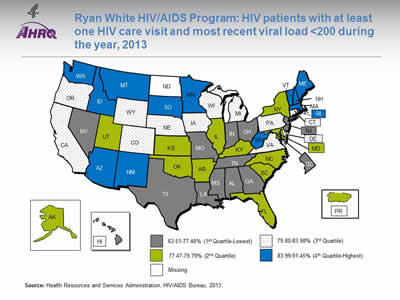
Ryan White HIV/AIDS Program: HIV patients with at least one HIV care visit and most recent viral load <200 during the year, 2013
Image: Map of the United States is color-coded by state to show HIV patients with at least one HIV care visit and most recent viral load less than 200 during the year.
Source: Health Resources and Services Administration, HIV/AIDS Bureau, 2013.
Notes:
- Overall Rate:
- The number of HIV-positive clients with at least one HIV medical care visit and at least one viral load available was 283,189; 78.6% were virally suppressed (defined as most recent HIV RNA <200 copies/mL in the calendar year). It is important for RWHAP recipients and subrecipients focus on improving viral load suppression rates in their States, as well as comparing their performance with other States.
- Quartile ranges were as follows:
- 1st quartile (lowest): 63.51%-77.46% (AL, DC, GA, HI, IN, LA, MS, MO, NV, NJ, OH, TN, TX).
- 2nd quartile: 77.47%-79.79% (AK, AR, FL, IL, KS, KY, MD, NY, NC, OK, PR, SC, UT).
- 3rd quartile: 79.80%-83.98% (CA, CO, CT, DE, IA, MI, NE, OR, PA, VA, WI, WY).
- 4th quartile (Highest): 83.99%-91.45% ( AZ, ID, MA, ME, MN, MT, NH, NM, RI, SD, VT, WA, WV).
- Missing: ND.
- In 2013, most of the New England States were in the highest quartile for the percentage of RWHAP patients with at least one HIV care visit and most recent viral load of less than 200 during the year. Most of the Southeastern States were in the lowest quartile.
Slide 101
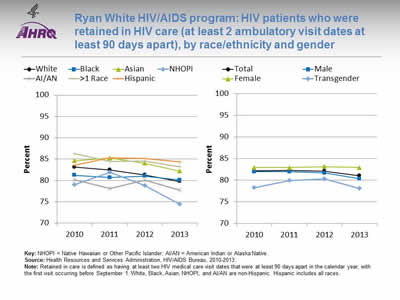
Ryan White HIV/AIDS program: HIV patients who were retained in HIV care (at least 2 ambulatory visit dates at least 90 days apart), by race/ethnicity and gender
Image: Charts show HIV patients who were retained in HIV care:
Left Chart:
| Race/Ethnicity | 2010 | 2011 | 2012 | 2013 |
|---|---|---|---|---|
| White | 83.1 | 82.5 | 81.3 | 79.8 |
| Black | 81.2 | 80.7 | 81.0 | 80.1 |
| Asian | 84.6 | 85.3 | 84.1 | 82.2 |
| NHOPI | 79.0 | 82.0 | 78.8 | 74.4 |
| AI/AN | 80.1 | 78.1 | 80.1 | 77.7 |
| >1 Race | 86.3 | 84.4 | 84.6 | 83.2 |
| Hispanic | 83.6 | 85.3 | 85.2 | 84.3 |
Right Chart:
| Gender | 2010 | 2011 | 2012 | 2013 |
|---|---|---|---|---|
| Total | 82.2 | 82.2 | 82.1 | 81.0 |
| Male | 82.0 | 82.0 | 81.7 | 80.3 |
| Female | 82.9 | 82.9 | 83.2 | 82.9 |
| Transgender | 78.2 | 79.9 | 80.3 | 78.1 |
Key: NHOPI = Native Hawaiian or Other Pacific Islander; AI/AN = American Indian or Alaska Native.
Source: Health Resources and Services Administration, HIV/AIDS Bureau, 2010-2013.
Notes: Retained in care is defined as having at least two HIV medical care visit dates that were at least 90 days apart in the calendar year, with the first visit occurring before September 1. White, Black, Asian, NHOPI, and AI/AN are non-Hispanic. Hispanic includes all races.
- Overall Rate:
- The number of HIV-positive clients with at least one HIV medical care visit before September 1 and a second medical care visit at least 90 days apart during 2013 was 277,023. In 2013, 81.0% of RWHAP HIV patients were retained in care.
- Trend: From 2010 to 2013, the percentage of HIV-positive clients who were retained in care worsened for Whites, Asians, and multiple-race people.
- Groups With Disparities:
- In 3 of 4 years, Asian and multiple-race HIV-positive clients were more likely to be retained in care than White HIV-positive clients.
- In 2 of 4 years, Hispanic HIV-positive clients were more likely to be retained in care than White HIV-positive clients.
- In 2 of 4 years, AI/AN HIV-positive clients were less likely to be retained in care than White HIV-positive clients.
- In 2 of 4 years, female HIV-positive clients were more likely to be retained in care compared with male HIV-positive clients.
- The HIV/AIDS Bureau does not ask the sexual orientation of clients, but it collects variables that portray aspects of sexual orientation, including gender, transgender status, sex at birth, and client risk factors, such as men who have sex with men.
- For more information, go to https://careacttarget.org/library/ryan-white-hivaids-program-services-report-rsr-instruction-manual
 .
.
Slide 102
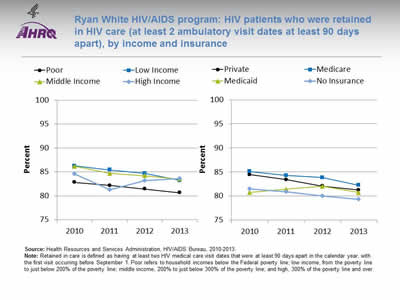
Ryan White HIV/AIDS program: HIV patients who were retained in HIV care (at least 2 ambulatory visit dates at least 90 days apart), by income and insurance
Image: Charts show HIV patients who were retained in HIV care:
Left Chart:
| Income | 2010 | 2011 | 2012 | 2013 |
|---|---|---|---|---|
| Poor | 82.9 | 82.2 | 81.5 | 80.6 |
| Low Income | 86.3 | 85.4 | 84.7 | 83.2 |
| Middle Income | 86.2 | 84.7 | 84.2 | 83.5 |
| High Income | 84.6 | 81.3 | 83.2 | 83.6 |
Right Chart:
| Insurance | 2010 | 2011 | 2012 | 2013 |
|---|---|---|---|---|
| Private | 84.4 | 83.4 | 82.1 | 81.3 |
| Medicare | 85.1 | 84.3 | 83.8 | 82.2 |
| Medicaid | 80.7 | 81.4 | 82.0 | 80.7 |
| No Insurance | 81.5 | 80.8 | 80.0 | 79.3 |
Source: Health Resources and Services Administration, HIV/AIDS Bureau, 2010-2013.
Notes: Retained in care is defined as having at least two HIV medical care visit dates that were at least 90 days apart in the calendar year, with the first visit occurring before September 1. Poor refers to household incomes below the Federal poverty line; low income, from the poverty line to just below 200% of the poverty line; middle income, 200% to just below 300% of the poverty line; and high, 300% of the poverty line and over
- Trend: From 2010 to 2013, the percentage of HIV-positive clients who were retained in care worsened for all income groups and those with private insurance, those with Medicare, and those who were uninsured.
- Groups With Disparities:
- In all years, HIV-positive clients from poor income households were less likely to be retained in care compared with those from high income households.
- In 3 of 4 years, HIV-positive clients with Medicare were more likely to be retained in care compared with those with private insurance.
Slide 103
References
AIDSInfo. Guidelines for the Prevention and Treatment of Opportunistic Infections in HIV-Infected Adults and Adolescents. Full Guideline, p. R-1. https://aidsinfo.nih.gov/guidelines/html/4/adult-and-adolescent-oi-prevention-and-treatment-guidelines/0. Accessed September 6, 2016.
Baral SD, Poteat T, Strömdahl S, et al. Worldwide burden of HIV in transgender women. Lancet Infect Dis 2013;13(3):214-22. PMID: 23260128. http://www.sciencedirect.com/science/article/pii/S1473309912703158. Accessed August 25, 2016.
Bittencourt MS, Peixoto D. Atherosclerosis in HIV patients: a different disease or more of the same? Atherosclerosis 2015;240(2):333-34.
Branch AD, Van Natta ML, Vachon ML, et al.; Studies of the Ocular Complications of AIDS Research Group. Mortality in hepatitis C virus-infected patients with a diagnosis of AIDS in the era of combination antiretroviral therapy. Clin Infect Dis 2012 Jul;55(1):137-44. Epub 2012 Apr 24. http://www.ncbi.nlm.nih.gov/pmc/articles/PMC3369565/. Accessed August 25, 2016.
Centers for Disease Control and Prevention. HIV Among Gay and Bisexual Men. July 2015a. http://www.cdc.gov/hiv/group/msm/index.html. Accessed August 25, 2016 .
Centers for Disease Control and Prevention. HIV Among Transgender People. April 2015b. http://www.cdc.gov/hiv/group/gender/transgender/index.html. Accessed August 25, 2016.
Centers for Disease Control and Prevention. HIV and Viral Hepatitis. March 2014. http://www.cdc.gov/hiv/pdf/library_factsheets_hiv_and_viral_hepatitis.pdf (329 KB). Accessed August 25, 2016.
Centers for Disease Control and Prevention. HIV in the United States: At A Glance. June 2016a. http://www.cdc.gov/hiv/statistics/basics/ataglance.html. Accessed August 25, 2016.
Centers for Disease Control and Prevention. Diagnoses of HIV infection in the United States and dependent areas, 2014. HIV Surveillance Report, Volume 26. November 2015c. https://www.cdc.gov/hiv/pdf/library/reports/surveillance/cdc-hiv-surveillance-report-us.pdf. Accessed August 25, 2016.
Slide 104
References
Centers for Disease Control and Prevention. HIV Surveillance by Race/Ethnicity. https://npin.cdc.gov/node/322444. Last reviewed August 26, 2016b. Accessed September 6, 2016.
Centers for Disease Control and Prevention. The Serostatus Approach. Essential Components of SAFE. September 2013. http://www.cdc.gov/hiv/research/seroststatusapproach/safe.html. Accessed August 25, 2016.
Colasanti J, Kelly J, Pennisi E, et al. Continuous retention and viral suppression provide further insights Into the HIV care continuum compared to the cross-sectional HIV care cascade. Clin Infect Dis 2016 Mar;62(5):648-54. Epub 2015 Nov 12. PMID: 26567263.
Fishman JA. Prevention of infection due to Pneumocystis carinii. Antimicrob Agents Chemother 1998 May;42(5):995-1004.
Grant JM Mottet LA, Tanis J, et al. Injustice at every turn: a report of the National Transgender Discrimination Survey. Washington, DC: National Center for Transgender Equality and National Gay and Lesbian Task Force; 2011.
Herbst JH, Jacobs ED, Finlayson TJ, et al. Estimating the HIV prevalence and risk behaviors of transgender persons in the United States: a systematic review. AIDS Behav 2008 Jan;12(1):1-17. Epub 2007 Aug 13. PMID:17694429.
Horberg MA, Hurley LB, Klein DB, et al. The HIV care cascade measured over time and by age, sex, and race in a large national integrated care system. AIDS Patient Care STDS 2015 Nov;29(11):582-90. PMID: 26505968.
Slide 105
References
Ingle SM, May MT, Gill MJ, et al. Impact of risk factors for specific causes of death in the first and subsequent years of antiretroviral therapy among HIV-infected patients. Clin Infect Dis 2014 Jul 15;59(2):287-97. Epub 2014 Apr 24. PMID: 24771333. http://www.ncbi.nlm.nih.gov/pmc/articles/PMC4073781/. Accessed August 25, 2016.
Moore R. Epidemiology of HIV infection in the United States: implications for linkage to care. Clin Infect Dis 2011;52(S2):S208-13. PMID: 21342909. http://www.ncbi.nlm.nih.gov/pmc/articles/PMC3106255/. Accessed August 25, 2016.
Panel on Antiretroviral Guidelines for Adults and Adolescents. Guidelines for the use of antiretroviral agents in HIV-1-infected adults and adolescents. Washington, DC: U.S. Department of Health and Human Services. http://aidsinfo.nih.gov/contentfiles/lvguidelines/AdultandAdolescentGL.pdf (4.78 MB). Accessed August 25, 2016.
Peters PJ, Pontones P, Hoover KW, et al. HIV infection linked to injection use of oxymorphone in Indiana, 2014–2015. New Engl J Med 2016;375(3):229-39.
Serrano-Villar S, Gutiérrez F, Miralles C, et al. HIV as a chronic disease: evaluation and management of non-AIDS defining conditions. Open Forum Infect Dis 2016 May 12;3(2):ofw097. https://www.ncbi.nlm.nih.gov/pmc/articles/PMC4943534/. Accessed August 25, 2016.
Stephens SC, Bernstein KT, Philip SS. Male to female transgender persons have different sexual risk behaviors yet similar rates of STDs and HIV. AIDS Behav 2011 Apr;15(3):683-6. PMID: 20694509.
Triplette M, Crothers K, Attia EF. (2016). Non-infectious pulmonary diseases and HIV. Curr HIV/AIDS Rep 2016;13(3):140-8.
Slide 106
National Healthcare Quality and Disparities Report
Chartbook on Effective Treatment
Mental Health and Substance Abuse
Slide 107
Measures
- Process: Treatment for depression.
- Outcome: Suicide deaths.
- Process: Treatment for illicit drug use or alcohol problem.
- Process: Completion of substance abuse treatment.
- Outcome: Emergency department visits with a principal diagnosis related to mental health, alcohol, or substance abuse, by age and income.
Slide 108
Treatment for Depression
- Treatment for depression can reduce symptoms and associated illnesses and return individuals to a productive lifestyle.
- Sequenced Treatment Alternatives to Relieve Depression (STAR*D) studied treatment:
- Largest clinical trial ever of depression treatment.
- Found that 28% to 33% of participants were symptom free after the first round of medication, and nearly 70% achieved remission after 12 months (Insel & Wang, 2009).
- Compared with usual care, strategies for treating depression in primary care settings have produced positive net social benefits (Glied, et al., 2010).
Notes:
- STAR*D was funded by the National Institute of Mental Health:
- It involved both primary care and specialty care settings.
- Participants included people with complex health conditions, such as multiple concurrent medical and psychiatric conditions.
- Strategies for treating depression in primary care settings include the collaborative care model.
- Glied, et al., performed cost-benefit analyses.
Slide 109
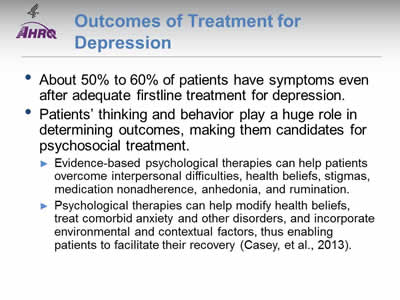
Outcomes of Treatment for Depression
- About 50% to 60% of patients have symptoms even after adequate firstline treatment for depression.
- Patients’ thinking and behavior play a huge role in determining outcomes, making them candidates for psychosocial treatment.
- Evidence-based psychological therapies can help patients overcome interpersonal difficulties, health beliefs, stigmas, medication nonadherence, anhedonia, and rumination.
- Psychological therapies can help modify health beliefs, treat comorbid anxiety and other disorders, and incorporate environmental and contextual factors, thus enabling patients to facilitate their recovery (Casey, et al., 2013).
Note:
- Anhedonia is the inability to feel pleasure.
Slide 110
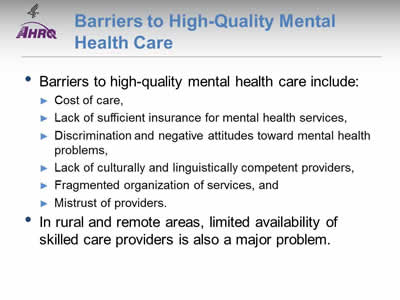
Barriers to High-Quality Mental Health Care
- Barriers to high-quality mental health care include:
- Cost of care.
- Lack of sufficient insurance for mental health services.
- Discrimination and negative attitudes toward mental health problems.
- Lack of culturally and linguistically competent providers.
- Fragmented organization of services.
- Mistrust of providers.
- In rural and remote areas, limited availability of skilled care providers is also a major problem.
Slide 111
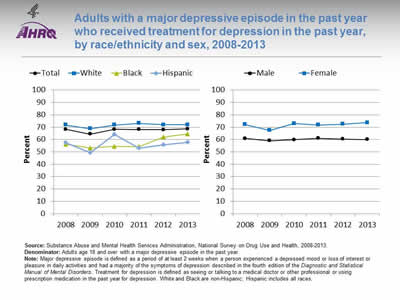
Adults with a major depressive episode in the past year who received treatment for depression in the past year, by race/ethnicity and sex, 2008-2013
Image: Charts show adults with a major depressive episode in the past year who received treatment for depression in the past year:
Left Chart:
| Race/Ethnicity | 2008 | 2009 | 2010 | 2011 | 2012 | 2013 |
|---|---|---|---|---|---|---|
| Total | 68.3 | 64.4 | 68.2 | 68.1 | 68.0 | 68.6 |
| White | 71.8 | 68.7 | 71.8 | 73.1 | 72.0 | 71.9 |
| Black | 56.1 | 53.2 | 54.5 | 54.3 | 62.1 | 64.6 |
| Hispanic | 57.4 | 49.3 | 64.2 | 53.2 | 55.6 | 57.7 |
Right Chart:
| Sex | 2008 | 2009 | 2010 | 2011 | 2012 | 2013 |
|---|---|---|---|---|---|---|
| Male | 60.9 | 59.0 | 59.8 | 61.0 | 60.3 | 60.1 |
| Female | 72.1 | 67.4 | 72.9 | 71.8 | 72.4 | 73.6 |
Source: Substance Abuse and Mental Health Services Administration, National Survey on Drug Use and Health, 2008-2013.
Denominator: Adults age 18 and over with a major depressive episode in the past year.
Notes: Major depressive episode is defined as a period of at least 2 weeks when a person experienced a depressed mood or loss of interest or pleasure in daily activities and had a majority of the symptoms of depression described in the fourth edition of the Diagnostic and Statistical Manual of Mental Disorders. Treatment for depression is defined as seeing or talking to a medical doctor or other professional or using prescription medication in the past year for depression. White and Black are non-Hispanic; Hispanic includes all races.
- Importance: The United States Preventive Services Task Force (USPSTF) recommends screening adults for depression when staff-assisted depression care supports are in place to ensure accurate diagnosis, effective treatment, and followup (USPSTF, 2015a).
- Overall Rate: In 2013, 68.6% of adults with a major depressive episode received treatment for depression.
- Trends:
- From 2008 to 2013, the percentage of adults with a major depressive episode who received treatment for depression improved among non-Hispanic Blacks.
- Changes over time were not statistically significant in the overall population, among men and women, and among non-Hispanic Whites and Hispanics.
- Groups With Disparities:
- In every year except 2010, Hispanic adults with depression were less likely than White adults to receive treatment.
- Until 2012, Black adults with depression were less likely than White adults to receive treatment.
- In all years, men with a major depressive episode were less likely than women to receive treatment.
- No disparities related to race/ethnicity or sex were getting smaller over time.
Slide 112
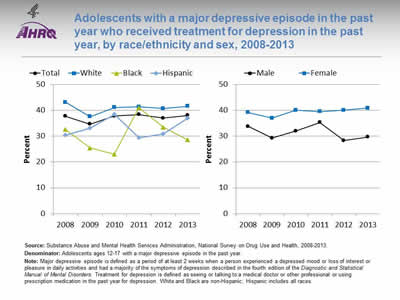
Adolescents with a major depressive episode in the past year who received treatment for depression in the past year, by race/ethnicity and sex, 2008-2013
Image: Charts show adolescents with a major depressive episode in the past year who received treatment for depression in the past year:
Left Chart:
| Race/Ethnicity | 2008 | 2009 | 2010 | 2011 | 2012 | 2013 |
|---|---|---|---|---|---|---|
| Total | 37.7 | 34.7 | 37.8 | 38.4 | 37.0 | 38.1 |
| White | 43.1 | 37.6 | 41.1 | 41.4 | 40.7 | 41.6 |
| Black | 32.6 | 25.4 | 23.0 | 41.0 | 33.5 | 28.6 |
| Hispanic | 30.3 | 33.1 | 38.4 | 29.4 | 30.8 | 36.9 |
Right Chart:
| Sex | 2008 | 2009 | 2010 | 2011 | 2012 | 2013 |
|---|---|---|---|---|---|---|
| Male | 33.8 | 29.3 | 32.0 | 35.3 | 28.3 | 29.7 |
| Female | 39.2 | 37.0 | 40.1 | 39.5 | 40.1 | 40.9 |
Source: Substance Abuse and Mental Health Services Administration, National Survey on Drug Use and Health, 2008-2013.
Denominator: Adolescents ages 12-17 with a major depressive episode in the past year.
Notes: Major depressive episode is defined as a period of at least 2 weeks when a person experienced a depressed mood or loss of interest or pleasure in daily activities and had a majority of the symptoms of depression described in the fourth edition of the Diagnostic and Statistical Manual of Mental Disorders. Treatment for depression is defined as seeing or talking to a medical doctor or other professional or using prescription medication in the past year for depression. White and Black are non-Hispanic; Hispanic includes all races.
- Importance:
- Outpatient mental health treatment and psychotropic medication use in children and adolescents increased in the United States between 1996-1998 and 2010-2012 (Olfson, et al., 2015).
- The USPSTF recommends screening adolescents ages 12-18 years for major depressive disorder when systems are in place to ensure accurate diagnosis, psychotherapy (cognitive-behavioral or interpersonal), and followup (USPSTF, 2015b).
- Overall Rate: In 2013, 38.1% of adolescents with a major depressive episode received treatment for depression.
- Trends: From 2008 to 2013, there no statistically significant changes overall, for either sex, or for any racial/ethnic group in the percentage of adolescents with a major depressive episode who received treatment for depression.
- Groups With Disparities:
- In 4 of 6 years (2008, 2009, 2010, 2013), Black adolescents with depression were less likely than White adolescents to receive treatment.
- In 4 of 6 years (2009, 2010, 2012, 2013), females with depression were more likely than males to receive treatment.
- No disparities related to race/ethnicity or sex narrowed over time.
Slide 113
Suicide Deaths
- Suicide may be prevented when its warning signs are detected and treated.
- The growing use of standardized screening instruments and electronic medical records will likely increase clinicians’ ability to identify suicidal ideas and plans among individuals being treated for depression.
- A recent study found that about half of people who died by suicide made a health care visit within 4 weeks of death. Only 24% had a mental health diagnosis (Ahmedani, et al., 2014).
Slide 114
Probability of Suicide
- Risk factors for suicide include:
- Psychotic experiences (DeVylder, et al., 2015).
- Suicidal ideation (Han, et al., 2015):
- Progression from ideation to suicide attempt varies by suicide plan and major depression status.
- Research needs to explore factors that affect suicide attempts and death by suicide among high-risk individuals with suicidal ideation.
- Positive responses to the item “Thoughts that you would be better off dead, or of hurting yourself in some way” on the Patient Health Questionnaire for depression (Simon, et al., 2013).
Notes:
- Individuals with psychotic experiences are about 5 times more likely to report suicidal ideation and nearly 10 times more likely to report a suicide attempt (DeVylder, et al., 2015). Assessing psychotic experiences among individuals with suicidal ideation could reduce suicide attempts.
- About 13% of suicidal ideators in a given year attempt suicide during that year. Suicidal ideation is the strongest known clinical predictor for death by suicide (Han, et al., 2015).
Slide 115
Suicide Prevention
- Suicide prevention is multifaceted, including:
- Educating physicians and keeping lethal weapons away from suicidal people (Mann, et al., 2005).
- Using cognitive-behavioral therapy (Tarrier, et al., 2008).
- Implementing various strategies, depending on risk:
- Universal strategies that target entire populations.
- Selective strategies that address at-risk populations.
- Indicated strategies that address high-risk individuals (Nordentoft, 2011).
Notes:
- Universal strategiestarget entire populations (e.g., public education and awareness programs).
- Selective strategies address at-risk populations (e.g., peer "natural helpers" and accessible crisis services).
- Indicated strategies address high-risk individuals (e.g., case management and parent support programs) (Nordentoft, 2011).
Slide 116
Suicide Prevention
- Ongoing research shows promising results for Internet-based cognitive-behavioral therapy and psychoeducation in treating individuals with conditions such as mood, eating, and sleep disorders (Thorndike, et al., 2013).
- As "mobile health" interventions become more sophisticated, they can be adapted to be culturally specific and sensitive (Burns, et al., 2013).
Slide 117
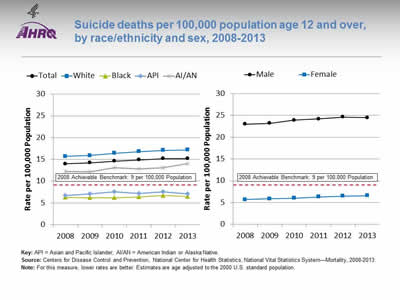
Suicide deaths per 100,000 population age 12 and over, by race/ethnicity and sex, 2008-2013
Image: Charts show suicide deaths per 100,000 population age 12 and over:
Left Chart:
| Race | 2008 | 2009 | 2010 | 2011 | 2012 | 2013 |
|---|---|---|---|---|---|---|
| Total | 14.0 | 14.2 | 14.6 | 14.9 | 15.2 | 15.2 |
| White | 15.7 | 15.9 | 16.4 | 16.8 | 17.1 | 17.2 |
| Black | 6.3 | 6.2 | 6.2 | 6.4 | 6.7 | 6.5 |
| API | 6.7 | 7.1 | 7.6 | 7.2 | 7.6 | 7.1 |
| AI/AN | 12.2 | 12.1 | 13.1 | 12.8 | 13.1 | 14.1 |
Right Chart:
| Sex | 2008 | 2009 | 2010 | 2011 | 2012 | 2013 |
|---|---|---|---|---|---|---|
| Male | 23.0 | 23.2 | 23.9 | 24.2 | 24.6 | 24.5 |
| Female | 5.7 | 5.9 | 6.0 | 6.3 | 6.5 | 6.6 |
2008 Achievable Benchmark: 9 per 100,000 Population.
Key: API = Asian and Pacific Islander; AI/AN = American Indian or Alaska Native.
Source: Centers for Disease Control and Prevention, National Center for Health Statistics, National Vital Statistics System—Mortality, 2008-2013.
Notes: For this measure, lower rates are better. Estimates are age adjusted to the 2000 U.S. standard population.
- Overall Rate: In 2013, the overall suicide death rate was 15.2 per 100,000 population age 12 and over.
- Trends: From 2008 to 2013, suicide death rates worsened for the total population, both sexes, and all racial/ethnic groups.
- Groups With Disparities:
- In all years, Blacks, Asians and Pacific Islanders (APIs), and American Indians and Alaska Natives (AI/ANs) had lower suicide death rates than Whites.
- In all years, males had higher suicide death rates than females. The gap between male and females suicide death rates is growing larger over time.
- Achievable Benchmark:
- The 2008 top 5 State achievable benchmark was 9 suicide deaths per 100,000 population. The top 5 States that contributed to the achievable benchmark are Connecticut, District of Columbia, Massachusetts, New Jersey, and New York.
- APIs, Blacks, and females have achieved the benchmark.
- The total population, AI/ANs, Whites, and males are moving away from the benchmark.
Slide 118
Treatment for Substance Abuse Disorders
- Substance abuse disorders can lead to:
- Addiction.
- Increased risk of certain cancers.
- Damage to the liver, brain, and other organs.
- Birth defects, such as fetal alcohol spectrum disorders.
- Increased risk of death from car crashes and other injuries.
Slide 119
Importance of Treatment
- In 2011, about 2.5 million emergency department visits resulted from medical emergencies involving drug misuse or abuse:
- 1.25 million involved illicit drugs.
- 1.24 million involved nonmedical use of pharmaceuticals.
- 0.61 million involved drugs combined with alcohol (SAMHSA, 2014).
- Substance abuse disorders can be effectively treated at specialty facilities.
Slide 120
Treatment Needs
- In 2013, nearly 23 million Americans age 12 years and over needed treatment for substance abuse.
- An estimated 2.5 million people received treatment at a specialty facility, but more than 20 million people who needed this type of treatment did not receive it (SAMSHA, 2014).
Note:
- Specialty facilities include hospital (inpatient), drug or alcohol rehabilitation (inpatient or outpatient), and mental health centers.
Slide 121
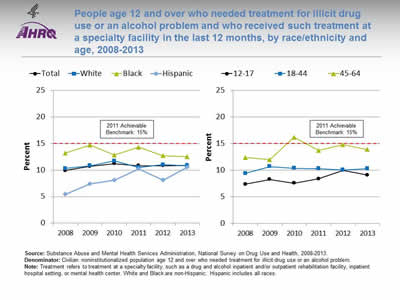
People age 12 and over who needed treatment for illicit drug use or an alcohol problem and who received such treatment at a specialty facility in the last 12 months, by race/ethnicity and age, 2008-2013
Image: Charts show people age 12 and over who needed treatment for illicit drug use or an alcohol problem and who received such treatment at a specialty facility in the last 12 months:
Left Chart:
| Race/Ethnicity | 2008 | 2009 | 2010 | 2011 | 2012 | 2013 |
|---|---|---|---|---|---|---|
| Total | 9.9 | 10.7 | 11.2 | 10.8 | 10.8 | 10.9 |
| White | 10.3 | 10.8 | 11.7 | 10.5 | 11.0 | 10.8 |
| Black | 13.2 | 14.7 | 12.8 | 14.3 | 12.7 | 12.5 |
| Hispanic | 5.4 | 7.4 | 8.1 | 10.2 | 8.1 | 10.5 |
Right Chart:
| Age | 2008 | 2009 | 2010 | 2011 | 2012 | 2013 |
|---|---|---|---|---|---|---|
| 12-17 | 7.4 | 8.3 | 7.6 | 8.4 | 10.0 | 9.1 |
| 18-44 | 9.4 | 10.7 | 10.4 | 10.3 | 10.1 | 10.3 |
| 45-64 | 12.4 | 12.0 | 16.2 | 13.7 | 14.8 | 13.9 |
2011 Achievable Benchmark: 15%.
Source: Substance Abuse and Mental Health Services Administration, National Survey on Drug Use and Health, 2008-2013.
Denominator: Civilian noninstitutionalized population age 12 and over who needed treatment for illicit drug use or an alcohol problem.
Notes: Treatment refers to treatment at a specialty facility, such as a drug and alcohol inpatient and/or outpatient rehabilitation facility, inpatient hospital setting, or mental health center. White and Black are non-Hispanic. Hispanic includes all races.
- Overall Rate: In 2013, only 10.9% of people age 12 and over who needed treatment for illicit drug use or an alcohol problem received such treatment at a specialty facility in the last 12 months.
- Trends: From 2008 to 2013, there no statistically significant change overall or for any racial/ethnic or age groups in the rates of treatment.
- Groups With Disparities: There were no consistent differences between racial/ethnic or age groups.
- Achievable Benchmark:
- The 2011 top 6 State achievable benchmark was 15%. The top 6 States that contributed to the achievable benchmark are Alabama, Alaska, Delaware, Maryland, Oregon, and Utah.
- At the current rate, the time to benchmark for the total population is 30 years. People ages 12-17 would take 14 years to reach the benchmark while people ages 18-44 would take 6 years and people ages 45-64 could reach the benchmark within 1 year.
- Whites would take 5 years to reach the benchmark.
- There is no progress toward the benchmark for Blacks and Hispanics.
Slide 122
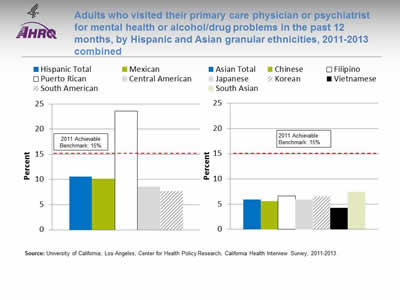
Adults who visited their primary care physician or psychiatrist for mental health or alcohol/drug problems in the past 12 months, by Hispanic and Asian granular ethnicities, 2011-2013 combined
Image: Charts show adults who visited their primary care physician or psychiatrist for mental health or alcohol/drug problems in the past 12 months, by Hispanic and Asian granular ethnicities
Left Chart:
- Hispanic Total - 10.6.
- Mexican- 10.2.
- Puerto Rican - 23.6.
- Central American - 8.6.
- South American - 7.7.
Right Chart:
- Asian Total - 5.9.
- Chinese - 5.6.
- Filipino - 6.6.
- Japanese - 5.9.
- Korean - 6.5.
- Vietnamese - 4.3.
- South Asian - 7.4.
2011 Achievable Benchmark: 15%.
Source: University of California, Los Angeles, Center for Health Policy Research, California Health Interview Survey, 2011-2013.
Notes:
- Groups With Disparities: There is considerable variable in physician visits for mental health or alcohol/drug problems among Hispanic and API granular ethnicities.
- Achievable Benchmark:
- The 2011 top 6 State achievable benchmark was 15%. The top 6 States that contributed to the achievable benchmark are Alabama, Alaska, Delaware, Maryland, Oregon, and Utah.
- Data are insufficient to determine time to benchmark.
Slide 123
Completion of Substance Abuse Treatment
- For patients receiving treatment for substance abuse, studies have shown that increased length of treatment correlates with improved outcomes (McLellan, et al., 1996), such as long-term abstinence.
- Dropout from treatment often leads to relapse and return to substance use.
Slide 124
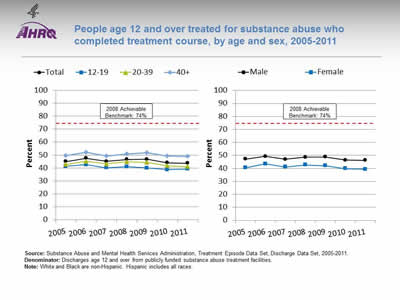
People age 12 and over treated for substance abuse who completed treatment course, by age and sex, 2005-2011
Image: Charts show people age 12 and over treated for substance abuse who completed treatment course:
Left Chart:
| Age | 2005 | 2006 | 2007 | 2008 | 2009 | 2010 | 2011 |
|---|---|---|---|---|---|---|---|
| Total | 45 | 47.5 | 45.1 | 46.6 | 46.7 | 44.1 | 43.7 |
| 12-19 | 41.3 | 42.6 | 40.1 | 41.0 | 40.1 | 38.7 | 39.1 |
| 20-39 | 42.7 | 45.2 | 43.2 | 44.9 | 44.4 | 41.7 | 41.1 |
| 40+ | 49.4 | 52.0 | 49.4 | 50.8 | 51.9 | 49.3 | 48.8 |
Right Chart:
| Sex | 2005 | 2006 | 2007 | 2008 | 2009 | 2010 | 2011 |
|---|---|---|---|---|---|---|---|
| Male | 47.1 | 49.3 | 47.1 | 48.5 | 48.8 | 46.3 | 46.2 |
| Female | 40.4 | 43.5 | 41.0 | 42.6 | 42.1 | 39.8 | 39.3 |
2008 Achievable Benchmark: 74%.
Source: Substance Abuse and Mental Health Services Administration, Treatment Episode Data Set, Discharge Data Set, 2005-2011.
Denominator: Discharges age 12 and over from publicly funded substance abuse treatment facilities.
Notes: White and Black are non-Hispanic. Hispanic includes all races.
- Overall Rate: In 2011, 43.7% of people age 12 and over treated for substance abuse completed their treatment course.
- Groups With Disparities:
- In all years, people ages 12-19 and 20-39 who were treated for substance abuse were less likely than those age 40 and over to complete treatment.
- In all years, females who were treated for substance abuse were less likely than males to complete treatment.
- Achievable Benchmark:
- The 2008 top 5 State achievable benchmark was 74%. The top 5 States that contributed to the achievable benchmark are Colorado, Connecticut, District of Columbia, Mississippi, and Texas.
- No group showed progress toward the benchmark.
Slide 125
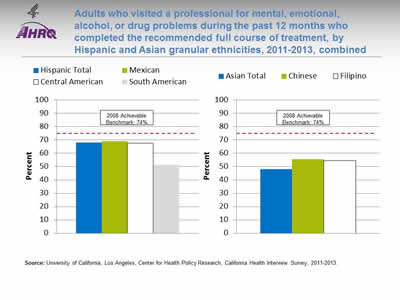
Adults who visited a professional for mental, emotional, alcohol, or drug problems during the past 12 months who completed the recommended full course of treatment, by Hispanic and Asian granular ethnicities, 2011-2013, combined
Image: Charts show adults who visited a professional for mental, emotional, alcohol, or drug problems during the past 12 months who completed the recommended full course of treatment, by Hispanic and Asian granular ethnicities:
Left Chart:
- Hispanic Total - 68.2
- .Mexican - 69.1.
- Central American - 67.6.
- South American - 51.3.
Right Chart:
- Asian Total - 48.2.
- Chinese - 55.7.
- Filipino - 54.5.
2008 Achievable Benchmark: 74%.
Source: University of California, Los Angeles, Center for Health Policy Research, California Health Interview Survey, 2011-2013.
- Groups With Disparities: There is considerable variable in completion of treatment for mental health or substance abuse problems among Hispanic and API granular ethnicities.
- Achievable Benchmark:
- The 2008 top 5 State achievable benchmark was 74%. The top 5 States that contributed to the achievable benchmark are Colorado, Connecticut, District of Columbia, Mississippi, and Texas.
- Most groups are far away from the benchmark.
Slide 126
Potentially Avoidable Emergency Department Visits
- About one in three individuals has had a mental health or substance abuse (MHSA) condition within the last 12 months.
- In 2007, 12 million ED visits involved a diagnosis related to MHSA, accounting for 12.5% of all ED visits in the United States.
- Health care providers are concerned about the rise in ED visits for MHSA, as ED overcrowding can reduce quality of care and increase the likelihood of medical error (Owens, et al., 2010).
Slide 127
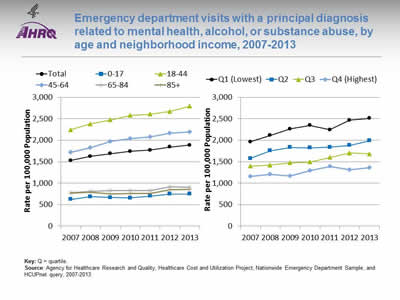
Emergency department visits with a principal diagnosis related to mental health, alcohol, or substance abuse, by age and neighborhood income, 2007-2013
Image: Charts show emergency department visits with a principal diagnosis related to mental health, alcohol, or substance abuse:
Left Chart:
| Age | 2007 | 2008 | 2009 | 2010 | 2011 | 2012 | 2013 |
|---|---|---|---|---|---|---|---|
| Total | 1527.8 | 1624.1 | 1687.4 | 1738.7 | 1766.8 | 1841 | 1883 |
| 0-17 | 621.8 | 684 | 663.3 | 655.3 | 697.5 | 746 | 749 |
| 18-44 | 2244.1 | 2379.5 | 2471.1 | 2576 | 2607.4 | 2671 | 2789 |
| 45-64 | 1720.1 | 1824.4 | 1966.4 | 2037.4 | 2077.5 | 2165 | 2190 |
| 65-84 | 773.7 | 807.6 | 826.5 | 824.4 | 828.8 | 915 | 904 |
| 85+ | 769.5 | 790.8 | 748.6 | 757.5 | 757.9 | 843 | 852 |
Right Chart:
| Income | 2007 | 2008 | 2009 | 2010 | 2011 | 2012 | 2013 |
|---|---|---|---|---|---|---|---|
| Q1 (Lowest) | 1961.1 | 2114.5 | 2263.2 | 2347.8 | 2242.6 | 2,467 | 2,510 |
| Q2 | 1576.4 | 1756.3 | 1834.2 | 1821.4 | 1838 | 1,881 | 1,989 |
| Q3 | 1396.7 | 1422.3 | 1471.4 | 1492.6 | 1600.9 | 1,702 | 1,681 |
| Q4 (Highest) | 1153.7 | 1203.8 | 1168.4 | 1288.3 | 1386.5 | 1,315 | 1,362 |
Key: Q = quartile.
Source: Agency for Healthcare Research and Quality, Healthcare Cost and Utilization Project, Nationwide Emergency Department Sample, and HCUPnet query, 2007-2013.
Notes:
- Trends:
- From 2007 to 2013, the overall rate of ED visits with a principal diagnosis related to mental health, alcohol, or substance abuse significantly increased from 1,528 to 1,883 per 100,000 population.
- Rates increased for people ages 18-44 and 45-64.
- Rates increased for residents of all area income groups.
- Groups With Disparities:
- In all years, individuals ages 0-17 and age 45 and over were significantly less likely to have an ED visit with a principal diagnosis related to mental health, alcohol, or substance abuse than individuals ages 18-44.
- In all years, individuals living in the two lowest income quartile neighborhoods were more likely to have an ED visit with a principal diagnosis related to mental health, alcohol, or substance abuse than individuals living in neighborhoods in the highest income quartile.
- No disparities related to age or area income were getting smaller over time.
Slide 128
References
Ahmedani BK, Simon GE, Stewart C, et al. Health care contacts in the year before suicide death. J Gen Intern Med 2014 Jun;29(6):870–7. PMID: 24567199. http://www.ncbi.nlm.nih.gov/pmc/articles/PMC4026491. Accessed August 29, 2016.
Burns MN, Montague E, Mohr DC. Initial design of culturally informed behavioral intervention technologies: developing an mHealth intervention for young sexual minority men with generalized anxiety disorder and major depression. J Med Internet Res 2013;15(12):e271,1-9. http://www.ncbi.nlm.nih.gov/pubmed/24311444. Accessed August 25, 2016.
Casey M, Perera D, Clarke D. Psychosocial treatment approaches to difficult-to-treat depression. Med J Aust 2013 Sep 16;199(6 Suppl):S52-5. PMID: 25370289.
Center for Behavioral Health Statistics and Quality. The NSDUH Report: substance use and mental health estimates from the 2013 National Survey on Drug Use and Health: Overview of findings. Rockville, MD: Substance Abuse and Mental Health Services Administration; September 2014. http://www.samhsa.gov/data/sites/default/files/NSDUH-SR200-RecoveryMonth-2014/NSDUH-SR200-RecoveryMonth-2014.htm. Accessed August 25, 2016.
DeVylder J, Lukens E, Link B, et al. Suicidal ideation and suicide attempts among adults with psychotic experiences. JAMA Psychiatry 2015;72(3):219-25.
Final update summary: depression in adults: screening. United States Preventive Services Task Force. July 2015a. http://www.uspreventiveservicestaskforce.org/Page/Topic/recommendation-summary/depression-in-adults-screening?ds=1&s=Depression-screening.
Final update summary: depression in children and adolescents: screening. U.S. Preventive Services Task Force. July 2015b. http://www.uspreventiveservicestaskforce.org/Page/Topic/recommendation-summary/depression-in-children-and-adolescents-screening?ds=1&s=Depression-screening.
Glied S, Herzog K, Frank R. Review: the net benefits of depression management in primary care. Med Care Res Rev 2010 Jun;67(3):251-74.
Slide 129
References
Han B, Compton WM, Gfroerer J, et al. Prevalence and correlates of past 12-month suicide attempt among adults with past-year suicidal ideation in the United States. J Clin Psychiatry 2015 Mar;76(3):295-302. PMID: 25830449.
Insel TR, Wang PS. The STAR*D trial: revealing the need for better treatments. Psychiatr Serv 2009 Nov;60(11):1466-7.
Mann JJ, Apter A, Bertolote J, et al, Suicide prevention strategies: a systematic review. JAMA 2005 Oct 26;294(16):2064-74.
McLellan AT, Woody GE, Metzger D, et al. Evaluating the effectiveness of addiction treatments: reasonable expectations, appropriate comparisons. Milbank Q 1996;74(1):51-85.
Nordentoft M. Crucial elements in suicide prevention strategies. Prog Neuropsychopharmacol Biol Psychiatry 2011 Jun 1;35(4):848-53. Epub 2010 Dec 2.
Olfson, M, Druss, B, Marcus, S. Trends in mental health care among children and adolescents. New Engl J Med 2015 May 21;372(21):2029-38. PMID: 25992747.
Owens P, Mutter R, Stocks C. Mental health and substance abuse-related emergency department visits among adults, 2007. HCUP Statistical Brief #92. Rockville, MD: Agency for Healthcare Research and Quality; July 2010. http://hcup-us.ahrq.gov/reports/statbriefs/sb92.jsp.
Simon GE, Rutter CM, Peterson D, et al. Does response on the PHQ-9 depression questionnaire predict subsequent suicide attempt or suicide death? Psychiatr Serv 2013; 64(12):1195-202. http://www.ncbi.nlm.nih.gov/pubmed/24036589. Accessed August 25, 2016.
Tarrier N, Taylor K, Gooding P. Cognitive-behavioral interventions to reduce suicide behavior: a systematic review and meta-analysis. Behav Modif 2008 Jan;32(1):77-108.
Thorndike FP, Ritterband LM, Gonder-Frederick LA, et al. A randomized controlled trial of an Internet intervention for adults with insomnia: effects on comorbid psychological and fatigue symptoms. J Clin Psychol 2013; 69(10):1078-93. http://www.ncbi.nlm.nih.gov/pubmed/24014057. Accessed August 25, 2016.
Slide 130
National Healthcare Quality and Disparities Report
Chartbook on Effective Treatment
Musculoskeletal Diseases
Slide 131
Prevalence of Arthritis
- Arthritis is the leading cause of disability in the United States (CDC, 2006).
- About one in five adults and 300,000 children have a diagnosed arthritic condition (White and Waterman, 2012).
- Prevalence is projected to double by the year 2020 due largely to an aging population and an increasing prevalence of obesity (Johnson & Hunter, 2014).
- The Centers for Disease Control and Prevention predicts a 25% increase to 67 million U.S adults with some form of arthritis by 2030 (CDC, 2006).
Slide 132
Effects of Arthritis
- It is estimated that 41% of the 50 million U.S. adults living with arthritis report activity limitations caused by arthritis (Helmick, 2008).
- Arthritis usually affects people with other chronic conditions.
- For example, arthritis is found among 52% of people with diabetes, 57% of people with heart disease, and 53% of people with hypertension.
- Obese people with arthritis are 44% more likely not to be physically active compared with those without arthritis (White & Waterman, 2012).
Slide 133

Costs of Arthritis
- In 2007, the costs attributable to arthritis and other rheumatic conditions were $128 billion:
- $80.8 billion in direct medical expenditures ($115 billion in 2013 dollars).
- $47 billion in indirect lost earnings ($59.4 billion in 2013 dollars) (Ma, et al., 2014).
Slide 134
Chronic Joint Symptoms
- Estimates of arthritis prevalence vary depending on whether the definition includes chronic joint symptoms (pain, aching, joint stiffness).
- People with chronic joint symptoms report similar health outcomes as those with arthritis:
- Activity limitations.
- Poor/fair health and mental health.
- Similar health care use (Canizares & Badley, 2012).
- These patients need interventions and advice to manage and control their pain and symptoms and thus improve their health and quality of life (Canizares and Badley, 2012).
Slide 135
Measures
- Process: Adults with chronic joint symptoms who have ever seen a doctor or health professional for joint symptoms.
Slide 136
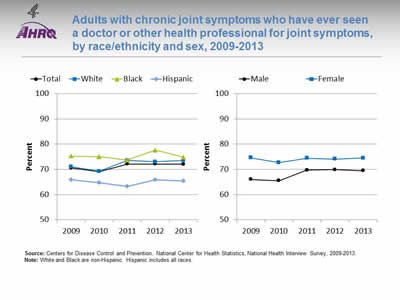
Adults with chronic joint symptoms who have ever seen a doctor or other health professional for joint symptoms, by race/ethnicity and sex, 2009-2013
Image: Charts show adults with chronic joint symptoms who have ever seen a doctor or other health professional for joint symptoms:
Left Chart:
| Race/Ethnicity | 2009 | 2010 | 2011 | 2012 | 2013 |
|---|---|---|---|---|---|
| Total | 70.5 | 69.1 | 72.1 | 72.1 | 72.0 |
| White | 71.0 | 69.2 | 73.5 | 73.0 | 73.5 |
| Black | 75.2 | 75.0 | 73.7 | 77.6 | 74.8 |
| Hispanic | 65.9 | 64.7 | 63.2 | 65.9 | 65.4 |
Right Chart:
| Sex | 2009 | 2010 | 2011 | 2012 | 2013 |
|---|---|---|---|---|---|
| Male | 66.0 | 65.5 | 69.7 | 69.9 | 69.5 |
| Female | 74.6 | 72.7 | 74.4 | 74.1 | 74.5 |
Source: Centers for Disease Control and Prevention, National Center for Health Statistics, National Health Interview Survey, 2009-2013.
Notes: White and Black are non-Hispanic. Hispanic includes all races.
- Overall Rate: In 2013, 72.0% of adults with chronic joint symptoms reported seeing a doctor or other health professional for joint symptoms.
- Trends: The percentage of male adults with chronic joint symptoms who reported seeing a doctor of health professional for joint systems increased from 66.0% in 2009 to 69.5% in 2013.
- Groups With Disparities:
- In all years, Hispanics were less likely than Whites to report seeing a doctor or other health professional for joint symptoms.
- In all years, females were more likely than males to report seeing a doctor or other health professional for joint symptoms.
- From 2009 to 2013, there were no statistically significant changes in the disparity between White and Hispanic adults who reported seeing a doctor or health professional for joint symptoms.
Slide 137
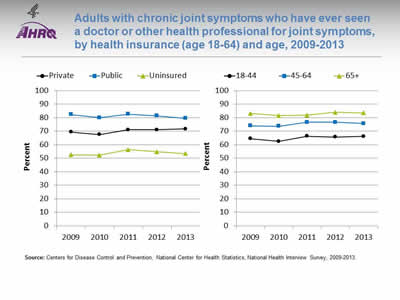
Adults with chronic joint symptoms who have ever seen a doctor or other health professional for joint symptoms, by health insurance (age 18-64) and age, 2009-2013
Image: Charts show adults with chronic joint symptoms who have ever seen a doctor or other health professional for joint symptoms:
Left Chart:
| Insurance | 2009 | 2010 | 2011 | 2012 | 2013 |
|---|---|---|---|---|---|
| Private | 69.4 | 67.6 | 71.1 | 71.2 | 71.8 |
| Public | 82.4 | 80.0 | 82.6 | 81.4 | 79.6 |
| Uninsured | 52.5 | 52.3 | 56.4 | 54.9 | 53.5 |
Right Chart:
| Age | 2009 | 2010 | 2011 | 2012 | 2013 |
|---|---|---|---|---|---|
| 18-44 | 64.5 | 62.5 | 66.4 | 65.8 | 66.2 |
| 45-64 | 74.0 | 73.7 | 76.6 | 76.6 | 75.8 |
| 65+ | 83.2 | 81.6 | 81.9 | 84.0 | 83.6 |
Source: Centers for Disease Control and Prevention, National Center for Health Statistics, National Health Interview Survey, 2009-2013.
Notes:
- Groups With Disparities:
- In all years, adults without insurance were less likely to report seeing a doctor or health professional for joint symptoms than adults with private insurance.
- In all years, adults with public insurance were more likely to report seeing a doctor or health professional for joint symptoms than adults with private insurance.
- In all years, adults ages 45-64 and 65 and over were more likely to report seeing a doctor or health professional for joint symptoms compared with those ages 18-44.
- From 2009 to 2013, there were no statistically significant changes in the disparity between uninsured adults and privately insured adults who reported seeing a doctor or health professional for joint systems.
Slide 138
References
Canizares M, Badley E. Comparison of health-related outcomes for arthritis, chronic joint symptoms, and sporadic joint symptoms: a population-based study. Arthritis Care Res 2012 Nov;64(11):1708-14. http://onlinelibrary.wiley.com/doi/10.1002/acr.21735/full. Accessed August 29, 2016.
Centers for Disease Control and Prevention. Prevalence of doctor-diagnosed arthritis and arthritis-attributable activity limitation—United States, 2003-2005. MMWR 2006;55(40):1089-92.
Helmick CG, Felson DT, Lawrence RC, et al.; National Arthritis Data Workgroup. Estimates of the prevalence of arthritis and other rheumatic conditions in the United States. Part I. Arthritis Rheum 2008;58(1):15-25. http://onlinelibrary.wiley.com/doi/10.1002/art.23177/full. Accessed August 29, 2016.
Johnson V, Hunter D. The epidemiology of osteoarthritis. Best Pract Res Clin Rheumatol 2014;28:5-15. http://www.sciencedirect.com/science/article/pii/S1521694214000059. Accessed August 29, 2016.
Ma V, Chan L, Carruthers K. Incidence, prevalence, costs, and impact on disability of common conditions requiring rehabilitation in the United States: stroke, spinal cord injury, traumatic brain injury, multiple sclerosis, osteoarthritis, rheumatoid arthritis, limb loss, and back pain. Arch Phys Med Rehabil 2014;95:986-95. https://www.ncbi.nlm.nih.gov/pmc/articles/PMC4180670/. Accessed August 29, 2016.
White P, Waterman M. Making osteoarthritis a public health priority. Am J Nurs 2012 Mar;112(3 Suppl 1):S20-5. PMID:22373742.
Slide 139
National Healthcare Quality and Disparities Report
Chartbook on Effective Treatment
Respiratory Diseases
Slide 140
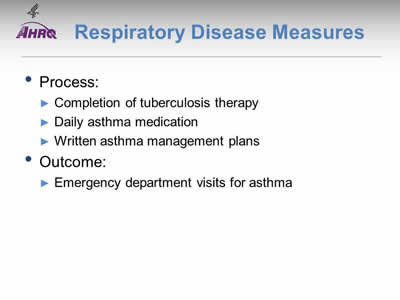
Respiratory Disease Measures
- Process:
- Completion of tuberculosis therapy.
- Daily asthma medication.
- Written asthma management plans.
- Outcome:
- Emergency department visits for asthma.
Slide 141
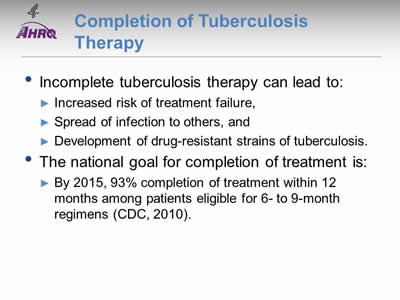
Completion of Tuberculosis Therapy
- Incomplete tuberculosis therapy can lead to:
- Increased risk of treatment failure.
- Spread of infection to others.
- Development of drug-resistant strains of tuberculosis.
- The national goal for completion of treatment is:
- By 2015, 93% completion of treatment within 12 months among patients eligible for 6- to 9-month regimens (CDC, 2010).
Slide 142
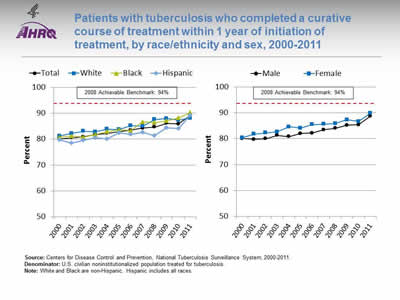
Patients with tuberculosis who completed a curative course of treatment within 1 year of initiation of treatment, by race/ethnicity and sex, 2000-2011
Image: Charts show patients with tuberculosis who completed a curative course of treatment within 1 year of initiation of treatment:
Left Chart:
| Race/Ethnicity | 2000 | 2001 | 2002 | 2003 | 2004 | 2005 | 2006 | 2007 | 2008 | 2009 | 2010 | 2011 |
|---|---|---|---|---|---|---|---|---|---|---|---|---|
| Total | 80.2 | 80.5 | 80.9 | 81.8 | 82.3 | 82.8 | 83.5 | 84.3 | 84.7 | 86.1 | 85.9 | 89.1 |
| White | 81.2 | 82.2 | 83.1 | 82.8 | 83.9 | 83.7 | 85.2 | 85.0 | 87.6 | 88.0 | 87.3 | 88.1 |
| Black | 80.7 | 81.2 | 80.8 | 81.8 | 82.9 | 83.6 | 83.3 | 86.7 | 86.4 | 87.1 | 88.2 | 90.3 |
| Hispanic | 79.8 | 78.5 | 79.5 | 80.5 | 80.0 | 82.5 | 81.8 | 82.6 | 81.4 | 84.4 | 84.0 | 89.2 |
Right Chart:
| Sex | 2000 | 2001 | 2002 | 2003 | 2004 | 2005 | 2006 | 2007 | 2008 | 2009 | 2010 | 2011 |
|---|---|---|---|---|---|---|---|---|---|---|---|---|
| Male | 80.1 | 79.8 | 80.0 | 81.3 | 80.8 | 82.0 | 82.2 | 83.5 | 84.0 | 85.2 | 85.4 | 88.7 |
| Female | 80.4 | 81.8 | 82.3 | 82.7 | 84.6 | 84.1 | 85.5 | 85.6 | 85.9 | 87.3 | 86.7 | 89.8 |
2008 Achievable Benchmark: 94%.
Source: Centers for Disease Control and Prevention, National Tuberculosis Surveillance System, 2000-2011.
Denominator: U.S. civilian noninstitutionalized population treated for tuberculosis.
Notes: White and Black are non-Hispanic. Hispanic includes all races.
- Overall: In 2011, the overall percentage of patients who completed tuberculosis therapy within 1 year was 89.1%.
- Trends: The percentage of patients who completed tuberculosis therapy within 1 year increased from 80.2% in 2000 to 89.1% in 2011. Improvements were also observed among all major racial/ethnic groups and both sexes.
- Groups With Disparities:
- In 9 of 12 years, Hispanics were less likely than Whites to complete tuberculosis treatment.
- In 7 of 12 years, females were more likely than males to complete tuberculosis treatment.
- Achievable Benchmark:
- The 2008 top 4 State achievable benchmark was 94%. The top 4 States that contributed to the achievable benchmark are Colorado, Kansas, Mississippi, and Oregon.
- At the current annual rates of increase, Blacks and Hispanics could achieve the achievable benchmark in 3 years and 2 years, respectively. Whites show no progress toward the benchmark.
- Both men and women would need about 4 years.
Slide 143
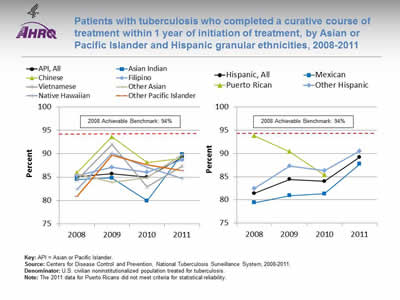
Patients with tuberculosis who completed a curative course of treatment within 1 year of initiation of treatment, by Asian or Pacific Islander and Hispanic granular ethnicities, 2008-2011
Image: Charts show patients with tuberculosis who completed a curative course of treatment within 1 year of initiation of treatment, by Asian or Pacific Islander and Hispanic granular ethnicities:
Left Chart:
| Ethnicity | 2008 | 2009 | 2010 | 2011 |
|---|---|---|---|---|
| API, All | 85.1 | 85.7 | 85.0 | 89.2 |
| Asian Indian | 84.5 | 84.8 | 79.9 | 89.9 |
| Chinese | 85.9 | 93.6 | 88.1 | 89.0 |
| Filipino | 85.3 | 87.1 | 86.0 | 88.7 |
| Vietnamese | 84.4 | 92.0 | 82.9 | 87.4 |
| Other Asian | 85.7 | 83.9 | 84.9 | 89.9 |
| Native Hawaiian | 82.4 | 90.1 | 87.1 | 84.7 |
| Other Pacific Islander | 80.9 | 89.7 | 87.6 | 86.4 |
Right Chart:
| Ethnicity | 2008 | 2009 | 2010 | 2011 |
|---|---|---|---|---|
| Hispanic, All | 81.4 | 84.4 | 84.0 | 89.2 |
| Mexican | 79.4 | 80.9 | 81.3 | 87.7 |
| Puerto Rican | 93.8 | 90.4 | 85.4 | |
| Other Hispanic | 82.5 | 87.3 | 86.3 | 90.5 |
2008 Achievable Benchmark: 94%.
Key: API = Asian or Pacific Islander.
Source: Centers for Disease Control and Prevention, National Tuberculosis Surveillance System, 2008-2011.
Denominator: U.S. civilian noninstitutionalized population treated for tuberculosis.
Notes: The 2011 data for Puerto Ricans did not meet criteria for statistical reliability.
- Groups With Disparities:
- From 2008 to 2011, the percentage of Asian or Pacific Islander (API) and Hispanic granular ethnic groups who completed tuberculosis treatment showed some variability.
- For API groups, the percentage ranged from a low of 79.9% for Asian Indian patients in 2010 to a high of 93.6% for Chinese patients in 2009.
- For Hispanic ethnic groups, the percentage went from a low of 79.4% for Mexican patients in 2008 to a high of 93.8% for Puerto Rican patients in 2008.
- Despite the variability of earlier years, in 2011, there were no statistically significant differences between the API patient groups or the Hispanic patient groups who completed tuberculosis treatment.
- Achievable Benchmark:
- The 2008 top 4 State achievable benchmark was 94%. The top 4 States that contributed to the achievable benchmark are Colorado, Kansas, Mississippi, and Oregon.
- At the current annual rates of increase, all APIs could achieve the benchmark in about 4 years. For individual API ethnic groups, Filipinos, other Pacific Islanders, Asian Indians, and other Asians could reach the benchmark in about 6, 5, 4, and 3 years, respectively. Chinese, Vietnamese, and Native Hawaiian groups show no progress toward the benchmark.
- Mexicans and other Hispanics could reach the benchmark in about 4 years.
Slide 144
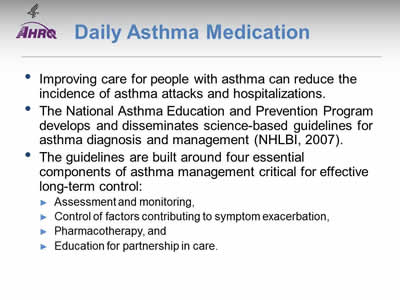
Daily Asthma Medication
- Improving care for people with asthma can reduce the incidence of asthma attacks and hospitalizations.
- The National Asthma Education and Prevention Program develops and disseminates science-based guidelines for asthma diagnosis and management (NHLBI, 2007).
- The guidelines are built around four essential components of asthma management critical for effective long-term control:
- Assessment and monitoring.
- Control of factors contributing to symptom exacerbation.
- Pharmacotherapy.
- Education for partnership in care.
Slide 145
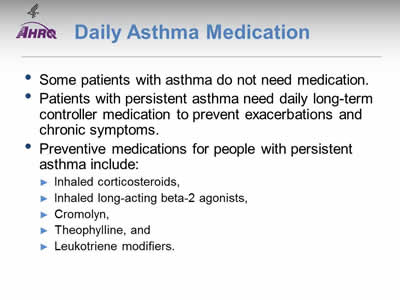
Daily Asthma Medication
- Some patients with asthma do not need medication.
- Patients with persistent asthma need daily long-term controller medication to prevent exacerbations and chronic symptoms.
- Preventive medications for people with persistent asthma include:
- Inhaled corticosteroids.
- Inhaled long-acting beta-2 agonists.
- Cromolyn.
- Theophylline.
- Leukotriene modifiers.
Slide 146
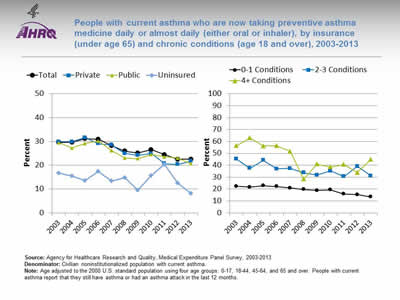
People with current asthma who are now taking preventive asthma medicine daily or almost daily (either oral or inhaler), by insurance (under age 65) and chronic conditions (age 18 and over), 2003-2013
Image: Charts show people with current asthma who are now taking preventive asthma medicine daily or almost daily:
Left Chart:
| Insurance | 2003 | 2004 | 2005 | 2006 | 2007 | 2008 | 2009 | 2010 | 2011 | 2012 | 2013 |
|---|---|---|---|---|---|---|---|---|---|---|---|
| Total | 29.6 | 29.7 | 31.2 | 30.9 | 28.3 | 25.9 | 25.1 | 26.5 | 24.4 | 22.5 | 22.5 |
| Private | 29.8 | 29.9 | 31.6 | 29.1 | 28.6 | 24.9 | 24.1 | 25.0 | 20.7 | 20.3 | 21.7 |
| Public | 29.5 | 27.2 | 29.1 | 30.2 | 26.2 | 23.1 | 22.8 | 24.5 | 23.5 | 23.0 | 20.7 |
| Uninsured | 16.7 | 15.5 | 13.5 | 17.4 | 13.4 | 14.9 | 9.6 | 15.6 | 20.4 | 12.6 | 8.2 |
Right Chart:
| No. of Conditions | 2003 | 2004 | 2005 | 2006 | 2007 | 2008 | 2009 | 2010 | 2011 | 2012 | 2013 |
|---|---|---|---|---|---|---|---|---|---|---|---|
| 0-1 Conditions | 22.3 | 21.6 | 22.8 | 22.1 | 21.0 | 19.7 | 18.9 | 19.3 | 15.8 | 15.4 | 13.5 |
| 2-3 Conditions | 45.2 | 37.6 | 44.2 | 37.0 | 37.4 | 33.7 | 31.8 | 35.3 | 30.6 | 39.1 | 31.0 |
| 4+ Conditions | 56.4 | 63.0 | 56.2 | 56.4 | 51.6 | 28.5 | 41.0 | 38.6 | 40.7 | 33.8 | 45.1 |
Source: Agency for Healthcare Research and Quality, Medical Expenditure Panel Survey, 2003-2013.
Denominator: Civilian noninstitutionalized population with current asthma.
Notes: Age adjusted to the 2000 U.S. standard population using four age groups: 0-17, 18-44, 45-64, and 65 and over. People with current asthma report that they still have asthma or had an asthma attack in the last 12 months.
- Overall: In 2013, the overall percentage of people with current asthma who reported taking preventive asthma medicine daily or almost daily was 22.5%.
- Trends: From 2003 to 2013, the percentage of people with current asthma who reported taking preventive medicine daily or almost daily decreased:
- From 29.6% to 22.5% for total adult population.
- From 29.8% to 21.7% for those under age 65 with private insurance.
- From 29.5% to 20.7% for those under age 65 with public insurance.
- From 16.7% to 8.2% for those under age 65 with no insurance.
- From 22.3% to 13.5% for those age 18 and over with 0-1 chronic conditions.
- From 45.2% to 31.0% for those age 18 and over with 2-3 chronic conditions.
- From 56.4% to 45.1% for those age 18 and over with 4 or more chronic conditions.
- Groups With Disparities:
- In 9 of 11 years, among people under age 65 with current asthma, those who were uninsured were less likely than those with private insurance to take preventive medicine daily or almost daily.
- In all years, among people age 18 and over with current asthma, those with 2-3 chronic conditions and 4 or more chronic conditions were more likely than those with 0-1 chronic conditions to take preventive medicine daily or almost daily.
- Among people under age 65 with current asthma who reported taking preventive asthma medicine daily or almost daily, the disparity between uninsured people and those with private insurance grew smaller but was still present.
Slide 147
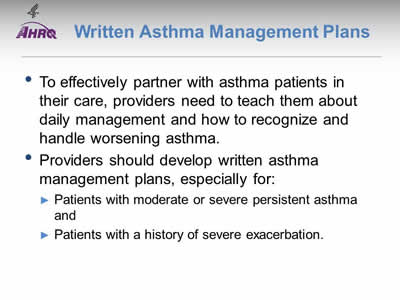
Written Asthma Management Plans
- To effectively partner with asthma patients in their care, providers need to teach them about daily management and how to recognize and handle worsening asthma.
- Providers should develop written asthma management plans, especially for:
- Patients with moderate or severe persistent asthma.
- Patients with a history of severe exacerbation.
Slide 148
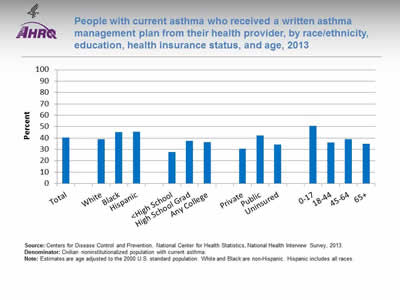
People with current asthma who received a written asthma management plan from their health provider, by race/ethnicity, education, health insurance status, and age, 2013
Image: Chart shows people with current asthma who received a written asthma management plan from their health provider:
- Total - 40.5.
- Race/ethnicity:
- White - 39.0.
- Black - 45.3.
- Hispanic - 45.4.
- Education:
- Less than High School - 27.7.
- High School Grad - 37.6.
- Any College - 36.4.
- Health insurance status
- Private - 30.7.
- Public - 42.1.
- Uninsured - 34.4.
- Age:
- 0-17 - 50.8.
- 18-44 - 36.2,
- 45-64 - 39.0.
- 65+ - 34.9.
Source: Centers for Disease Control and Prevention, National Center for Health Statistics, National Health Interview Survey, 2013.
Denominator: Civilian noninstitutionalized population with current asthma.
Notes: Estimates are age adjusted to the 2000 U.S. standard population. White and Black are non-Hispanic. Hispanic includes all races.
- Overall Rate: In 2013, 40.5% of people with current asthma received a written asthma management plan from their provider.
- Groups With Disparities:
- In 2013 Blacks (45.3%) and Hispanics (45.4%) were more likely than Whites (39%) to receive a written asthma management plan.
- In 2013, adults with less than a high school education (27.7%) were less likely than high school graduates (37.6%) and those with any college education (36.4%) to receive a written asthma management plan.
- In 2013, adults without insurance (34.4%) were more likely than adults with private insurance (30.7%) to receive a written asthma management plan.
- In 2013, children ages 0-17 (50.8%) were more likely than adults ages 18-44 (36.2%), 45-64 (39.0%), and 65 and over (34.9%) to receive a written asthma management plan from their provider.
Slide 149
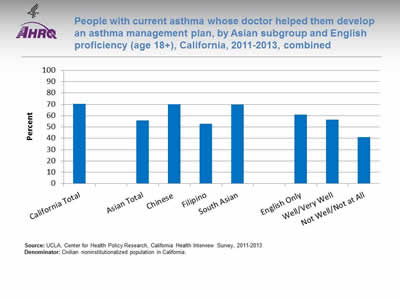
People with current asthma whose doctor helped them develop an asthma management plan, by Asian subgroup and English proficiency (age 18+), California, 2011-2013, combined
Image: Chart shows people with current asthma whose doctor helped them develop an asthma management plan, for California:
- California Total - 70.4.
- Asian groups:
- Asian Total - 55.8.
- Chinese - 70.2.
- Filipino - 52.9.
- South Asian - 69.8.
- English proficiency:
- English Only - 60.8.
- Well/Very Well - 56.6.
- Not Well/Not at All - 41.2.
Source: UCLA, Center for Health Policy Research, California Health Interview Survey, 2011-2013.
Denominator: Civilian noninstitutionalized population in California.
Notes:
- Overall Rate: In California, in 2011-2013, 55.8% of Asian Californians with current asthma had a doctor who helped them develop an asthma management plan.
- Groups With Disparities:
- In 2011-2013, Asians (55.8%) were less likely than all Californians (70.4%) to have a doctor help them develop an asthma management plan.
- There were moderate variations among Asian subgroups and slight differences for Asians related to English proficiency; however, none of these differences were statistically significant due in part to large standard errors.
Slide 150
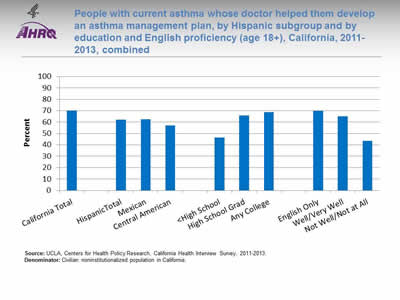
People with current asthma whose doctor helped them develop an asthma management plan, by Hispanic subgroup and by education and English proficiency (age 18+), California, 2011-2013, combined
Image: Chart shows people with current asthma whose doctor helped them develop an asthma management plan, for California:
- Hispanic groups:
- Hispanic Total - 62.1.
- Mexican - 62.7.
- Central American - 57.2.
- Education:
- Less than High School - 46.5.
- High School Grad - 65.7.
- Any College - 68.8.
- English proficiency:
- English Only - 69.9.
- Well/Very Well - 65.1.
- Not Well/Not at All - 43.5.
Source: UCLA, Centers for Health Policy Research, California Health Interview Survey, 2011-2013.
Denominator: Civilian noninstitutionalized population in California.
Notes:
- Overall Rate: In California, in 2011-2013, 62.1% of Hispanics with current asthma had a doctor who helped them develop an asthma management plan.
- Groups With Disparities:
- In 2011-2013, Hispanics (62.1%) were less likely than all Californians (70.4%) to have a doctor help them develop an asthma management plan.
- In 2011-2013, among Hispanics, those with less than a high school education (46.5%) were less likely than high school graduates (65.7%) and those with any college education (68.8%) to have a doctor help them develop an asthma management plan.
- In 2011-2013, among Hispanics, those who did not speak English well (43.5%) were less likely than those who spoke English well or very well (65.1%) and those who spoke only English at home (69.9%) to report receiving help developing an asthma management plan.
Slide 151
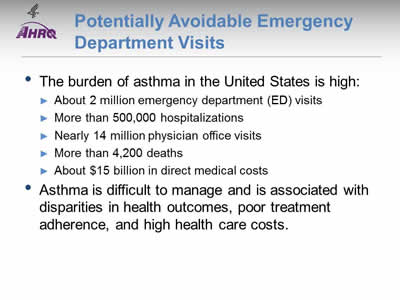
Potentially Avoidable Emergency Department Visits
- The burden of asthma in the United States is high:
- About 2 million emergency department (ED) visits.
- More than 500,000 hospitalizations.
- Nearly 14 million physician office visits.
- More than 4,200 deaths.
- About $15 billion in direct medical costs.
- Asthma is difficult to manage and is associated with disparities in health outcomes, poor treatment adherence, and high health care costs.
Slide 152
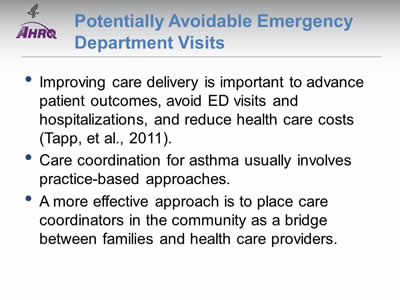
Potentially Avoidable Emergency Department Visits
- Improving care delivery is important to advance patient outcomes, avoid ED visits and hospitalizations, and reduce health care costs (Tapp, et al., 2011).
- Care coordination for asthma usually involves practice-based approaches.
- A more effective approach is to place care coordinators in the community as a bridge between families and health care providers.
Notes:
- In a practice-based approach, the care provider identifies and refers families to a care coordination program in the medical care facility.
- It is better to place care coordinators in the community:
- They can learn and better understand the contextual factors and issues that affect families.
- They can identify tailored support and services for optimal health care outcomes for asthma patients (Findley, et al., 2011).
Slide 153
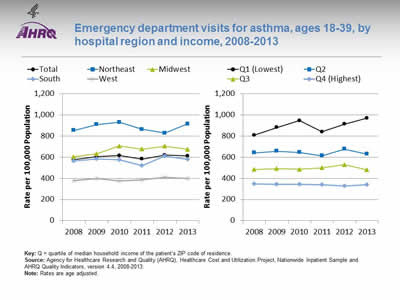
Emergency department visits for asthma, ages 18-39, by hospital region and income, 2008-2013
Image: Charts show emergency department visits for asthma:
Left Chart:
| Hospital Region | 2008 | 2009 | 2010 | 2011 | 2012 | 2013 |
|---|---|---|---|---|---|---|
| Total | 578.0 | 604.2 | 616.3 | 582.0 | 619.2 | 613.1 |
| Northeast | 854.4 | 909.3 | 931.0 | 864.6 | 829.3 | 914.8 |
| Midwest | 604.6 | 631.6 | 706.2 | 677.9 | 705.5 | 674.4 |
| South | 564.4 | 583.5 | 576.5 | 522.6 | 611.4 | 577.9 |
| West | 378.6 | 397.0 | 376.4 | 388.4 | 408.8 | 400.7 |
Right Chart:
| Income | 2008 | 2009 | 2010 | 2011 | 2012 | 2013 |
|---|---|---|---|---|---|---|
| Q1 (Lowest) | 808.6 | 881.3 | 947.4 | 839.5 | 913.0 | 969.6 |
| Q2 | 641.8 | 656.7 | 644.9 | 613.8 | 677.7 | 630.4 |
| Q3 | 483.7 | 491.4 | 485.8 | 499.6 | 530.2 | 480.6 |
| Q4 (Highest) | 348.3 | 343.3 | 342.4 | 341.2 | 327.6 | 338.8 |
Key: Q = quartile of median household income of the patient’s ZIP code of residence.
Source: Agency for Healthcare Research and Quality (AHRQ), Healthcare Cost and Utilization Project, Nationwide Inpatient Sample and AHRQ Quality Indicators, version 4.4, 2008-2013.
Notes: Rates are age adjusted.
- Importance: Asthma exacerbations were responsible for approximately 2 million ED visits in 2012. ED visits for asthma exacerbation suggest a failure of prevention-oriented care since most asthma exacerbations are preventable with high-quality long-term management.
- Trends: From 2008 to 2013, the overall rate of ED visits for asthma increased from 578.0 to 613.1 per 100,000 population.
- Groups With Disparities:
- From 2008 to 2013, rates of ED visits for asthma were highest in the Northeast and lowest in the West. In 2013, the rate of ED visits for asthma in the Northeast was 914.8 per 100,000 population, followed by the Midwest (674.4 per 100,000 population), the South (577.9 per 100,000 population), and the West (400.7 per 100,000 population).
- In all years, adults with the highest income were significantly less likely than all other income groups to have an ED visit for asthma.
- Go to more information on care coordination related to ED visits for asthma.
Slide 154
References
Centers for Disease Control and Prevention. Monitoring tuberculosis programs: National Tuberculosis Indicator Project, United States, 2002-2008. MMWR 2010;59(10):295-8. http://www.cdc.gov/mmwr/preview/mmwrhtml/mm5910a3.htm. Accessed August 29, 2016.
Findley S, Rosenthal M, Bryant-Stephens T. Community-based care coordination: practical applications for childhood asthma. Health Promot Pract 2011 Nov;12(6 Suppl 1):52S-62S. PMID: 22068360.
National Heart, Lung, and Blood Institute, National Asthma Education and Prevention Program. Expert panel report 3: guidelines for the diagnosis and management of asthma. Full report 2007. Bethesda, MD: National Institutes of Health; 2007. Publication No. NIH 07-4051. https://www.nhlbi.nih.gov/sites/default/files/media/docs/EPR-3_Asthma_Full_Report_2007.pdf (4 MB). Accessed August 29, 2016.
Tapp H, Herbert L, Dulin M. Comparative effectiveness of asthma interventions within a practice based research network. BMC Health Serv Res 2011 Aug 16;11:188. http://www.ncbi.nlm.nih.gov/pmc/articles/PMC3176175/. Accessed August 29, 2016.


