Chartbook on Person- and Family-Centered Care: Slide Presentation
National Healthcare Quality and Disparities Report
Slide 1
National Healthcare Quality and Disparities Report
Chartbook on Person- and Family-Centered Care
September 2016
Slide 2
National Healthcare Quality and Disparities Report
- Annual report to Congress mandated in the Healthcare Research and Quality Act of 1999 (P.L. 106-129).
- Provides a comprehensive overview of:
- Quality of health care received by the general U.S. population.
- Disparities in care experienced by different racial, ethnic, and socioeconomic groups.
- Assesses the performance of our health system and identifies areas of strengths and weaknesses along three main axes:
- Access to health care.
- Quality of health care.
- Priorities of the National Quality Strategy.
Slide 3
National Healthcare Quality and Disparities Report
- Based on more than 250 measures of quality and disparities covering a broad array of health care services and settings.
- Data generally available through 2013, with some exceptions.
- Produced with the help of an Interagency Work Group led by the Agency for Healthcare Research and Quality and submitted on behalf of the Secretary of Health and Human Services.
Slide 4
Key Findings of the 2015 QDR
- Access to care has improved dramatically.
- Quality of care continues to improve, but wide variation exists across the National Quality Strategy (NQS) priorities:
- Effective Treatment measures indicate improvements in overall performance and reductions in disparities.
- Care Coordination measures have lagged behind other priorities in overall performance.
- Patient Safety, Person-Centered Care, and Healthy Living measures have improved overall, but many disparities remain.
Notes:
- Despite progress in some areas, disparities related to race and socioeconomic status persist among measures of access and all NQS priorities.
- Improvements in access were led by sustained reductions in the number of Americans without health insurance and increases in the number of Americans with a usual source of medical care.
- Care Affordability measures are limited for summarizing performance and disparities.
- Disparities in access tend to be more common than disparities in quality.
Slide 5
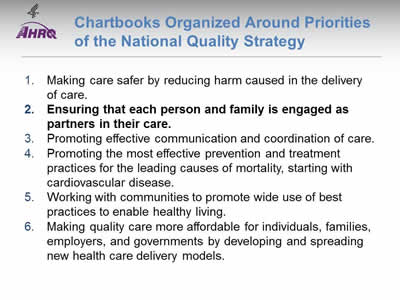
Chartbooks Organized Around Priorities of the National Quality Strategy
- Making care safer by reducing harm caused in the delivery of care.
- Ensuring that each person and family is engaged as partners in their care.
- Promoting effective communication and coordination of care.
- Promoting the most effective prevention and treatment practices for the leading causes of mortality, starting with cardiovascular disease.
- Working with communities to promote wide use of best practices to enable healthy living.
- Making quality care more affordable for individuals, families, employers, and governments by developing and spreading new health care delivery models.
Note: Person- and Family-Centered Care is one of the six national priorities identified in the National Quality Strategy.
Slide 6
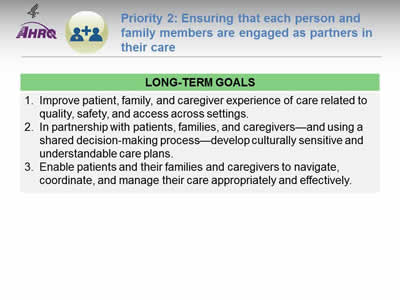
Priority 2: Ensuring that each person and family members are engaged as partners in their care
Long-Term Goals:
- Improve patient, family, and caregiver experience of care related to quality, safety, and access across settings.
- In partnership with patients, families, and caregivers—and using a shared decision-making process—develop culturally sensitive and understandable care plans.
- Enable patients and their families and caregivers to navigate, coordinate, and manage their care appropriately and effectively.
Note: Person-centered care means defining success not just by the resolution of clinical symptoms but also by whether patients achieve their desired outcomes. Some examples of person-centered care include ensuring that patients' preferences, desired outcomes, and experiences of care are integrated into care delivery; integrating patient-generated data in electronic health records; and finding additional ways to involve patients and families in managing their care effectively.
Slide 7
Chartbook on Person- and Family-Centered Care
- This chartbook includes:
- Summary of trends across measures of Person-Centered Care from the QDR.
- Figures illustrating select measures of Person-Centered Care.
- Introduction and Methods contains information about methods used in the chartbook.
- A Data Query tool (http://nhqrnet.ahrq.gov/inhqrdr/data/query) provides access to all data tables.
Slide 8
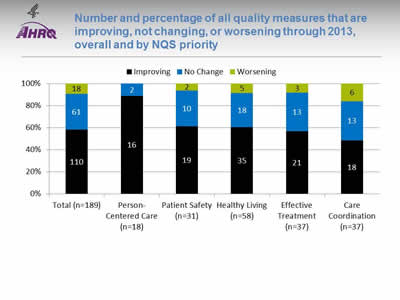
Number and percentage of all quality measures that are improving, not changing, or worsening through 2013, overall and by NQS priority
Image: Chart shows number and percentage of all quality measures that are improving, not changing, or worsening through 2013:
| Priority | Improving | No Change | Worsening |
|---|---|---|---|
| Total (n=189) | 110 | 61 | 18 |
| Person-Centered Care (n=18) | 16 | 2 | |
| Patient Safety (n=31) | 19 | 10 | 2 |
| Healthy Living (n=58) | 35 | 18 | 5 |
| Effective Treatment (n=37) | 21 | 13 | 3 |
| Care Coordination (n=37) | 18 | 13 | 6 |
Key: n = number of measures.
Notes: For the majority of measures, trend data are available from 2001 to 2013. Measures of Care Affordability are included in the Total but not shown separately.
For each measure with at least four estimates over time, log-linear regression is used to calculate average annual percentage change relative to the baseline year and to assess statistical significance. Measures are aligned so that positive change indicates improved care.
- Improving = Rates of change are positive at 1% per year or greater and are statistically significant.
- No Change = Rates of change are less than 1% per year or not statistically significant.
- Worsening = Rates of change are negative at -1% per year or greater and are statistically significant.
- Through 2013, across a broad spectrum of measures of health care quality, 60% showed improvement.
- Nearly all measures of Person-Centered Care improved.
- About 60% of measures of Effective Treatment, Healthy Living, and Patient Safety improved.
- Fewer than half of measures of Care Coordination improved.
- Fewer than a dozen measures of Care Affordability are tracked in the report, too few to summarize this way.
Slide 9
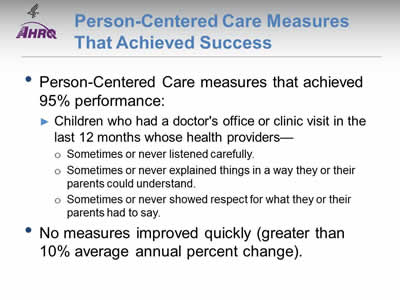
Person-Centered Care Measures That Achieved Success
- Person-Centered Care measures that achieved 95% performance:
- Children who had a doctor's office or clinic visit in the last 12 months whose health providers—
- Sometimes or never listened carefully.
- Sometimes or never explained things in a way they or their parents could understand.
- Sometimes or never showed respect for what they or their parents had to say.
- Children who had a doctor's office or clinic visit in the last 12 months whose health providers—
- No measures improved quickly (greater than 10% average annual percent change).
Note: Measures that achieve 95% performance will no longer be reported in the chartbook. The measures will continue to be tracked and can be found in the QDR data query system.
Slide 10
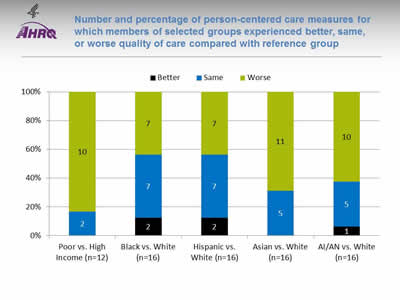
Number and percentage of person-centered care measures for which members of selected groups experienced better, same, or worse quality of care compared with reference group
Image: Chart shows number and percentage of person-centered care measures for which members of selected groups experienced better, same, or worse quality of care:
| Poor vs. High Income (n=12) | Black vs. White (n=16) | Hispanic vs. White (n=16) | Asian vs. White (n=16) | AI/AN vs. White (n=16) | |
|---|---|---|---|---|---|
| Better | 2 | 2 | 1 | ||
| Same | 2 | 7 | 7 | 5 | 5 |
| Worse | 10 | 7 | 7 | 11 | 10 |
Key: n = number of measures; AI/AN = American Indian or Alaska Native.
Notes: Poor indicates family income less than the Federal poverty level; High Income indicates family income four times the Federal poverty level or greater. Numbers of measures differ across groups because of sample size limitations. For most measures, data from 2012 are shown.
The relative difference between a selected group and its reference group is used to assess disparities.
- Better = Population received better quality of care than reference group. Differences are statistically significant, are equal to or larger than 10%, and favor the selected group.
- Same = Population and reference group received about the same quality of care. Differences are not statistically significant or are smaller than 10%.
- Worse = Population received worse quality of care than reference group. Differences are statistically significant, are equal to or larger than 10%, and favor the reference group.
- For 83% of person-centered care measures, people in poor households received worse care than people in high-income households.
- Racial and ethnic disparities in person-centered care were also common.
Slide 11
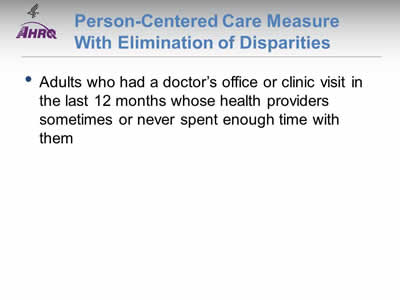
Person-Centered Care Measure With Elimination of Disparities
- Adults who had a doctor’s office or clinic visit in the last 12 months whose health providers sometimes or never spent enough time with them.
Slide 12
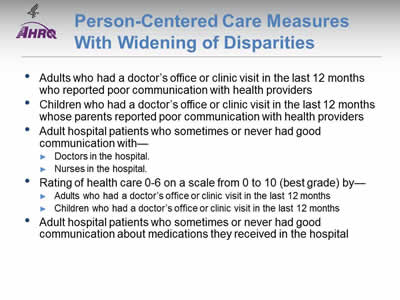
Person-Centered Care Measures With Widening of Disparities
- Adults who had a doctor’s office or clinic visit in the last 12 months who reported poor communication with health providers.
- Children who had a doctor’s office or clinic visit in the last 12 months whose parents reported poor communication with health providers.
- Adult hospital patients who sometimes or never had good communication with—
- Doctors in the hospital.
- Nurses in the hospital.
- Rating of health care 0-6 on a scale from 0 to 10 (best grade) by—
- Adults who had a doctor's office or clinic visit in the last 12 months.
- Children who had a doctor's office or clinic visit in the last 12 months.
- Adult hospital patients who sometimes or never had good communication about medications they received in the hospital.
Notes: The measures of poor communication for adults and children are composites of four measures, all of which individually showed widening of disparities:
- Adults [Children] who had a doctor’s office or clinic visit in the last 12 months whose health providers sometimes or never listened carefully to them.
- Adults [Children] who had a doctor’s office or clinic visit in the last 12 months whose health providers sometimes or never explained things in a way they could understand.
- Adults [Children] who had a doctor’s office or clinic visit in the last 12 months whose health providers sometimes or never showed respect for what they had to say.
- Adults [Children] who had a doctor’s office or clinic visit in the last 12 months whose health providers sometimes or never spent enough time with them.
The last two measures are not included in this chartbook. Data are available through the QDR data query system.
Slide 13
Measures of Person- and Family- Centered Care
- The National Healthcare Quality and Disparities Report tracks a growing number of person- and family-centered care measures, focusing on three aspects of care:
- Communication: doctor’s office, hospital, and home health care.
- Engagement in decisionmaking.
- End-of-life care.
Slide 14
Communication
- Optimal health care requires good communication between patients and providers, yet barriers to provider-patient communication are common.
- To provide all patients with the best possible care, providers need to understand patients’ diverse health care needs and preferences and communicate clearly with patients about their care.
Slide 15
Communication Measures: Doctor’s Office
- Adults who had a doctor’s office or clinic visit in the last 12 months who had poor communication with health providers.
- Children who had a doctor’s office or clinic visit in the last 12 months who had poor communication with health providers.
- Adults who had a hard time understanding their doctor during their last visit who reported language was the reason.
Slide 16
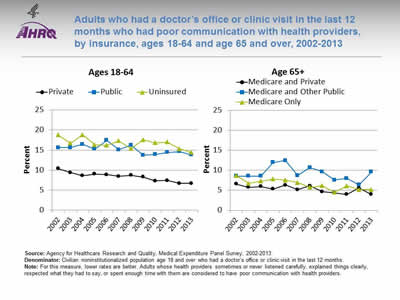
Adults who had a doctor’s office or clinic visit in the last 12 months who had poor communication with health providers, by insurance, ages 18-64 and age 65 and over, 2002-2013
Image: Charts show adults who had a doctor’s office or clinic visit in the last 12 months who had poor communication with health providers:
Left Chart (Ages 18-64):
| Insurance | 2002 | 2003 | 2004 | 2005 | 2006 | 2007 | 2008 | 2009 | 2010 | 2011 | 2012 | 2013 |
|---|---|---|---|---|---|---|---|---|---|---|---|---|
| Private | 10.4 | 9.4 | 8.6 | 9.0 | 8.9 | 8.4 | 8.7 | 8.3 | 7.3 | 7.4 | 6.7 | 6.7 |
| Public | 15.6 | 15.6 | 16.4 | 15.3 | 17.4 | 15.1 | 16.2 | 13.7 | 13.9 | 14.4 | 14.6 | 13.8 |
| Uninsured | 18.8 | 16.7 | 18.8 | 16.4 | 16.2 | 17.3 | 15.3 | 17.6 | 16.8 | 17.0 | 15.3 | 14.4 |
Right Chart (Age 65+):
| Insurance | 2002 | 2003 | 2004 | 2005 | 2006 | 2007 | 2008 | 2009 | 2010 | 2011 | 2012 | 2013 |
|---|---|---|---|---|---|---|---|---|---|---|---|---|
| Medicare Only | 8.7 | 6.8 | 7.3 | 7.8 | 7.6 | 7.0 | 5.7 | 6.2 | 4.5 | 6.1 | 5.2 | 5.2 |
| Medicare and Private | 6.6 | 5.8 | 6.0 | 5.3 | 6.3 | 5.2 | 6.1 | 4.7 | 4.4 | 4.0 | 5.6 | 4.0 |
| Medicare and Other Public | 8.6 | 8.6 | 8.6 | 12.0 | 12.5 | 8.7 | 10.7 | 9.6 | 7.6 | 8.0 | 6.4 | 9.6 |
Source: Agency for Healthcare Research and Quality, Medical Expenditure Panel Survey, 2002-2013.
Denominator: Civilian noninstitutionalized population age 18 and over who had a doctor’s office or clinic visit in the last 12 months.
Notes: For this measure, lower rates are better. Adults whose health providers sometimes or never listened carefully, explained things clearly, respected what they had to say, or spent enough time with them are considered to have poor communication with health providers.
- Overall Rate: The percentage of adults who had a doctor’s office or clinic visit in the last 12 months who had poor communication with health care providers decreased over time.
- Trends: From 2002 to 2013, the percentage of adults who had poor communication with health providers significantly decreased among all groups except Medicare and other public insurance.
- Adults ages 18-64:
- Private insurance: 10.4% to 6.7%.
- Public insurance: 15.6% to 13.8%.
- No insurance: 18.8% to 14.4%.
- Adults age 65 and over:
- Medicare and private insurance: 6.6% to 4.0%.
- Medicare only: 8.7% to 5.2%.
- Adults ages 18-64:
- Groups With Disparities:
- In all years from 2002 to 2013, adults ages 18-64 who had public insurance or were uninsured were more likely than those with private insurance to have poor communication with their health providers.
- Between 2002 and 2013, among adults ages 18-64, the gap grew between those with public insurance and those with private insurance, indicating worsening disparities.
- In 9 of 12 years, adults age 65 and over with Medicare and other public insurance were more likely than those with private insurance to have poor communication with their health providers.
Slide 17
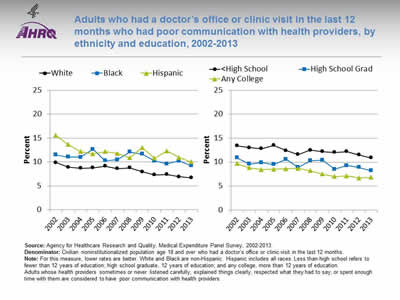
Adults who had a doctor’s office or clinic visit in the last 12 months who had poor communication with health providers, by ethnicity and education, 2002-2013
Image: Charts show adults who had a doctor’s office or clinic visit in the last 12 months who had poor communication with health providers:
Left Chart:
| Ethnicity | 2002 | 2003 | 2004 | 2005 | 2006 | 2007 | 2008 | 2009 | 2010 | 2011 | 2012 | 2013 |
|---|---|---|---|---|---|---|---|---|---|---|---|---|
| White | 9.8 | 8.9 | 8.7 | 8.8 | 9.1 | 8.6 | 8.8 | 8.0 | 7.3 | 7.4 | 6.9 | 6.7 |
| Black | 11.5 | 11.0 | 11.0 | 12.7 | 10.3 | 10.5 | 12.1 | 11.7 | 10.2 | 9.6 | 10.2 | 9.2 |
| Hispanic | 15.6 | 13.6 | 12.2 | 11.7 | 12.2 | 11.8 | 10.9 | 13.0 | 10.8 | 12.3 | 10.9 | 10.0 |
Right Chart:
| Education | 2002 | 2003 | 2004 | 2005 | 2006 | 2007 | 2008 | 2009 | 2010 | 2011 | 2012 | 2013 |
|---|---|---|---|---|---|---|---|---|---|---|---|---|
| Any College | 9.7 | 8.8 | 8.4 | 8.5 | 8.6 | 8.7 | 8.2 | 7.5 | 7.0 | 7.1 | 6.7 | 6.8 |
| High School Grad | 10.9 | 9.6 | 9.9 | 9.5 | 10.6 | 8.9 | 10.3 | 10.4 | 8.5 | 9.3 | 8.9 | 8.2 |
| Less than High School | 13.4 | 13.0 | 12.8 | 13.5 | 12.4 | 11.6 | 12.5 | 12.2 | 12.0 | 12.2 | 11.5 | 10.9 |
Source: Agency for Healthcare Research and Quality, Medical Expenditure Panel Survey, 2002-2013.
Denominator: Civilian noninstitutionalized population age 18 and over who had a doctor’s office or clinic visit in the last 12 months.
Notes: For this measure, lower rates are better. White and Black are non-Hispanic. Hispanic includes all races. Less than high school refers to fewer than 12 years of education; high school graduate, 12 years of education; and any college, more than 12 years of education. Adults whose health providers sometimes or never listened carefully, explained things clearly, respected what they had to say, or spent enough time with them are considered to have poor communication with health providers.
- Trends: From 2002 to 2013, the percentage of adults who had poor communication with health providers significantly decreased for all ethnic groups and all education groups.
- Ethnicity:
- Whites: 9.8% to 6.7%.
- Blacks: 11.5% to 9.2%.
- Hispanics: 15.6% to 10.0%.
- Education:
- Less than high school: 13.4% to 10.9%.
- High school graduate: 10.9% to 8.2%.
- Any college: 9.7% to 6.8%.
- Ethnicity:
- Groups With Disparities:
- In all years from 2002 to 2013, Hispanics and Blacks were significantly more likely than Whites to have poor communication with their health providers.
- In 10 of 12 years, high school graduates were more likely than those with any college to have poor communications with their health providers.
- In 2013, adults with less than a high school education and high school graduates were significantly more likely to have poor communication with their health providers than those with any college education.
- The gap is widening between adults with any college education and those with less than a high school education and high school graduates, indicating worsening disparities.
Slide 18
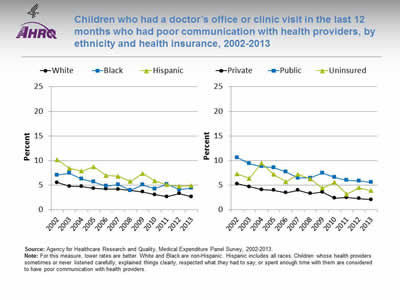
Children who had a doctor’s office or clinic visit in the last 12 months who had poor communication with health providers, by ethnicity and health insurance, 2002-2013
Image: Charts show children who had a doctor’s office or clinic visit in the last 12 months who had poor communication with health providers:
Left Chart:
| Ethnicity | 2002 | 2003 | 2004 | 2005 | 2006 | 2007 | 2008 | 2009 | 2010 | 2011 | 2012 | 2013 |
|---|---|---|---|---|---|---|---|---|---|---|---|---|
| White | 5.6 | 4.8 | 4.8 | 4.4 | 4.2 | 4.2 | 4.0 | 3.6 | 3.1 | 2.7 | 3.3 | 2.7 |
| Black | 7.1 | 7.5 | 6.3 | 5.7 | 4.8 | 5.1 | 4.0 | 5.1 | 4.3 | 5.2 | 4.1 | 4.4 |
| Hispanic | 10.2 | 8.4 | 7.9 | 8.8 | 7.0 | 6.8 | 5.8 | 7.4 | 5.9 | 5.1 | 4.8 | 4.9 |
Right Chart:
| Insurance | 2002 | 2003 | 2004 | 2005 | 2006 | 2007 | 2008 | 2009 | 2010 | 2011 | 2012 | 2013 |
|---|---|---|---|---|---|---|---|---|---|---|---|---|
| Uninsured | 7.3 | 6.4 | 9.5 | 7.2 | 5.7 | 7.2 | 6.3 | 4.4 | 5.6 | 3.2 | 4.5 | 3.9 |
| Public | 10.6 | 9.4 | 8.8 | 8.6 | 7.7 | 6.5 | 6.5 | 7.5 | 6.6 | 6.0 | 5.9 | 5.6 |
| Private | 5.3 | 4.7 | 4.1 | 4.0 | 3.5 | 4.0 | 3.3 | 3.6 | 2.4 | 2.5 | 2.3 | 2.1 |
Source: Agency for Healthcare Research and Quality, Medical Expenditure Panel Survey, 2002-2013.
Notes: For this measure, lower rates are better. White and Black are non-Hispanic. Hispanic includes all races. Children whose health providers sometimes or never listened carefully, explained things clearly, respected what they had to say, or spent enough time with them are considered to have poor communication with health providers.
- Trends: From 2002 to 2013, the percentage of children whose parents reported poor communication with health providers significantly decreased for all ethnic groups and health insurance groups.
- Ethnicity:
- Whites: 5.6% to 2.7%.
- Blacks: 7.1% to 4.4%.
- Hispanics: 10.2% to 4.9%.
- Health insurance status:
- Private: 5.3% to 2.1%.
- Public: 10.6% to 5.6%.
- Uninsured: 7.3% to 3.9%.
- Ethnicity:
- Groups With Disparities:
- In all years from 2002 to 2013, Hispanic children were significantly more likely than White children to have poor communications with their health providers.
- In 2013, Hispanic children and Black children were significantly more likely than White children to report poor communication with their health care providers.
- In all years, parents of children with public insurance were more likely than parents of children with private insurance to report poor communication.
Slide 19
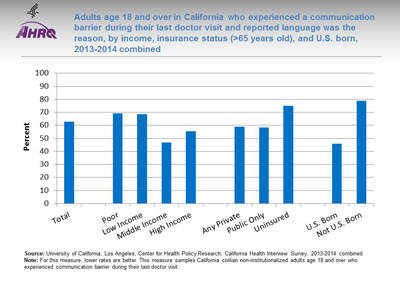
Adults age 18 in California and over who experienced a communication barrier during their last doctor visit and reported language was the reason, by income, insurance status (>65 years old), and U.S. born, 2013-2014 combined
Image: Chart shows Adults age 18 and over who had a hard time understanding their doctor during their last visit and reported language was the reason:
- Total - 63.
- Poor - 69.1.
- Low Income - 68.6.
- Middle Income - 46.8.
- High Income - 55.5.
- Any Private - 59.1.
- Public Only - 58.5.
- Uninsured - 75.
- U.S. Born - 46.
- Not U.S. Born - 78.8.
Source: University of California, Los Angeles, Center for Health Policy Research, California Health Interview Survey, 2013-2014 combined.
Notes: For this measure, lower rates are better. This measure samples California civilian noninstitutionalized adults age 18 and over who experienced communication barrier during their last doctor visit.
- Groups With Disparities:
- Among all adults who reported difficulty understanding their doctor during their last visit, the percentage who reported language was the reason was higher for individuals who were not born in the United States compared with those who were born in the United States.
- There were no statistically significant differences by income or insurance.
Slide 20
Communication Measures: Hospital
- Adult hospital patients who reported poor communication with doctors and nurses.
Slide 21
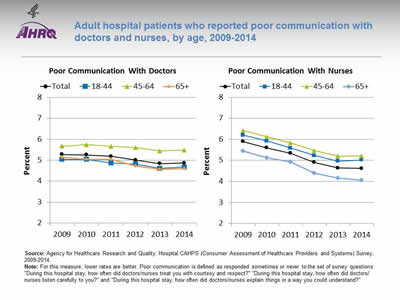
Adult hospital patients who reported poor communication with doctors and nurses, by age, 2009-2014
Image: Charts show adult hospital patients who reported poor communication with doctors and nurses:
Left Chart (Poor Communication With Doctors):
| Age | 2009 | 2010 | 2011 | 2012 | 2013 | 2014 |
|---|---|---|---|---|---|---|
| Total | 5.3 | 5.3 | 5.2 | 5.0 | 4.8 | 4.9 |
| 18-44 | 5.0 | 5.0 | 4.9 | 4.8 | 4.6 | 4.7 |
| 45-64 | 5.7 | 5.7 | 5.7 | 5.6 | 5.4 | 5.5 |
| 65+ | 5.1 | 5.0 | 5.0 | 4.7 | 4.6 | 4.6 |
Right Chart (Poor Communication With Nurses):
| Age | 2009 | 2010 | 2011 | 2012 | 2013 | 2014 |
|---|---|---|---|---|---|---|
| Total | 5.9 | 5.6 | 5.3 | 4.9 | 4.6 | 4.6 |
| 18-44 | 6.2 | 5.9 | 5.6 | 5.2 | 5.0 | 5.0 |
| 45-64 | 6.4 | 6.1 | 5.8 | 5.5 | 5.2 | 5.2 |
| 65+ | 5.4 | 5.1 | 4.9 | 4.4 | 4.2 | 4.1 |
Source: Agency for Healthcare Research and Quality, Hospital CAHPS® (Consumer Assessment of Healthcare Providers and Systems) Survey, 2009-2014.
Notes: For this measure, lower rates are better. Poor communication is defined as responded sometimes or never to the set of survey questions: "During this hospital stay, how often did doctors/nurses treat you with courtesy and respect?" "During this hospital stay, how often did doctors/nurses listen carefully to you?" and "During this hospital stay, how often did doctors/nurses explain things in a way you could understand?"
- Overall Rate: The percentage of patients reporting poor communication with doctors and nurses has decreased over time.
- Trends: From 2009 to 2014, the percentage of patients reporting poor communication significantly decreased among all age groups.
- Communication with doctors:
- 18-44 years: 5.0% to 4.7%.
- 45-64 years: 5.7% to 5.5%.
- 65 and over: 5.1% to 4.6%.
- Communication with nurses:
- 18-44 years: 6.2% to 5.0%.
- 45-64 years: 6.4% to 5.2%.
- 65 and over: 5.4% to 4.1%.
- Communication with doctors:
- Groups With Disparities:
- In 2014, hospital patients ages 45-64 years were significantly more likely to report poor communication with doctors compared with patients ages 18-44 years. There was no statistically significant difference between patients age 65 and over and those ages 18-44.
- In 2014, hospital patients age 65 and over were significantly less likely to report poor communication with nurses compared with patients ages 18-44 years. There was no statistically significant difference between patients ages 45-64 years and those ages 18-44.
Slide 22
Communication Measures: Home Health Care
- Provider-patient communication among adults receiving home health care.
Slide 23
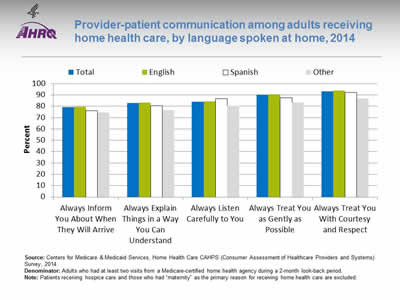
Provider-patient communication among adults receiving home health care, by language spoken at home, 2014
Image: Chart shows provider-patient communication among adults receiving home health care, by language spoken at home:
| Language | Always Inform You About When They Will Arrive | Always Explain Things in a Way You Can Understand | Always Listen Carefully to You | Always Treat You as Gently as Possible | Always Treat You With Courtesy and Respect |
|---|---|---|---|---|---|
| Total | 79.2 | 82.7 | 84.0 | 90.1 | 93.2 |
| English | 79.8 | 83.4 | 84.4 | 90.7 | 93.9 |
| Other | 74.4 | 76.7 | 80.4 | 83.3 | 86.8 |
| Spanish | 76.1 | 80.6 | 86.6 | 87.6 | 92.4 |
Source: Centers for Medicare & Medicaid Services, Home Health Care CAHPS® (Consumer Assessment of Healthcare Providers and Systems) Survey, 2014.
Denominator: Adults who had at least two visits from a Medicare-certified home health agency during a 2-month look-back period.
Notes: Patients receiving hospice care and those who had "maternity" as the primary reason for receiving home health care are excluded.
- Groups With Disparities:
- In 2014, compared with English speakers, adults speaking Spanish or another language at home were significantly less likely to:
- Always be informed about when their provider would arrive.
- Always have things explained in a way that was easy to understand.
- Always be treated as gently as possible.
- Always be treated with courtesy and respect.
- Adults speaking a language other than English or Spanish were less likely than adults speaking English at home to report that home health providers always listened carefully to them.
- Adults speaking Spanish at home were more likely than adults speaking English at home to report that home health providers always listened carefully to them.
- In 2014, compared with English speakers, adults speaking Spanish or another language at home were significantly less likely to:
Slide 24
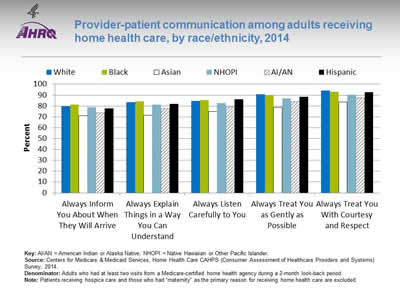
Provider-patient communication among adults receiving home health care, by race/ethnicity, 2014
Image: Chart shows provider-patient communication among adults receiving home health care:
| Race / Ethnicity | Always Inform You About When They Will Arrive | Always Explain Things in a Way You Can Understand | Always Listen Carefully to You | Always Treat You as Gently as Possible | Always Treat You With Courtesy and Respect |
|---|---|---|---|---|---|
| AI/AN | 73.8 | 77.6 | 79.1 | 84.2 | 87.7 |
| Asian | 70.9 | 71.6 | 75.1 | 78.8 | 83.8 |
| Black | 81.2 | 84.1 | 85.6 | 89.6 | 92.9 |
| NHOPI | 79.0 | 81.1 | 82.9 | 87.0 | 90.5 |
| White | 79.7 | 83.5 | 84.7 | 91.0 | 94.1 |
| Hispanic | 77.8 | 82.1 | 86.1 | 88.4 | 92.6 |
Key: AI/AN = American Indian or Alaska Native; NHOPI = Native Hawaiian or Other Pacific Islander.
Source: Centers for Medicare & Medicaid Services, Home Health Care CAHPS® (Consumer Assessment of Healthcare Providers and Systems) Survey, 2014.
Denominator: Adults who had at least two visits from a Medicare-certified home health agency during a 2-month look-back period.
Notes: Patients receiving hospice care and those who had "maternity" as the primary reason for receiving home health care are excluded.
- Groups With Disparities: In 2014, among home health care patients, compared with Whites:
- Asians and American Indians and Alaska Natives (AI/ANs) were significantly less likely to always be informed about when their provider would arrive.
- Asians, AI/ANs, and Native Hawaiians and Other Pacific Islanders (NHOPIs) were significantly less likely to always have things explained in a way that was easy to understand.
- Asians, AI/ANs, and NHOPIs were significantly less likely to always be listened to carefully. Hispanics were more likely to always be listened to carefully.
- Blacks, Asians, NHOPIs, AI/ANs, and Hispanics were significantly less likely to always be treated as gently as possible.
- Blacks, Asians, NHOPIs, AI/ANs, and Hispanics were significantly less likely to always be treated with courtesy and respect.
Slide 25
Engagement in Decisionmaking
- The increasing prevalence of chronic diseases has placed more responsibility on patients, since conditions such as diabetes and hypertension require self-management.
- Patients need to be provided with information that allows them to make educated decisions and feel engaged in their treatment.
- Treatment plans also need to incorporate patients’ values and preferences.
Slide 26
Measures of Engagement in Decisionmaking: Providers Asking Patients To Assist in Making Treatment Decisions
- People with a usual source of care who sometimes or never asked the person to help make decisions when there was a choice between treatments.
Slide 27
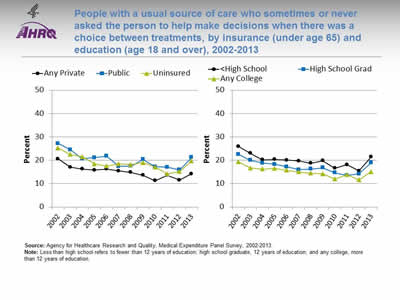
People with a usual source of care who sometimes or never asked the person to help make decisions when there was a choice between treatments, by insurance (under age 65) and education (age 18 and over), 2002-2013
Image: Charts show people with a usual source of care who sometimes or never asked the person to help make decisions when there was a choice between treatments:
Left Chart:
| Insurance | 2002 | 2003 | 2004 | 2005 | 2006 | 2007 | 2008 | 2009 | 2010 | 2011 | 2012 | 2013 |
|---|---|---|---|---|---|---|---|---|---|---|---|---|
| Any Private | 20.6 | 17 | 16.2 | 15.8 | 16.2 | 15.4 | 14.8 | 13.6 | 11.3 | 13.6 | 11.5 | 14.2 |
| Public | 27.2 | 24.5 | 20.6 | 21.1 | 21.8 | 17.4 | 17.5 | 20.3 | 17.2 | 17 | 15.9 | 21.2 |
| Uninsured | 25.2 | 22.5 | 21.5 | 18.5 | 17.5 | 18.5 | 18.1 | 19 | 17 | 14.2 | 15.2 | 19.7 |
Right Chart:
| Education | 2002 | 2003 | 2004 | 2005 | 2006 | 2007 | 2008 | 2009 | 2010 | 2011 | 2012 | 2013 |
|---|---|---|---|---|---|---|---|---|---|---|---|---|
| Less than High School | 25.9 | 23 | 20.2 | 20.3 | 20.1 | 19.7 | 18.7 | 19.8 | 16.6 | 18.1 | 15.4 | 21.4 |
| High School Grad | 22.6 | 20 | 18.8 | 18.3 | 17.2 | 16 | 16.2 | 16.8 | 14.6 | 13.5 | 14.2 | 18.9 |
| Any College | 19.4 | 16.7 | 16.2 | 16.5 | 15.7 | 15 | 14.5 | 14.2 | 12 | 13.8 | 11.6 | 15.1 |
Source: Agency for Healthcare Research and Quality, Medical Expenditure Panel Survey, 2002-2013.
Notes: Less than high school refers to fewer than 12 years of education; high school graduate, 12 years of education; and any college, more than 12 years of education.
- Trends: From 2002 to 2013, the percentage of people with a usual source care who sometimes or never asked the person to help make treatment decisions significantly decreased for all insurance groups (under age 65) and education groups (age 18 and over).
- Insurance:
- Any private: 20.6% to 14.2%.
- Public: 27.2% to 21.2%.
- Uninsured: 25.2% to 19.7%.
- Education:
- Less than high school: 25.9% to 21.4%.
- High school graduate: 22.6% to 18.9%.
- Any college: 19.4% to 15.1%.
- Insurance:
- Groups With Disparities:
- In 2013, among adults ages 18-64, those who were uninsured and those with public insurance were more likely than those with private insurance to report that their health providers sometimes or never asked for their help to make treatment decisions.
- In 2013, adults with less than a high school education and high school graduates were more likely than those with any college education to report that their health providers sometimes or never asked for their help to make treatment decisions.
- In all years from 2002 to 2013, among adults age 18 and over, those with less than a high school education were significantly more likely than those with any college education to have a usual source of care who sometimes or never asked the person to help make treatment decisions.
Slide 28
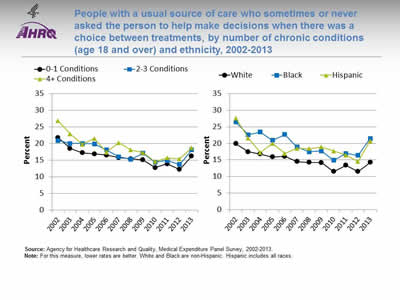
People with a usual source of care who sometimes or never asked the person to help make decisions when there was a choice between treatments, by number of chronic conditions (age 18 and over) and ethnicity, 2002-2013
Image: Charts show people with a usual source of care who sometimes or never asked the person to help make decisions when there was a choice between treatments:
Left Chart:
| # of chronic conditions | 2002 | 2003 | 2004 | 2005 | 2006 | 2007 | 2008 | 2009 | 2010 | 2011 | 2012 | 2013 |
|---|---|---|---|---|---|---|---|---|---|---|---|---|
| 0-1 Conditions | 21.8 | 18.5 | 17.2 | 16.9 | 16.5 | 15.8 | 15.4 | 15.1 | 12.8 | 13.9 | 12.2 | 16.2 |
| 2-3 Conditions | 20.9 | 20 | 20 | 19.9 | 18.1 | 16 | 15.3 | 17.1 | 14.4 | 14.9 | 13.7 | 18.1 |
| 4+ Conditions | 26.8 | 22.9 | 19.8 | 21.5 | 17.4 | 20.3 | 18.1 | 17.3 | 14.6 | 15.7 | 15.4 | 18.7 |
Right Chart:
| Ethnicity | 2002 | 2003 | 2004 | 2005 | 2006 | 2007 | 2008 | 2009 | 2010 | 2011 | 2012 | 2013 |
|---|---|---|---|---|---|---|---|---|---|---|---|---|
| White | 19.9 | 17.5 | 16.8 | 15.9 | 16.1 | 14.5 | 14.3 | 14.2 | 11.5 | 13.4 | 11.5 | 14.3 |
| Black | 26.4 | 22.6 | 23.4 | 20.9 | 22.7 | 18.9 | 17.5 | 17.7 | 14.9 | 17 | 16.4 | 21.5 |
| Hispanic | 27.6 | 21.6 | 17.2 | 20 | 17 | 18.5 | 18.4 | 18.9 | 17.7 | 16.5 | 14.5 | 20.7 |
Source: Agency for Healthcare Research and Quality, Medical Expenditure Panel Survey, 2002-2013.
Notes: For this measure, lower rates are better. White and Black are non-Hispanic. Hispanic includes all races.
- Trends: From 2002 to 2013, the percentage of people with a usual source of care who sometimes or never asked the person to help make treatment decisions significantly decreased for all chronic condition and ethnicity groups.
- Number of chronic conditions:
- 0-1 chronic conditions: 21.8% to 16.2%.
- 2-3 chronic conditions: 20.9% to 18.1%.
- 4+ chronic conditions: 26.8% to 18.7%.
- Ethnicity:
- Whites: 19.9% to 14.3%.
- Blacks: 26.4% to 21.5%.
- Hispanics: 27.6% to 20.7%.
- Number of chronic conditions:
- Groups With Disparities:
- In 2013, among adults age 18 and over with a usual source of care, people with 4 or more chronic conditions were significantly less likely than those with 0 or 1 condition to be involved in their treatment decisions.
- In all years from 2002 to 2013, among people with a usual source of care, Blacks were more likely than Whites to be involved in their treatment decisions.
- In all but 2 years from 2002 to 2013, among people with a usual source of care, Hispanics were more likely than Whites to be involved in their treatment decisions.
Slide 29
End-of-Life Care
- Hospice care is generally delivered at the end of life to patients with a terminal illness or condition who want palliative medical care.
- Hospice care also includes practical, psychosocial, and spiritual support for the patient and family.
- The goal of end-of-life care is to achieve a “good death,” defined by the Institute of Medicine as:
...free from avoidable distress and suffering for patients, families, and caregivers; in general accord with the patients’ and families’ wishes; and reasonably consistent with clinical, cultural, and ethical standards (Field & Cassell, 1997).
Note: On March 15, 2016, the division of the National Academies of Sciences, Engineering, and Medicine that focuses on health and medicine was renamed the Health and Medicine Division instead of using the name Institute of Medicine.
Slide 30
End-of-Life Care Measures
- Hospice patients who received care consistent with their stated end-of-life wishes.
- Hospice patients who received the right amount of help for feelings of anxiety or sadness.
Slide 31
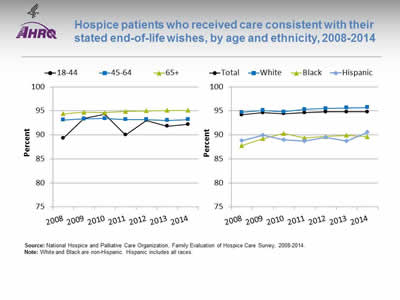
Hospice patients who received care consistent with their stated end-of-life wishes, by age and ethnicity, 2008-2014
Image: Charts show hospice patients who received care consistent with their stated end-of-life wishes:
Left Chart:
| Age | 2008 | 2009 | 2010 | 2011 | 2012 | 2013 | 2014 |
|---|---|---|---|---|---|---|---|
| 18-44 | 89.3 | 93.4 | 94.3 | 90 | 93 | 91.8 | 92.2 |
| 45-64 | 93.1 | 93.3 | 93.4 | 93.2 | 93.2 | 93 | 93.2 |
| 65+ | 94.4 | 94.7 | 94.6 | 94.9 | 95 | 95.1 | 95.1 |
Right Chart:
| Ethnicity | 2008 | 2009 | 2010 | 2011 | 2012 | 2013 | 2014 |
|---|---|---|---|---|---|---|---|
| Total | 94.2 | 94.6 | 94.4 | 94.6 | 94.8 | 94.8 | 94.8 |
| White | 94.7 | 95.1 | 94.8 | 95.3 | 95.5 | 95.6 | 95.7 |
| Black | 87.8 | 89.2 | 90.3 | 89.4 | 89.7 | 89.9 | 89.6 |
| Hispanic | 88.8 | 89.9 | 89 | 88.7 | 89.5 | 88.7 | 90.5 |
Source: National Hospice and Palliative Care Organization, Family Evaluation of Hospice Care Survey, 2008-2014.
Notes: White and Black are non-Hispanic. Hispanic includes all races.
- Overall Rate: In 2014, nearly all (94.8%) of hospice patients received care consistent with their stated end-of-life wishes.
- Trends:
- From 2008 to 2014, the percentage of hospice patients age 65 and over who received care consistent with their stated end-of-life wishes improved from 94.4% to 95.1%. There were no statistically significant changes for those age 18-44 and ages 45-64.
- From 2008 to 2014, the percentage of White hospice patients who received care consistent with their stated end-of-life wishes improved from 94.7% to 95.7%. There were no statistically significant changes among Blacks and Hispanics.
- Groups With Disparities:
- In 2014, hospice patients age 65 and over were significantly more likely than patients ages 18-44 to receive care consistent with their stated end-of-life wishes.
- In 2014, Black and Hispanic hospice patients were significantly less likely than White patients to receive care consistent with their stated end-of-life wishes.
Slide 32
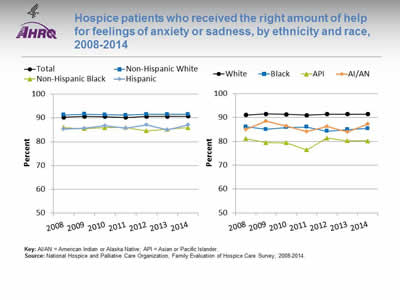
Hospice patients who received the right amount of help for feelings of anxiety or sadness, by ethnicity and race, 2008-2014
Image: Charts show hospice patients who received the right amount of help for feelings of anxiety or sadness:
Left Chart:
| Ethnicity | 2008 | 2009 | 2010 | 2011 | 2012 | 2013 | 2014 |
|---|---|---|---|---|---|---|---|
| Total | 90.3 | 90.6 | 90.5 | 90.2 | 90.6 | 90.6 | 90.7 |
| Non-Hispanic White | 91.2 | 91.6 | 91.3 | 91.1 | 91.5 | 91.5 | 91.5 |
| Non-Hispanic Black | 86 | 85.5 | 85.9 | 86 | 84.6 | 85.2 | 85.9 |
| Hispanic | 85.3 | 85.7 | 86.8 | 85.7 | 87 | 85 | 87 |
Right Chart:
| Race | 2008 | 2009 | 2010 | 2011 | 2012 | 2013 | 2014 |
|---|---|---|---|---|---|---|---|
| AI/AN | 85 | 88.5 | 86.4 | 84.2 | 86.3 | 83.9 | 87.3 |
| API | 81.1 | 79.5 | 79.4 | 76.4 | 81.4 | 80.3 | 80.2 |
| Black | 86.1 | 85.1 | 85.8 | 86 | 84.3 | 85 | 85.4 |
| White | 91.1 | 91.5 | 91.3 | 91 | 91.4 | 91.4 | 91.4 |
Key: AI/AN = American Indian or Alaska Native; API = Asian or Pacific Islander.
Source: National Hospice and Palliative Care Organization, Family Evaluation of Hospice Care Survey, 2008-2014.
Notes:
- Trends: From 2008 to 2014, there were no statistically significant changes by ethnicity or race in the percentage of hospice patients who received the right amount of help for feelings of anxiety or sadness.
- Groups With Disparities:
- In 2014, Hispanics and non-Hispanic Blacks were significantly less likely than non-Hispanic Whites to receive the right amount of help for feelings of anxiety or sadness.
- Also in 2014, Blacks, Asians and Other Pacific Islanders, and AI/ANs were significantly less likely than Whites to receive the right amount of help for feelings of anxiety or sadness.
Slide 33
References
Field M, Cassell C, eds. Approaching death: improving care at the end of life. Washington, DC: National Academy Press; 1997.


