Adult ICUs
Section Summary
- Data from over 1,100 adult ICUs were examined.
- CLABSI rates were reduced from 1.915 at baseline to 1.133 at quarter six, a relative reduction of over 40 percent.
- Variability in relative reduction was found by cohort and hospital characteristics.
A total of 1,185 adult ICUs reported at least one data point. Units that formally withdrew were excluded (n=50)3, and units that never reported post-baseline data were excluded (n=11), resulting in a final analytic sample of 1,124 units. One unit did not report data between quarter one and quarter six but did report during quarters seven and eight. On average, units had less than one missing post-baseline quarter worth of data (mean=0.36; stdev=0.96; median=0).
Overall
Overall CLABSI rates over time can be found in Figure 8. Table 2 illustrates the number of units reporting for each time period. Figure 9 illustrates the percentage of units reporting a rate of zero (shown in dark blue) or less than one (shown in light blue) during each time period. At baseline 30 percent of units reported a rate of zero. At quarter six, this percentage more than doubled with 68 percent of units reporting a rate of zero. Summary results for all adult ICUs can be found in Table 3.
Figure 8. Adult ICU CLABSI rate overall over time
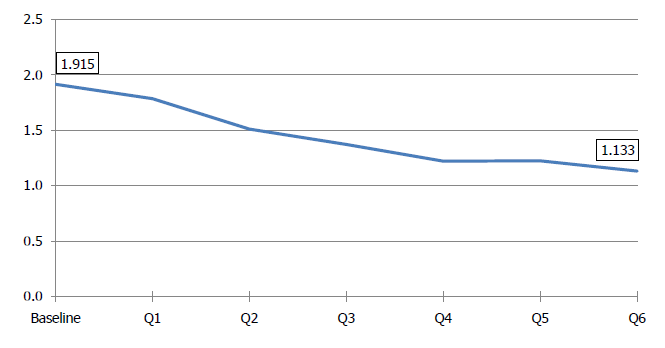
Table 2. Number of ICUs reporting data at each time point
| Baseline | Q1 | Q2 | Q3 | Q4 | Q5 | Q6 |
|---|---|---|---|---|---|---|
| 977 | 1,078 | 1,083 | 1,088 | 1,058 | 1,026 | 1,004 |
Figure 9. Percent of reporting ICU units with CLABSI rate of zero or less than one, all cohorts
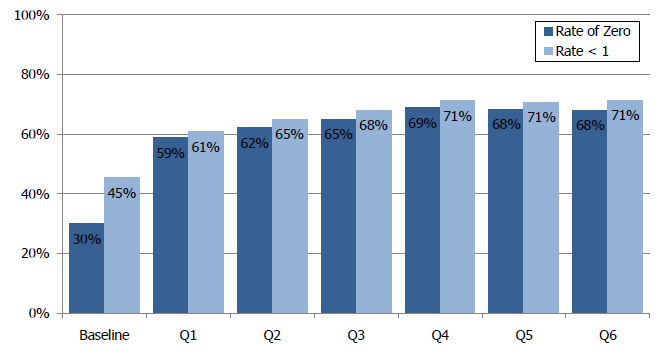
* Percentage of units calculated as number of units with a rate of zero or less than one divided by the total number of units reporting during the time period.
Table 3. Summary for adult ICU cohorts 1-6 through quarter 6
| Pre-Intervention | Post-Intervention | ||||||
|---|---|---|---|---|---|---|---|
| Baseline | Q1 | Q2 | Q3 | Q4 | Q5 | Q6 | |
| 12 Months | Months 1-3 |
Months 4-6 |
Months 7-9 |
Months 10-12 |
Months 13-15 |
Months 16-18 |
|
| Number of States Reporting | 46 | 45 | 46 | 46 | 46 | 45 | 44 |
| Number of Units Reporting | 977 | 1,078 | 1,083 | 1,088 | 1,058 | 1,026 | 1,004 |
| Average CLABSIs/Unit | 3.318 | 0.870 | 0.729 | 0.669 | 0.571 | 0.562 | 0.518 |
| Average CL Days/Unit | 1,733 | 487 | 483 | 488 | 467 | 459 | 457 |
| Rate: (Infections/Days)x1,000 |
1.915 | 1.785 | 1.511 | 1.372 | 1.221 | 1.225 | 1.133 |
| Relative Reduction | n/a | -7% | -21% | -28% | -36% | -36% | -41% |
By Cohort
Figure 10. CLABSI rate by cohort over time for adult ICUs
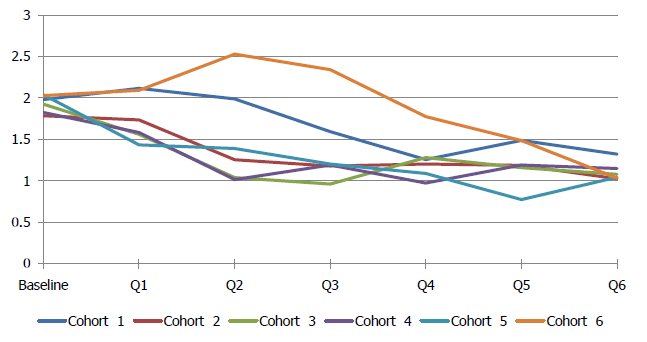
Table 4. Number of ICUs reporting data at each time point by cohort*
| Cohort | Baseline | Q1 | Q2 | Q3 | Q4 | Q5 | Q6 |
|---|---|---|---|---|---|---|---|
| Cohort 1 | 275 | 280 | 281 | 290 | 285 | 291 | 288 |
| Cohort 2 | 244 | 290 | 290 | 292 | 282 | 267 | 282 |
| Cohort 3 | 80 | 80 | 80 | 78 | 78 | 77 | 73 |
| Cohort 4 | 152 | 183 | 187 | 186 | 185 | 183 | 178 |
| Cohort 5 | 129 | 145 | 146 | 145 | 141 | 131 | 126 |
| Cohort 6 | 97 | 100 | 99 | 97 | 87 | 77 | 57 |
* Note: As of the October 15, 2012, extract, the sixth project quarter for cohort 6 had not concluded.
By Hospital Characteristics
Figure 11. Adult ICU CLABSI rate overall over time by hospital characteristic
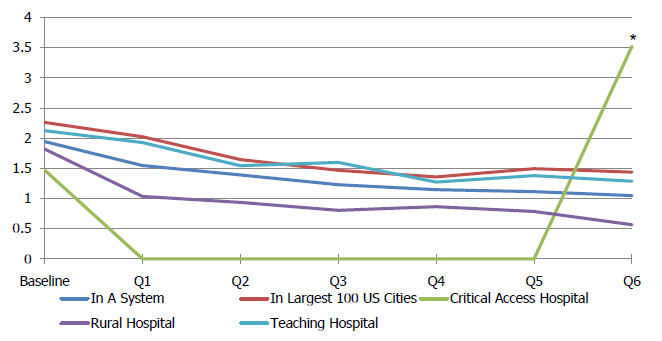
* Critical access hospitals (n=23) experienced one infection in 284 central line days (the lowest number of central line days reported during any quarter for critical access hospitals) resulting in a rate of 3.52 for quarter six.
Table 5. Number of ICUs reporting data at each time point by hospital characteristics
| Hospital Characteristics | Baseline | Q1 | Q2 | Q3 | Q4 | Q5 | Q6 |
|---|---|---|---|---|---|---|---|
| In A System | 584 | 622 | 624 | 624 | 609 | 594 | 575 |
| In Largest 100 US Cities | 220 | 229 | 230 | 228 | 226 | 228 | 212 |
| Critical Access Hospital | 19 | 21 | 21 | 22 | 22 | 22 | 19 |
| Rural Hospital | 155 | 180 | 183 | 183 | 178 | 172 | 165 |
| Teaching Hospital | 447 | 462 | 463 | 464 | 451 | 441 | 424 |
By Bed Size
Figure 12. Adult ICU CLABSI rate overall over time by hospital bed size
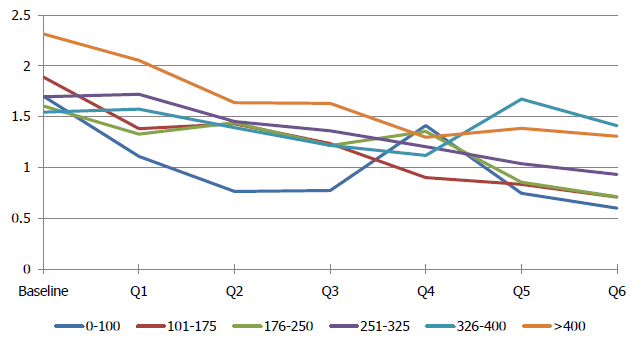
Table 6. Number of ICUs reporting data at each time point by hospital bed size
| Hospital Bed Size | Baseline | Q1 | Q2 | Q3 | Q4 | Q5 | Q6 | Q7 | Q8 |
|---|---|---|---|---|---|---|---|---|---|
| 0-100 | 116 | 138 | 140 | 141 | 141 | 139 | 133 | 121 | 106 |
| 101-175 | 135 | 148 | 151 | 148 | 144 | 137 | 134 | 113 | 96 |
| 176-250 | 132 | 137 | 137 | 133 | 127 | 122 | 111 | 93 | 80 |
| 251-325 | 113 | 119 | 119 | 119 | 113 | 109 | 104 | 98 | 89 |
| 326-400 | 99 | 102 | 102 | 106 | 99 | 96 | 94 | 86 | 68 |
| >400 | 278 | 286 | 286 | 288 | 285 | 283 | 270 | 250 | 233 |
3. This number does not reflect units that formally withdrew but had not submitted any data. For details regarding project withdrawal see Participation section.


