This section addresses the question, "Did the project work?" and describes project penetration, the impact of the project on reducing CLABSI rates, and estimates of lives saved and costs averted based on estimates of infections prevented. This section also summarizes findings related to units that submitted data on the Hospital Survey on Patient Safety Culture (HSOPS) and the Team Checkup Tool (TCT). A separate, data-related companion guide describes the data analysis methodologies and provides more detail regarding results.
Project Participation
A total of 44 States, the District of Columbia, and Puerto Rico participated in On the CUSP: Stop BSI. Collectively, these States and regions recruited more than 1,000 hospitals and 1,800 hospital units to participate in the project, representing over 25 percent of all adult ICUs in the nation. Twenty-three States began the project in 2009, 12 States and the District of Columbia began during 2010, and 9 States and Puerto Rico began the effort in 2011.
State Participation
Recruitment into the project was an ongoing process that began in fall 2008 and ended in summer 2011. Lead organizations in the States were encouraged to recruit as many teams of participants as they could and directed to recruit a minimum of 10 hospitals per State. The ongoing success of this program, awareness of impending Centers for Medicare & Medicaid Services (CMS) public reporting of CLABSI rates, and the 2011 requirement that hospitals submit CLABSI data into NHSN encouraged additional hospitals to enroll. Once States agreed to participate, they were placed into a project group or "cohort" along with other States beginning the project at the same time. Six cohorts, comprising 44 States, the District of Columbia, and Puerto Rico completed the project. Because some State hospital associations recruited hospitals at various periods, a State may have participated in more than one cohort. Although Michigan is not depicted as a formal project participant, Michigan hospitals continue to work with the MHA Keystone Center on sustaining the exceptionally low CLABSI rates they achieved in the initial MHA Keystone: ICU project.5,6 Figure 2 shows all States and hospitals registered in the project.
Figure 2. States & Hospitals Registered in CLABSI*
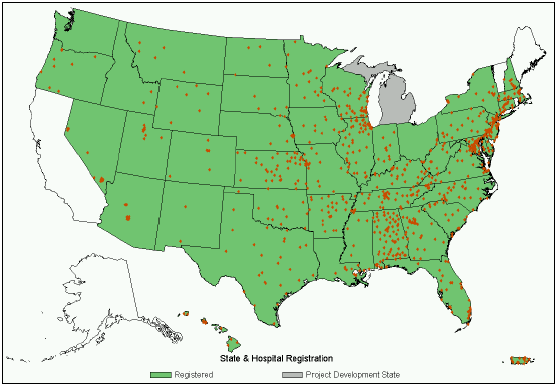
*Ohio and Washington State did not release the names of hospitals.
Hospital Participation
Levels of recruitment within States varied substantially. State and regional recruitment of hospitals ranged from 93.3 percent to 8.7 percent. Alabama, Delaware, Hawaii, and Maryland all had more than 50 percent of their hospitals participating in the project. Because some States have a higher percentage of very small hospitals that do not have an ICU or do not insert central lines, some variation in the percentage of hospitals in each State that may benefit from being involved in the project is to be expected.
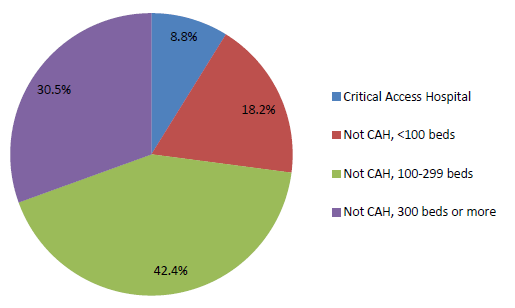
Figure 3 illustrates the proportion of participating hospitals by bed size. The majority of hospitals that participated in On the CUSP: Stop BSI had between 100 and 299 beds, a little over 42 percent. Critical Access Hospitals (CAH) comprised of 25 beds or fewer represented almost 9 percent, the smallest percentage of participating hospital type.
Figure 3. Hospital Participation by Bed Size
Hospital Unit Participation
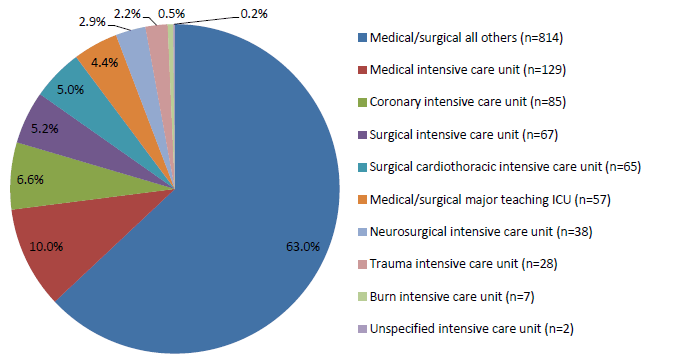
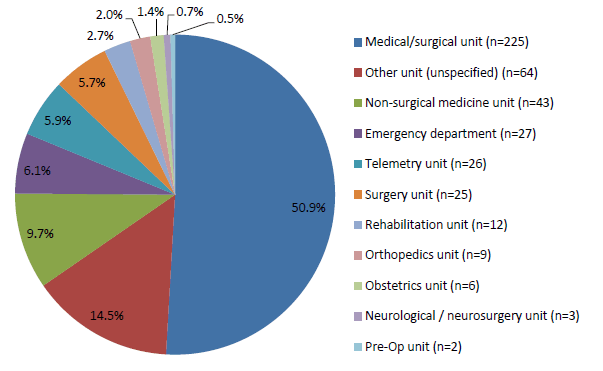
The majority of participating units were adult ICUs (71 percent), however some acute care, adult non-ICU and pediatric units also participated (24 percent and 5 percent respectively). Figure 4 and Figure 5 show the percentages of adult ICUs and adult non-ICUs by type, respectively.
Figure 4. Percentage of Adult ICUs by Type
Figure 5. Percentage of Adult Non-ICUs by Type
Project Results
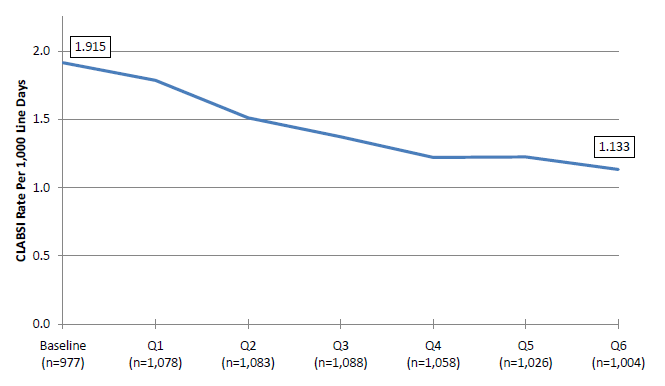
On the CUSP: Stop BSI succeeded in reducing CLABSIs nationwide. States reduced their adult ICU rate from a baseline of 1.915 infections per 1,000 line days to a rate of 1.133 infections, or a relative reduction of 41 percent. Figure 6 shows this reduction in adult ICU CLABSI rates overall over time. A total of 1,124 adult ICUs met inclusion criteria although some variability in data submission was found over time. A relatively small percentage of units with CLABSI rates over 3 per 1,000 central line days are the primary reason that the average CLABSI rate remains above 1.0. States that started with low CLABSI rates achieved additional improvements, again demonstrating that "getting to zero" was possible, a notion clinicians had not accepted until recently. Non-ICU and pediatric units had similar, impressive reductions in CLABSI rates.
Figure 6. Adult ICU CLABSI Rate Overall Over Time
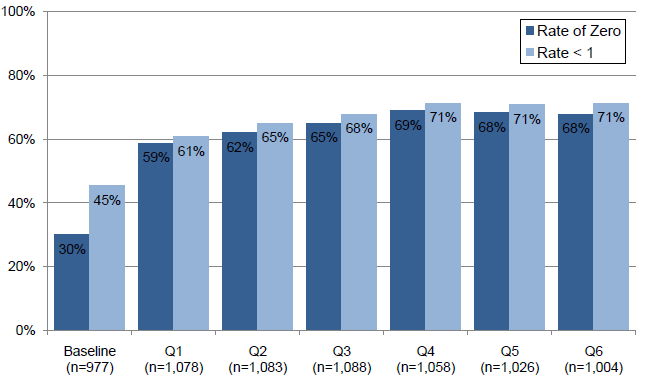
In addition to decreasing CLABSI rates overall over the course of the project, the percentage of ICUs reporting a rate of zero or less than one per 1,000 central line days increased over time from 30 percent to 68 percent. The percentage of ICUs reporting a rate of less than 1 per 1,000 central line days increased over time from 45 percent to 71 percent. Figure 7 presents the percentage of units that achieved a CLABSI rate of zero and the percentage of units that achieved a CLABSI rate of less than one.
Figure 7. Percentage of Reporting Units with CLABSI Rate of 0/1,000 or Less than 1/1,000 CL
Estimates of Infections Avoided, Lives Saved, and Costs Averted
The National Project Team (NPT) did a systematic review of the literature to arrive at a reasonable cost of CLABSI. Out of almost 850 abstracts and 150 articles, staff found 6 articles that met inclusion criteria. After weighting and adjusting to 2012 dollars, the average CLABSI cost reported in the literature was $70,696 with a range (± two standard deviations) of $40,412 to $100,980. Assuming that baseline rates would have remained stable without the study intervention, an estimated total of 2,187 to 2,419 CLABSIs were prevented over the course of the project. Assuming a 12-25 percent mortality rate, an estimated 290 to 605 deaths were prevented during the project. Lastly, an estimated $97,756,628 to $244,270,620 in excess costs were averted as well during this time period. This range is similar to the range reflected in the Johns Hopkins CLABSI Opportunity Estimator Web site (range of $40,000 to $117,000 per infection).7 Using the CDC estimate of $16,550 per CLABSI, $36,194,850 to $40,034,450 in excess costs were averted.
Other Findings
Hospital Survey on Patient Safety Culture
In order to measure the second major project goal of improving safety culture, teams administered the Hospital Survey on Patient Safety Culture (HSOPS) at project onset or baseline and then again near completion of the two-year participation period. The HSOPS is comprised of 10 dimensions assessing safely culture and 4 outcome variables. Among adult ICUs, a statistically significant improvement was found in two dimensions: "feedback and communication about error" and "teamwork within unit." No statistically significant difference was found among the remaining HSOPS dimensions. The On the CUSP: Stop BSI Companion Guide provides more information about the analyses conducted on the baseline and follow-up HSOPS scores for adult ICUs that completed the survey.
Team Checkup Tool
Units were requested to complete a monthly Team Checkup Tool (TCT) which was designed to help teams monitor progress in implementing CUSP tools and to assess unit teamwork and communication. Overall, unit teams undervalued the tool, and adult ICU units completed it only 18 percent of the time. However, results found an increase in "adoption of CUSP activities" and "implementation of CLABSI reduction steps" domains over time and a decrease in "progress barriers" with time.
5. Pronovost P, Needham D, Berenholtz S, et al. An intervention to decrease catheter-related bloodstream infections in the ICU. N Engl J Med 2006 Dec 28;355(26):2725–32.
6. Pronovost P, Goeschel CA, Colantuoni E, et al. Sustaining reductions in catheter-related bloodstream infections in Michigan intensive care units: an observational study. BMJ 2010 Feb 4;340:c309.
7. Johns Hopkins CLABSI Opportunity Estimator at: http://www.hopkinsmedicine.org/quality_safety_research_group/our_projects/stop_bsi/toolkits_resources/clabsi_estimator.html accessed on July 27, 2012.


