Rate Overall
Baseline data was collected during the months of October, November, and December 2011. Overall, units reported a baseline CLABSI rate of 2.043. Relative to baseline, a neonatal central line-associated bloodstream infection (NCLABSI) rate reduction of 46 percent occurred in July increasing to 58 percent in the month of August (Figure 2).
Figure 2. CLABSI rate over time—overall*
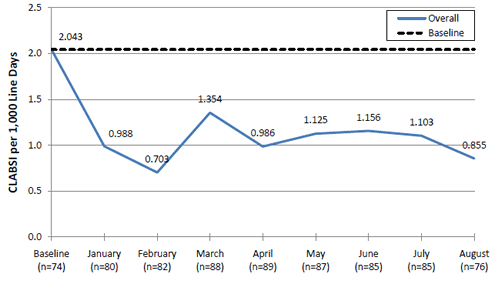
* Sample size per time period represents the number of facilities providing data during that period. Facilities not contributing to the denominator (i.e. zero line days) are not included in the count of facilities and, as such, variability in the number of reporting facilities can be found.
As a confirmatory analysis, units submitting infection data to the National Healthcare Safety Network (NHSN) were requested to submit quarter three and four data from 2011 as well as data moving forward into 2012. Sixty-two units provided some amount of data although variability was found month-to-month (range of 19-58 units). Since the lowest reporting rates were found in the most recent months and probably reflect ongoing data submission rather than missing data (NHSN data from 39 units in July and 19 units in August), Figure 3 reflects data through June 2011. Although 100 percent of units are not currently reporting into NHSN, results are strikingly similar with a baseline rate of 2.040 (versus 2.043 found in PQCNC database) and an overall trend line following a similar pattern and magnitude (most notably an increased rate in March).
Figure 3. CLABSI rate estimated from unit data submitted to NHSN*
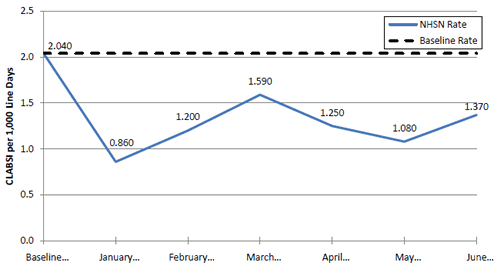
* Sample size per time period represents the number of facilities providing NHSN data.
Rates By Weight
Weight was classified using NHSN classifications1 and represents weight at the time of admission/birth. Overall patient characteristics can be found in Table 7. On average, patients weighed 1,365 grams at admission with a gestational age of 31.6 weeks. CLABSI rates overall are shown in Figure 4. Figures 5 through 9 illustrate CLABSI rates for each weight category and the corresponding baseline rate for that weight category.
Table 7. Sample size and gestational age by birth-weight category
| Birth-Weight Category | N (%) | Gestational Age (STD) |
|---|---|---|
| ≤750 g | 1,280 (13.4%) | 25.1 (3.56) |
| 751-1000 g | 1,341 (14.1%) | 26.8 (1.80) |
| 1001-1500 g | 2,249 (23.6%) | 29.4 (2.00) |
| 1501-2500 g | 2,057 (21.6%) | 33.2 (2.50) |
| >2500 g | 2,598 (27.3%) | 38.0 (2.21) |
Figure 4. CLABSI rate over time by birth-weight (in grams)*
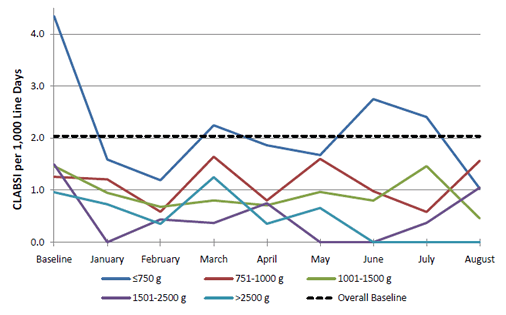
* Overall baseline rate of 2.043 shown as a black, dashed line.
Figure 5. CLABSI rate over time—birth weight ≤750 g*
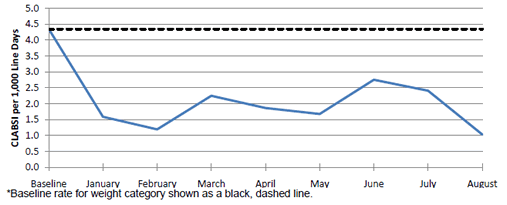
*Baseline rate for weight category shown as a black, dashed line.
Figure 6. CLABSI rate over time—birth weight 751-1000 g*
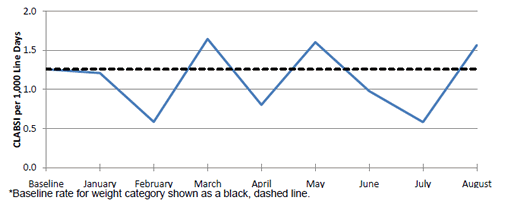
* Baseline rate for weight category shown as a black, dashed line.
Figure 7. CLABSI rate over time—birth weight 1001-1500 g*
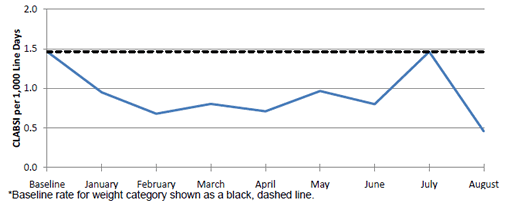
*Baseline rate for weight category shown as a black, dashed line.
Figure 8. CLABSI rate over time—birth weight 1501-2500 g*
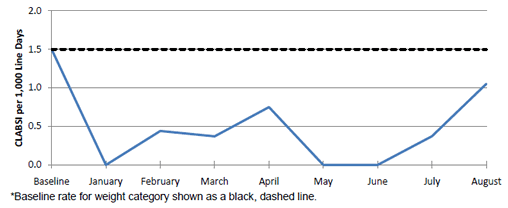
*Baseline rate for weight category shown as a black, dashed line.
Figure 9. CLABSI rate over time—birth weight >2500 g*

*Baseline rate for weight category shown as a black, dashed line.
Rates By Bed Size
Units were classified based upon the total number of beds within the hospital they reside in as either ≥500 beds or <500 beds. Total bed size was obtained from the 2010 AHA Annual Survey. Two units that did not have survey results were classified as having <500 beds. Table 8 illustrates total bed size classification of participating hospitals and Figure 10 illustrates CLABSI rate over time when units are classified as residing in hospitals with ≥500 beds or <500 beds.
Table 8. Total hospital bed size classification (n=100)
| Bed Size | N | % |
|---|---|---|
| 1-99 | 0 | 0% |
| 100-199 | 4 | 4% |
| 200-299 | 19 | 19% |
| 300-399 | 17 | 17% |
| 400-499 | 11 | 11% |
| ≥500 | 47 | 47% |
| Missing | 2 | 2% |
Figure 10. CLABSI rate over time by total hospital bed count*
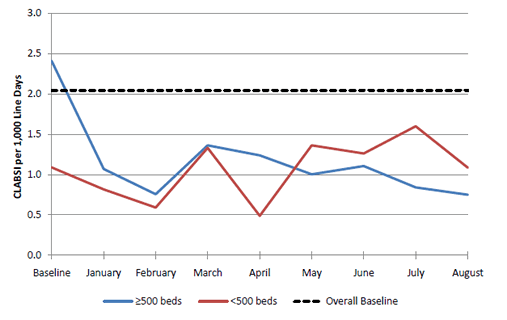
* Total hospital bed count obtained from 2010 AHA Annual Survey. Two units did not have AHA survey data and were classified as having <500 total beds. Overall baseline rate of 2.043 shown as a black, dashed line.
1. "National Healthcare Safety Network (NHSN) report: Data summary for 2006 through 2008, issued December 2009." Accessed on: 5/16/2012 [http://www.cdc.gov/nhsn/PDFs/dataStat/2009NHSNReport.pdf (Plugin Software Help)].


