Understand the Science of Safety
Presentation Slides
Note: Slide content is presented below each of the images.
- Slide 1. Cover Slide
- Slide 2. Learning Objectives
- Slide 3. Putting Safety into Context
- Slide 4. Health Care Defects
- Slide 5. How Can These Errors Happen?
- Slide 6. The Science of Safety
- Slide 7. System-Level Factors Affect Safety9
- Slide 8. Safety is a Property of the System
- Slide 9. System-Level Factors Can Predict Performance
- Slide 10. Three Principles of Safe Design
- Slide 11. Standardize When You Can
- Slide 12. Create Independent Checks
- Slide 13. Learn From Defects
- Slide 14. Exercise
- Slide 15. Principles of Safe Design Apply to Technical Work and Teamwork
- Slide 16. Technical Work and Teamwork
- Slide 17. Exercise
- Slide 18. Teams Make Wise Decisions When There is Diverse and Independent Input
- Slide 19.How To Ensure Diverse and Independent Input
- Slide 20. Basic Components and Process of Communication11
- Slide 21. Diverse and Independent Input
- Slide 22. Reduced CRBSI By Applying Principles of Safe Design12
- Slide 23. Understand the Science of Safety: What the Team Must Do
- Slide 24. Summary
- Slide 25. CUSP Tools
- Slide 26. TeamSTEPPS Tools1
- Slide 27. References
- Slide 28. References
- Slide 29. References
Note: Slide content is presented below each of the images.
Slide 1: Cover Slide

Image: CUSP Toolkit logo.
Slide 2: Learning Objectives

In this module, we will:
- Describe the historical and contemporary context of the Science of Safety
- Explain how system design affects system results
- List the principles of safe design and identify how they apply to technical work and teamwork
- Indicate how teams make wise decisions when there is diverse and independent input
Slide 3: Putting Safety in Context

Advances in medicine have led to positive outcomes:
- Most childhood cancers are curable
- AIDS is now a chronic disease
- Life expectancy has increased 10 years since the 1950s
However, sponges are still found inside patients’ bodies after operations.
Slide 4: Health Care Defects

In the U.S. health care system:
- 7 percent of patients suffer a medication error.2
- On average, every patient admitted to an intensive care unit suffers an adverse event.3, 4
- 44,000 to 99,000 people die in hospitals each year as the result of medical errors.5
- Over half a million patients develop catheter-associated urinary tract infections resulting in 13,000 deaths a year.6
- Nearly 100,000 deaths from health care-associated infections (HAIs) each year and the cost of HAIs is $28 to $33 billion per year.7
- Estimated 30,000 to 62,000 deaths from central line-associated blood stream infections per year.8
Slide 5: How Can These Errors Happen?

- People are fallible.
- Medicine is still treated as an art, not a science.
- Systems do not catch mistakes before they reach the patient.
Slide 6: The Science of Safety

- Every system is perfectly designed to achieve its end results.
- Safe design principles must be applied to technical work and teamwork.
- Teams make wise decisions when there is diverse and independent input.
Slide 7: System-Level Factors Affect Safety9

Image: Concentric circles show the layered system-level factors that affect patient safety: institutional factors, hospital factors, departmental factors, work environment factors, team factors, individual provider factors, and task factors all have an effect on patient safety.
Slide 8: Safety is a Property of the System
(vignette still)
Click to play
Slide 9: System-Level Factors Can Predict Performance

Examples of the Impact of System-Level Factors
| System Factor | Effect |
|---|---|
| Daily rounds with an intensivist | When ICUs are staffed with a multidisciplinary team, including daily rounds with an intensivist, mortality is reduced |
| Nurses responsible for more than two patients | When nurses are responsible for more than two patients, there is an increased risk of pulmonary complications in the ICU patient population |
| Point-of-care pharmacist or pharmacist who participates in rounds | A point-of-care pharmacist or one who participates in rounds reduces prescribing errors |
Slide 10: Three Principles of Safe Design

The three principles of safe design are standardize, create independent checks, and learn from defects.
Slide 11: Standardize When You Can
(vignette still)
Click to play
Slide 12: Create Independent Checks
(vignette still)
Click to play
Slide 13: Learn From Defects
(vignette still)
Click to play
Slide 14: Exercise

Think about a recent safety issue in your unit and answer the four Learning from Defects questions:
- What happened?
- Why did it happen?
- How will you reduce the risk of recurrence?
- How will you know it worked?
Slide 15: Principles of Safe Design Apply to Technical Work and Teamwork

Slide 16: Technical Work and Teamwork
(vignette still)
Click to play
Slide 17: Exercise

How do you see technical and adaptive work fitting in your unit?
Slide 18: Teams Make Wise Decisions When There is Diverse and Independent Input
Slide 19: Exercise
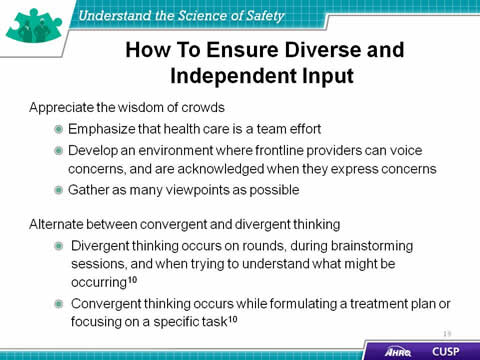
Appreciate the wisdom of crowds
- Emphasize that health care is a team effort
- Develop an environment where frontline providers can voice concerns, and are acknowledged when they express concerns
- Gather as many viewpoints as possible
Alternate between convergent and divergent thinking
- Divergent thinking occurs on rounds, during brainstorming sessions, and when trying to understand what might be occurring10
- Convergent thinking occurs while formulating a treatment plan or focusing on a specific task10
Slide 20: Basic Components and Process of Communication11
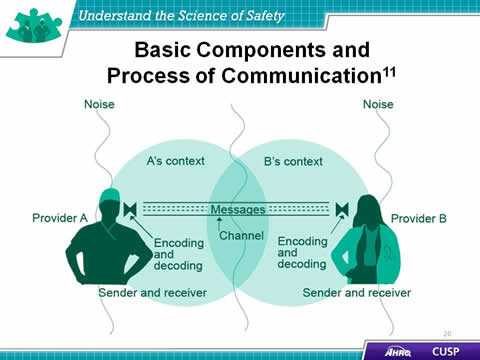
Provider A – Sender and Receiver
- Noise
- A’s Context
- Encoding and Decoding
Messages
- Channel
Provider B – Sender and Receiver
- Noise
- B’s Context
- Encoding and Decoding
Slide 21: Diverse and Independent Input
(vignette still)
Click to play
Slide 22: Reduced CRBSI By Applying Principles of Safe Design12
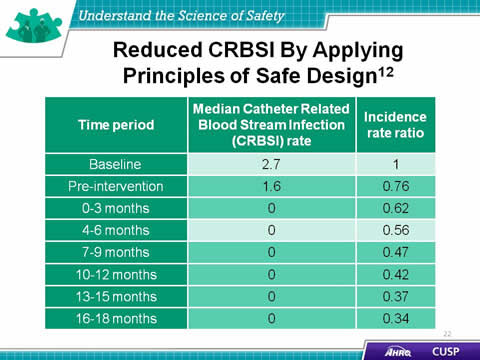
| Time Period | Median Catheter-Related Blood Stream Infection (CRBSI) Rate |
Incidence Rate Ratio |
|---|---|---|
| Baseline | 2.7 | 1 |
| Pre-intervention | 1.6 | 0.76 |
| 0-3 months | 0 | 0.62 |
| 4-6 months | 0 | 0.56 |
| 7-9 months | 0 | 0.47 |
| 10-12 months | 0 | 0.42 |
| 13-15 months | 0 | 0.37 |
| 16-18 months | 0 | 0.34 |
Slide 23: Understand the Science of Safety: What the Team Must Do
- Develop a plan so all staff on your unit view the Understand the Science of Safety video.
- Video screening should be mandatory for all unit staff.
- Create a list of who has watched the video.
- Describe the three principles of safe design:
- Standardize.
- Create independent checks.
- Learn from defects.
Slide 24: Summary
- Every system is designed to achieve its anticipated results.
- The principles of safe design are standardize when you can, create independent checks, and learn from defects.
- The principles of safe design apply to technical work and teamwork.
- Teams make wise decisions when there is diverse input.
Slide 25: CUSP Tools
- Daily Goals Checklist
- Morning Briefing
- Shadowing Another Professional Tool
- Observing Patient Care Rounds
- Team Check-Up Tool
Slide 26: TeamSTEPPS Tools1
- Brief
- Huddle
- Debrief
- SBAR
- Check Back
- Call Out
- Hand Off
- I PASS the BATON
- DESC Script
*Please refer to the “Implement Teamwork and Communication” module for additional information*
Slide 27: References
1.Agency for Healthcare Research and Quality, Department of Defense. TeamSTEPPS. Available at http://www.ahrq.gov/professionals/education/curriculum-tools/teamstepps/instructor/index.html
2. Bates DW, Cullen DJ, Laird N, et al. Incidence of adverse drug events and potential adverse drug events. JAMA. 1995;274(1):29-34.
3. Donchin Y, Gopher D, Olin M, et al. A look into the nature and causes of human errors in the intensive care unit. Crit Care Med. 1995;23:294-300.
4. Andrews LB, Stocking C, Krizek T, et al. An alternative strategy for studying adverse events in medical care. Lancet. 349:309-313,1997.
Slide 28: References
5. Kohn L, Corrigan J, Donaldson M. To err is human: building a safer health system. Washington, DC: National Academy Press; 1999.
6. Scott, RD. The Direct Medical Costs of Healthcare-Associated Infections in U.S. Hospitals and the Benefits of Prevention. March 2009. Available at: http://www.cdc.gov/ncidod/dhqp/pdf/Scott_CostPaper.pdf (Plugin Software Help)
7. Klevens M, Edwards J, Richards C, et al. Estimating Health Care-Associated Infections and Deaths in U.S. Hospitals, 2002. PHR. 2007;122:160-166.
8. Ending health care-associated infections, AHRQ, Rockville, MD, 2009. http://www.ahrq.gov/research/findings/factsheets/errors-safety/haicusp/.
9. Vincent C, Taylor-Adams S, Stanhope N. Framework for analysing risk and safety in clinical medicine. BMJ. 1998;316:1154–57.
Slide 29: References
10. Heifetz R. Leadership without easy answers, president and fellows of Harvard College. Cambridge, MA: Harvard University Press;1994.
11. Dayton E, Henriksen K. Communication failure: basic components, contributing factors, and the call for structure. Jt Comm J Qual Patient Saf. 2007;33(1): 34-47.
12. Pronovost P, Needham D, Berenholtz S, et al. An intervention to decrease catheter-related bloodstream infections in the ICU. New Engl J Med. 2006;355(26):2725-32.


