Summary
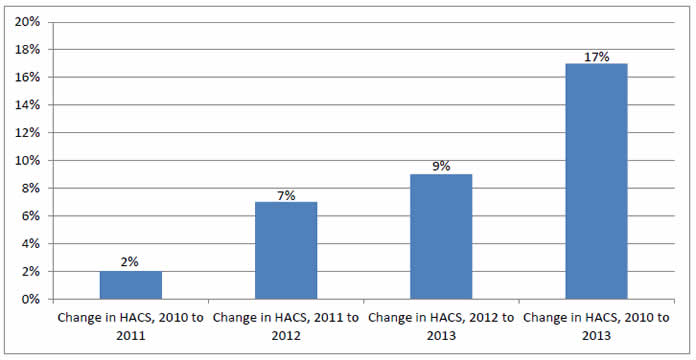
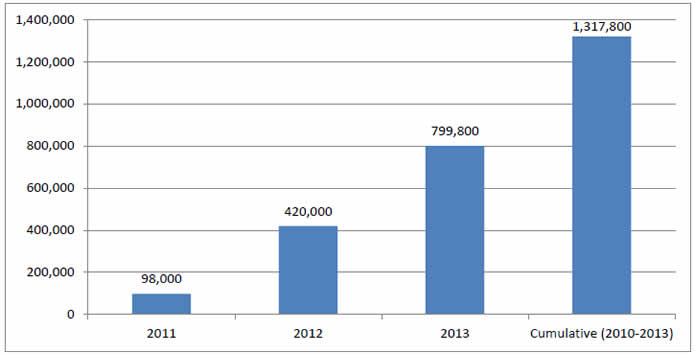
Final estimates for 2013 show a further 9 percent decline in the rate of hospital-acquired conditions (HACs) from 2012 to 2013, and a 17 percent decline, from 145 to 121 HACs per 1,000 discharges, from 2010 to 2013. A cumulative total of 1.3 million fewer HACs were experienced by hospital patients over the 3 years (2011, 2012, 2013) relative to the number of HACs that would have occurred if rates had remained steady at the 2010 level. We estimate that approximately 50,000 fewer patients died in the hospital as a result of the reduction in HACs, and approximately $12 billion in health care costs were saved from 2010 to 2013.
Although the precise causes of the decline in patient harm are not fully understood, the increase in safety has occurred during a period of concerted attention by hospitals throughout the country to reduce adverse events, spurred in part by Medicare payment incentives and catalyzed by the U.S. Department of Health and Human Services (HHS) Partnership for Patients initiative led by the Centers for Medicare & Medicaid Services (CMS).
Introduction
Much attention has been focused on preventing patient harm since the Institute of Medicine's (IOM's) 1999 publication of To Err Is Human: Building a Safer Health System and its subsequent 2001 publication of Crossing the Quality Chasm: A New Health System for the 21st Century. These reports, and others that followed, helped to shine a spotlight on patient safety but also highlighted the fact that making progress to reduce patient harm would be difficult. This attention also prompted an increase in research funding and associated activities in an effort to better understand and address this national problem.
Important principles highlighted by the IOM and leaders in the field established a foundation on which to develop approaches to improve patient safety. Among those principles was an awareness that many threats to patient safety originate in bad systems, not bad people. Patients and their skilled providers find themselves in systems that do not always take into account the factors and challenges presented by the complexities of modern health care. Persistent support for research focused on understanding health care harm—why it occurs, what can be done to prevent it, and how to spread and implement proven practices on a national scale—seems to be making a difference.
Through the aligned efforts of various organizations—including the U.S. Department of Health and Human Services' Agency for Healthcare Research and Quality (AHRQ), Centers for Disease Control and Prevention (CDC), and Centers for Medicare & Medicaid Services (CMS), along with public-private collaboratives such as the Partnership for Patients (PfP)—significant progress has been made to reduce certain HACs. Some HACs have declined dramatically in the Nation's hospitals. For example, according to CDC's March 2014 Healthcare-Associated Infections Progress Report,1 central line-associated bloodstream infections (CLABSIs) dropped 44 percent from 2008 to 2012, and some surgical site infections (SSIs) dropped as much as 20 percent. Similar results on CLABSIs have also been documented in AHRQ's nationwide Comprehensive Unit-based Safety Program (CUSP) to prevent CLABSI.2
In 2010 an HHS Office of the Inspector General (OIG) team identified the rate of harm—that is, injuries to patients associated with their care—among hospitalized Medicare patients as 27 percent. Half of these inpatients experienced one or more adverse events that resulted in a prolonged hospital stay, permanent harm, a life-sustaining intervention, or death. Almost half of all events identified in the OIG report were considered preventable.3 The persistence of this challenge prompted formation of the nationwide PfP initiative, which aimed to save lives by preventing HACs and improving the transition of care from one care setting to another in order to reduce readmissions.
The PfP is a very large national quality improvement learning collaborative with two aims: to improve safety in acute care hospitals and to improve coordination of care at discharge to prevent readmissions. The PfP is much more than a collection of hospital engagement network (HEN) contracts. It is a public-private partnership that seeks national change by setting clear aims, aligning and engaging multiple Federal partners and programs, aligning and engaging multiple private partners and payers, and establishing a national learning network through a CMS investment in 26 HEN contractors. These contractors successfully enrolled more than 3,700 acute care hospitals in the initiative and had these hospitals engaged in achieving the aims throughout 2012, 2013, and 2014. These hospitals account for 80 percent of the Nation's acute care discharges.
Simultaneously, CMS pursued aligned changes in payment policy, a nationwide program of technical assistance aimed at improving hospital safety and care coordination through the Nation's Quality Improvement Organizations (QIOs), and a program of work through the CMS Innovation Center known as the "Community Based Care Transitions Program" (CCTP). The purpose of CCTP is to also improve care transitions from inpatient hospitals, while documenting savings to the Medicare program. All these programs were designed to work in synergy and cooperation with one another. The PfP is a fully aligned "full-court press" to achieve two aims: 40 percent reduction in preventable harm4 and 20 percent reduction in 30 day readmissions.
At the outset of the PfP initiative, HHS agencies contributed their expertise to developing a measurement strategy by which to track national progress in patient safety—both in general and specifically related to the preventable HACs being addressed by the PfP. In conjunction with CMS's overall leadership of the PfP, AHRQ has helped coordinate development and use of the national measurement strategy. The results using this national measurement strategy have been referred to as the "AHRQ National Scorecard," which provides summary data on the national HAC rate.5 The results reported in this brief are based on this national measurement strategy.
Data and Methods
Estimating the Rate of Hospital-Acquired Conditions
Data on the rate of HACs comes from three sources:
- Review of approximately 18,000 to 33,000 medical records in each year, using a structured protocol and software tool, to determine whether any of 21 types of adverse events—such as adverse drug events, falls, and pressure ulcers—occurred. The medical records used for the Medicare Patient Safety Monitoring System (MPSMS) come from the CMS Inpatient Quality Reporting (IQR) Program.6 After the medical records are abstracted with the MPSMS software tool, the data are used to calculate 7 of 9 PfP HACs (2 of 9 PfP HACs are calculated differently as described below). Overall, this represents approximately 92 percent of measured HACs calculated for the PfP. The 9 types of HACs selected for special focus ("core HACs") by the PfP are listed in Exhibit A1 in the Appendix, along with the MPSMS and other measures used. Ten of the MPSMS measures are used to generate the majority of HACs in the "All Other HACs" group, which was established to allow tracking of a variety of other important sources of harm to patients in addition to the 9 "core" HACs referred to above.
- Data on SSIs are generated by a special calculation performed by CDC in support of the PfP. The data are based on 17 major surgical procedure types, composed of the 12 operations included in the Surgical Care Improvement Project, and 5 other frequent operations, such as cesarean sections. The underlying data are reported by hospitals as part of the National Healthcare Safety Network (NHSN), operated by CDC. These data on SSIs are used to calculate the HAC rates, overall, for approximately 2 percent of all measured HACs in the PfP initiative.
- Data for obstetric adverse events come from AHRQ Patient Safety Indicators (PSIs) 18 and 19. In addition, data on four other PSIs were selected to contribute to the "All Other HACs" referred to above. These 6 PSIs are derived from Healthcare Cost and Utilization Project (HCUP) data7 and account for approximately 6 percent of all measured HACs in the PfP initiative.
The MPSMS data come from a system in which a sample of IQR medical records are reviewed by trained abstractors who use a structured protocol and software tool to determine whether any of 21 specific measures of adverse events occurred during the hospital stay.8 Inter-rater reliability is high.9
The methods for acquiring the IQR sample have changed little from 2010 through 2013, and the protocols for determining if specific adverse events have occurred has not changed significantly.10 The use of a consistent data source and a consistent measurement technique gives us confidence that our estimates of the change in the HAC rate from 2010 to 2013 are unbiased.11 We also have a relatively large sample size.
The methods to estimate the national HAC rate are described in detail in the document "Methods Used To Estimate the Annual PfP National Hospital-Acquired Condition (HAC) Rate," available at http://www.ahrq.gov/professionals/quality-patient-safety/pfp/index.html; and the 2011 and 2012 HAC data are available at http://www.ahrq.gov/professionals/quality-patient-safety/pfp/hacrate2011-12.html.
Estimating the Impact of HAC Reduction on Deaths Averted and Costs Saved
As described above, the analysis of the data allows us to directly measure the number of HACs, and the vast majority (>90%) of the data are gathered through review of medical records. In contrast, our estimates of deaths averted and cost savings result from computations based on changes in the number of each type of HAC. The estimated cost savings and deaths averted per HAC, shown in Exhibit 1 and Exhibit A4, and used in Exhibit A2, were based on a review of available information in published peer-reviewed articles; published and internal CMS, AHRQ, and CDC reports; and other sources, in combination with expert opinion from inside and outside the team.
These cost and mortality estimates per HAC were developed in 2010 and early 2011, prior to the start of the PfP, and were based on data available to the HHS team at the time. In preparation for the analysis conducted in 2010, we identified estimates of the association of each HAC with excess mortality and with increased costs of care. Estimating the precise impact of HACs is challenging and complex due, in part, to variable severity of individual HACs, potential for interaction among different HACs and patient comorbidities, degree to which various analyses have addressed these factors, and variable methodologies that have been used to study the impact of individual HACs on excess mortality and costs.
For many HACs, the literature did not provide precise estimates of the effects of an HAC on either mortality or costs, and, for many HACs, more than one estimate was available. In these cases judgment was used to estimate the effects of an HAC on mortality and costs. Estimates of the impact from individual HACs were also considered in light of estimates of overall hospital mortality and costs, nationally, as well as aggregate mortality and excess costs due to HACs.
Exhibit 1 displays the cost and mortality estimates that were used for each HAC and are based on analyses done in late 2010 and 2011.12
Exhibit 1. Excess Cost and Mortality Estimated in 2011 (at the Launch of PfP), by Hospital Acquired Condition
| PfP Hospital Acquired Condition | Estimated Additional Cost* per HAC | Estimated Additional Inpatient Mortality per HAC |
|---|---|---|
| Adverse DruQ Events | $5,000 | .020 |
| Catheter-Associated Urinary Tract Infections | $1,000 | .023 |
| Central Line-Associated Bloodstream Infections | $17,000 | .185 |
| Falls | $7,234 | .055 |
| Obstetric Adverse Events | $3,000 | .0015 |
| Pressure Ulcers | $17,000 | .072 |
| SurQical Site Infections | $21,000 | .028 |
| Ventilator-Associated Pneumonia | $21,000 | .144 |
| Postoperative Venous Thromboembolism | $8,000 | .104 |
As shown in the results section below, the largest effects on estimates of the deaths averted and cost savings come from declines in pressure ulcers and adverse drug events. As shown in Exhibit 1 we estimate that pressure ulcers are associated with an excess mortality rate of 72 deaths per 1,000 and excess costs of $17,000/case, and adverse drug events (ADEs) with an excess mortality of 20 deaths per 1,000 and excess costs of $5,000/case.
The estimated cost per pressure ulcer was based on a report for CMS by RTI international (Kandilov, et al.; the HHS team accessed a draft report in 2010-2011, and the final October 2011 report is referenced in the Appendix). RTI estimated that the difference in costs between patients with hospital-acquired Stage III and Stage IV pressure ulcers and matched patients without hospital-acquired Stage III and IV pressure ulcers, based on bivariate descriptive analysis, is $17,286.
This estimate was derived by first identifying hospital claims paid under the inpatient prospective payment system (IPPS) and discharged in FY 2009 that had 1 of 10 selected HACs. These were considered index claims. Costs included the initial hospital stay and costs of other inpatient sites of care that occurred within 90 days of discharge. For each index HAC claim, there were five IPPS claims with the same Medicare Severity diagnosis-related group (MS-DRG), sex, race, and age that did NOT have a Stage III or IV pressure ulcer that were used as a matched control group. They then used bivariate (descriptive) and multivariate analysis to examine the differences in Medicare program costs between the two groups.
The estimate for deaths associated with pressure ulcers was based primarily on the paper by Zhan and Miller in 2003 (see reference in Appendix). Zhan and Miller estimated that excess mortality due to pressure ulcers was 72 deaths per 1,000 pressure ulcers. This estimate is based on analysis of data from HCUP identifying injuries in 7.45 million hospital discharge abstracts from 994 acute care hospitals across 28 States in 2000. Mortality for patients with pressure ulcer was compared to mortality among a matched set of patients, where patients were matched on DRG, comorbidities, age, gender, race, and hospital. References to all the documents used in these estimates and projections are provided in the Appendix.
The team also had access to MPSMS annual reports available at the time (results through CY 2009). MPSMS data provide inpatient mortality data for the patients who experienced each type of adverse event, and for patients who were exposed to risk for the event.13 These MPSMS mortality data were of interest even though they could not be used directly for attribution of deaths to adverse events.
Results
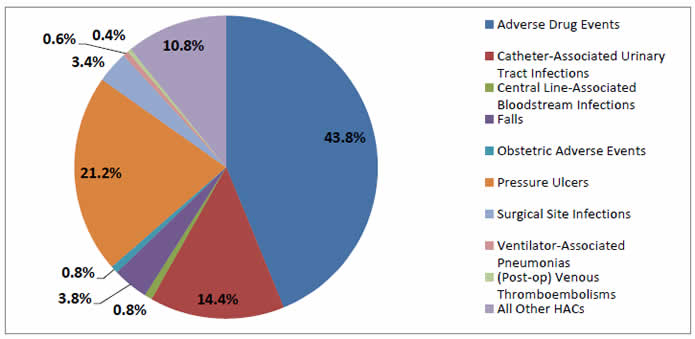
Final estimates for 2013 show that the national HAC rate declined by 9 percent from 2012 to 2013 and was 17 percent lower in 2013 than in 2010 (Exhibit 2). As a result of the reduction in the rate of HACs, we estimate that approximately 800,000 fewer incidents of harm occurred in 2013 than would have occurred if the rate of HACs had remained steady at the 2010 level (Exhibit 3). Cumulatively, approximately 1.3 million fewer incidents of harm occurred in 2011, 2012, and 2013 (compared to 2010), with most of the improvement occurring in 2012 and 2013. About 40 percent of this reduction is from ADEs, about 20 percent is from pressure ulcers, and about 14 percent from catheter-associated urinary tract infections (CAUTIs) (Exhibit 4). These HACs constituted about 34 percent, 27 percent, and 8 percent of the HACs measured in the 2010 baseline rate (Exhibit A2).
Exhibit 2. Annual and Cumulative Changes in HACs, 2010 to 2013*
Source: AHRQ National Scorecard Estimates from Medicare Patient Safety Monitoring System, National Healthcare Safety Network, and Healthcare Cost and Utilization Project.
Note: The 17 percent change from 2010 to 2013 is not the sum of 2 percent, 7 percent, and 9 percent due to different total HAC rates in 2010, 2011, and 2012.
Exhibit 3. Total Annual and Cumulative HAC Reductions (Compared to 2010 Baseline)
Source: AHRQ National Scorecard Estimates from Medicare Patient Safety Monitoring System, National Healthcare Safety Network, and Healthcare Cost and Utilization Project.
Exhibit 4. Change in HACs, 2011-2013 (Total = 1,317,800)
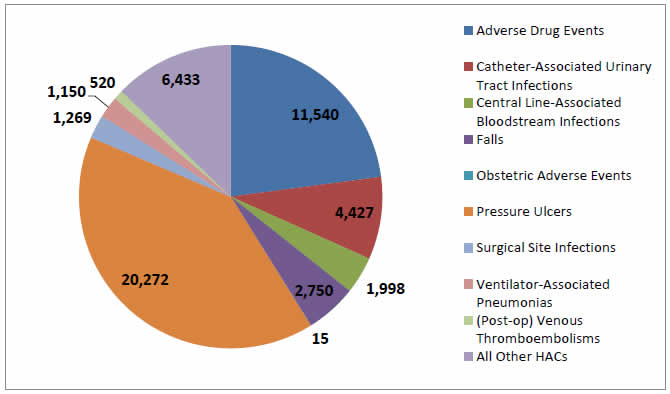
Updated 2013 estimates show that almost 35,000 fewer patients died in hospitals as a result of the decline in HACs compared to the number of deaths that would have occurred if the rate of HACs had remained steady at the 2010 level (Exhibit 5). The majority of deaths averted occurred as a result of reductions in the rates of pressure ulcers14 and ADEs, although declines in other HACs also contributed significantly to deaths averted (Exhibit 6). Estimated cumulative deaths averted from 2011 through 2013 are approximately 50,000.
Exhibit 5. Total Annual and Cumulative Deaths Averted (Compared to 2010 Baseline)
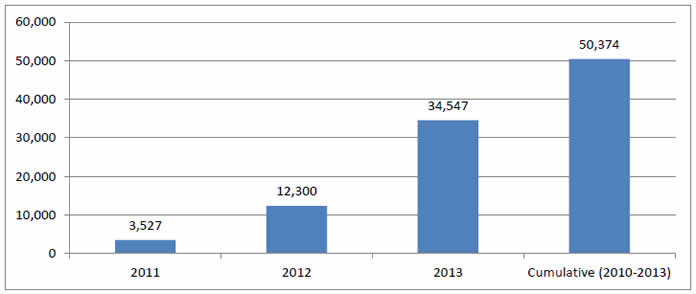
Exhibit 6. Estimated Deaths Averted, by Hospital-Acquired Condition (HAC), 2011-2013
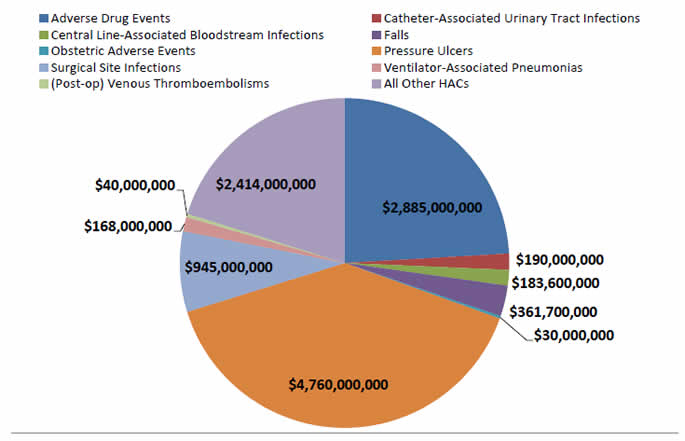
Final 2013 estimates show that the decline in HACs resulted in estimated cost savings of approximately $8 billion in 2013. Estimated cumulative savings for 2011, 2012, and 2013 are approximately $12 billion (Exhibit 7). As was the case for the deaths averted estimates, the majority of cost savings are estimated to result from declines in pressure ulcers and ADEs (Exhibit 8).
Exhibit 7. Total Annual and Cumulative Cost Savings (Compared to 2010 Baseline)
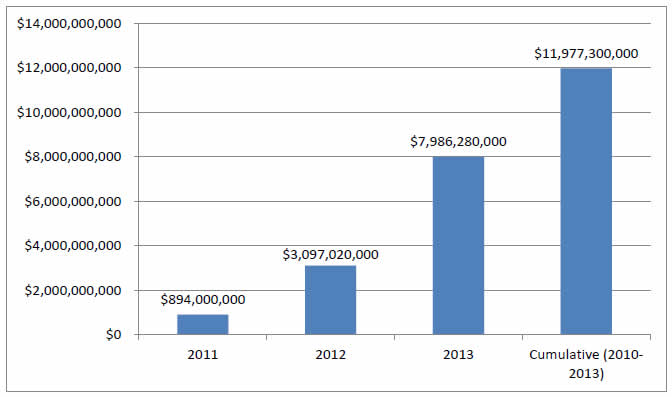
Exhibit 8. Estimated Cost Savings, by Hospital-Acquired Condition (HAC), 2010-2013
Discussion
The estimated 17 percent reduction in HACs from 2010 to 2013 indicates that hospitals have made substantial progress in improving safety. An estimated 1.3 million fewer harms were experienced by patients from 2010 to 2013 than would have occurred if the rate of harm had remained at the 2010 level. The reasons for this progress are not fully understood. Likely contributing causes are financial incentives created by CMS and other payers' payment policies, public reporting of hospital-level results, technical assistance offered by the QIO program to hospitals, and technical assistance and catalytic efforts of the HHS PfP initiative led by CMS.15 There is still much more work to be done, even with the 17 percent decline in the HACs we have measured for the PfP since 2010. The 2013 HAC rate of 121 HACs per 1,000 discharges means that almost 10 percent16 of hospitalized patients experienced one or more of the HACs we measured. That rate is still too high.
Prevention of approximately 50,000 deaths in the 2011 to 2013 period as a result of the decline in HACs, with almost 35,000 of these deaths averted in 2013 alone, is a remarkable achievement.
As indicated in the results section, the estimate of deaths averted is less precise than the estimate of the size of the reduction in HAC rates. We directly estimate the size of the reduction in HAC rates but rely on analysis from other researchers of the complex relationship between HACs and mortality to extrapolate the impact of the reduction in HACs on deaths averted. These estimates used in our analysis originate from a variety of sources and methodologies. Even with the uncertainty inherent in our statistical extrapolations, it is clear that approximately 1 million Americans have avoided harm as a result of the reduction in HACs, and that tens of thousands of deaths have been averted as a result.
We estimate an associated reduction of $12 billion in health care costs from 2011 to 2013 as a result of the reduction in HACs, with $8 billion of those cost savings accruing in 2013 alone. As is the case for the estimate of deaths averted, there is less precision regarding the cost savings estimates than there is about the estimates of the magnitude of reduction in HACs. Even with less precision in the estimates, the potential cost savings are compelling and warrant serious attention by hospital associations, hospital systems, and executives.
Despite the tremendous progress to date in reducing HACs, much work remains to be done to ensure that the U.S. health care system is as safe as it can possibly be. HHS and other public and private partners are continuing to work to improve hospital safety. These latest data indicate that it is possible to make substantial progress in reducing virtually all types of HACs simultaneously. PfP leaders have termed this objective as achieving "Safety Across the Board" and believe it should be a national goal.
- Centers for Disease Control and Prevention. 2012 National and State Healthcare-Associated Infections Progress Report. Published March 26, 2014. http://www.cdc.gov/hai/progress-report/index.html.
- Initial groundbreaking work was published by Pronovost, et al., in 2006 in the New England Journal of Medicine (full text is available online at: http://www.nejm.org/doi/full/10.1056/NEJMoa061115#t=article). The AHRQ final report on this work is online at http://www.ahrq.gov/professionals/quality-patient-safety/cusp/clabsi-final/index.html.
- Based on information from the HHS OIG and other sources, the preventable fraction of inpatient HACs was estimated at 44 percent. This report is available online at http://oig.hhs.gov/oei/reports/oei-06-09-00090.pdf.
- Based on the OIG report estimating that 44 percent of HACs are preventable, a 40 percent reduction in preventable HACs equates to an overall 17.6 percent reduction in total HACs. See Exhibits A2 and A4 in the Appendix for more information on estimates and projections of cost savings and deaths averted that are based on projected and measured reductions of HACs.
- The overall national strategy for measurement activities associated with the PfP was described recently in the Journal of Patient Safety (available at: http://journals.lww.com/journalpatientsafety/Abstract/2014/09000/An_Overview_of_Measurement_Activities_in_the.2.aspx). Baseline HAC data for the 2010 AHRQ National Scorecard, and for 2011 and 2012, are available online at http://www.ahrq.gov/professionals/quality-patient-safety/pfp/pfphac.pdf and http://www.ahrq.gov/professionals/quality-patient-safety/pfp/hacrate2011-12.pdf, respectively.
- Information regarding the CMS IQR Program is available at https://www.cms.gov/Medicare/Quality-Initiatives-Patient-Assessment-Instruments/HospitalQualityInits/HospitalRHQDAPU.html. Information about the MPSMS sample is also described in the article "National Trends in Patient Safety for Four Common Conditions, 2005–2011," available at http://www.nejm.org/doi/full/10.1056/NEJMsa1300991.
- HCUP is a family of databases and related software tools and products developed through a Federal-State-industry partnership and sponsored by AHRQ. HCUP databases are derived from administrative data and contain encounter-level, clinical, and nonclinical information, including all-listed diagnoses and procedures, discharge status, patient demographics, and charges for all patients, regardless of payer (e.g., Medicare, Medicaid, private insurance, uninsured). The HCUP databases are based on the data collection efforts of organizations in participating States that maintain statewide data systems and are partners with AHRQ. http://www.ahrq.gov/research/data/hcup/index.html.
- MPSMS methods are described in a recent publication: Wang Y, Eldridge N, Metersky M, et al. National trends in patient safety for four common conditions, 2005–2011. N Engl J Med 2014;370:341-51. This publication and detailed appendixes are available online at: http://www.nejm.org/doi/full/10.1056/NEJMsa1300991#t=article
- The measured agreement rates between abstractors using the MPSMS software tool have ranged from 94 percent to 99 percent for data elements used to identify adverse events. (Source is same as above: Wang Y, Eldridge N, Metersky M, et al.)
- The abstraction protocol used for MPSMS has only undergone minor changes since the PfP measurement plan was established, such as when updates were necessary regarding the names of medications and other minor corrections that allow abstractors to accurately answer the questions that lead to the generation of the MPSMS rates.
- The use of the "present on admission" indicator in billing data has likely changed over time, as hospitals have become more careful in documenting which conditions were present on admission in the billing data they submit to CMS and other payers. However, greater use of the "present on admission" indicator in billing data would not affect the results of the medical record review we used to estimate 92 percent of the HACs.
- Go to Exhibit A4 in the Appendix for additional information.
- For pressure ulcers and falls, 100 percent of patients are exposed to risk for the event; but for other event types, such as CLABSIs, only a fraction of patients are exposed to risk for the event. In the case of CLABSI, only patients who received a central line as part of their inpatient care are considered at risk for the event.
- The number of deaths averted for any individual HAC is the product of three factors: baseline prevalence of the HAC; percentage reduction of the HAC; and attributed mortality for the HAC. For example, pressure ulcers had a high baseline prevalence, and excess mortality attributed to pressure ulcers is high compared to other HACs (Appendix Exhibit A2). At the same time, the 20 percent reduction in pressure ulcers is similar to the 17 percent reduction in HACs overall (Appendix Exhibit A3). However, since the baseline prevalence of pressure ulcers was high, the number of deaths averted is much higher than for other HACs even though the reduction in rates of pressure ulcers is similar to the reduction in the rate of all HACs.
- The independent evaluator of the PfP has a comprehensive evaluation design in place that will work to assess the overall contribution of the PfP initiative to the improvements documented in this paper. The CMS Office of the Actuary will use this evaluation and other data to make judgments about the overall impact of the PfP model test.
- The rate of 121 HACs per 1,000 discharges does not equate to 12.1% of patients experiencing HACs because some patients experience more than one HAC during an inpatient hospital stay. Based on prior experience reviewing HAC data, the 121 HACs per 1,000 discharges are probably experienced by fewer than 100 patients among 1,000 discharges (10 percent of inpatients).
This document is in the public domain and may be reproduced without permission. Citation of the source is appreciated. Suggested Citation: 2013 Annual Hospital-Acquired Condition Rate and Estimates of Cost Savings and Deaths Averted From 2010 to 2013. Rockville, MD: Agency for Healthcare Research and Quality; October 2015. AHRQ Publication No. 16-0006-EF. http://www.ahrq.gov/professionals/quality-patient-safety/pfp/index.html


