Webinar 2: Analyze Data and Patient/Caregiver Perspectives (Section 1 of the Guide): Slide Presentation
Designing & Delivering Whole-Person Transitional Care: The Hospital Guide to Reducing Medicaid Readmissions
Slide 1: Designing & Delivering Whole-Person Transitional Care
Designing & Delivering Whole-Person Transitional Care
The Hospital Guide to Reducing Medicaid Readmissions
Webinar 2: Analyze Data and Patient/Caregiver Perspectives (Section 1 of the Guide)
Slide 2: Agenda
- Describe Medicaid readmission patterns.
- Describe the 15-part data analysis to understand all-payer and payer specific readmissions at your hospital.
- Describe the patient/caregiver interview process to understand readmissions from the patient perspective.
Slide 3: Objectives
- Understand 3 ways in which Medicaid readmission patterns are similar to and 3 ways Medicaid readmission patterns are different from Medicare readmission patterns.
- Understand why understanding the patient perspective is helpful for identifying opportunities for improvement & designing effective strategies.
- Understand the tools available to support this work.
Slide 4: Table of Contents
- Introduction.
- Why focus on Medicaid Readmissions?
- How to Use This Guide.
- Analyze Your Data.
- Survey Your Current Readmission Reduction Efforts.
- Plan a Multi-Faceted Data-Informed Portfolio of Strategies.
- Implement Whole-Person Transitional Care for All.
- Reach Out to Collaborate With Cross-Continuum Providers.
- Enhance Services for High-Risk Patients.
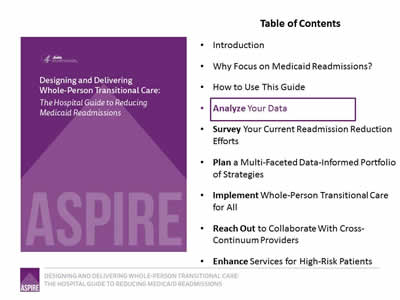
Image: Cover of the book, Designing & Delivering Whole-Person Transitional Care: The Hospital Guide to Reducing Medicaid Readmissions.
Slide 5: List of Tools
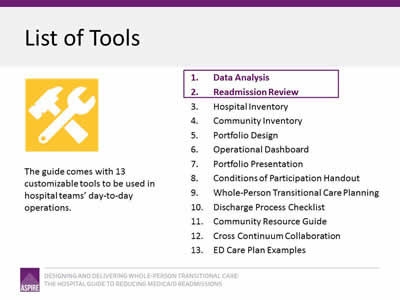
The guide comes with 13 customizable tools to be used in hospital teams’ day-to-day operations.
- Data Analysis.
- Readmission Review.
- Hospital Inventory.
- Community Inventory.
- Portfolio Design.
- Operational Dashboard.
- Portfolio Presentation.
- Conditions of Participation Handout.
- Whole-Person Transitional Care Planning.
- Discharge Process Checklist.
- Community Resource Guide.
- Cross Continuum Collaboration.
- ED Care Plan Examples.
Image: Tool icon (crossed hammer and wrench).
Slide 6: The ASPIRE Framework
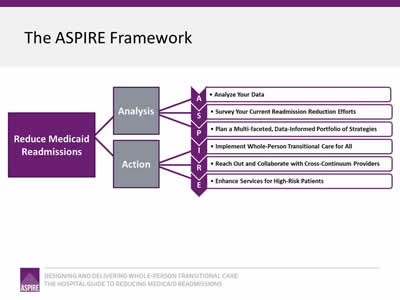
Image: The Framework is a flowchart reading from left to right. On the left is a box captioned "Reduce Medicaid Readmissions"; two lines connect this box to two boxes to its right captioned "Analysis" and "Action". Three lines each extend from "Analysis" and "Action" to connect to the elements that make up the ASPIRE acronym:
- Analyze Your Data.
- Survey Your Current Readmission Reduction Efforts.
- Plan a Multi-faceted, Data-Informed Portfolio of Strategies.
- Implement Whole-Person Transitional Care for All.
- Reach Out and Collaborate with Cross-Continuum Providers.
- Enhance Services for High-Risk Patients.
Slide 7: All Payer and Payer-Specific Readmission Analysis
All Payer and Payer-Specific Readmission Analysis
Slide 8: Why Analyze Your Own Data?
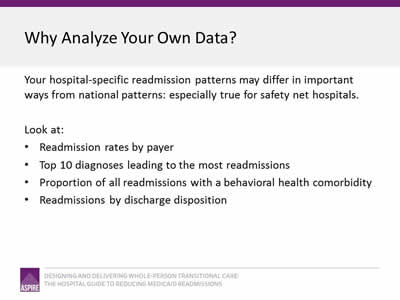
Your hospital-specific readmission patterns may differ in important ways from national patterns: especially true for safety net hospitals.
Look at:
- Readmission rates by payer.
- Top 10 diagnoses leading to the most readmissions.
- Proportion of all readmissions with a behavioral health comorbidity.
- Readmissions by discharge disposition.
Slide 9: Readmission by Payer Type
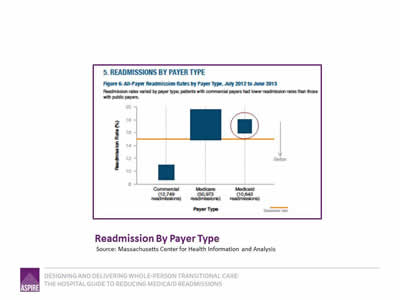
Image: Graph titled "Readmission By Payer Type" shows All-Payer Readmission Rates by Payer Type, July 2012 to June 2013. Readmission rates varied by payer type; patients with commercial payers had lower readmission rates than those with public payers:
- Commercial: 12,749 readmissions.
- Medicare: 50,973 readmissions.
- Medicaid: 10,643 readmissions.
Source: Massachusetts Center for Health Information and Analysis
Slide 10: Readmissions by Discharge Setting
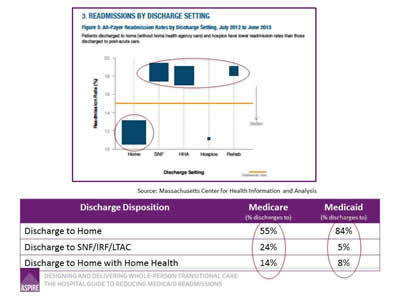
Image: Graph titled "Readmissions by Discharge Setting" shows All-Payer Readmission Rates by Discharge Setting, July 2012 to June 2013. Patients discharged to home (without home health agency care) and hospice have lower readmission rates than those discharged to post-acute care:
| Discharge Disposition | Medicare (% discharges to) |
Medicaid (% discharges to) |
|---|---|---|
| Discharge to Home | 55% | 84% |
| Discharge to SNF/IRF/LTAC | 24% | 5% |
| Discharge to Home with Home Health | 14% | 8% |
Source: Massachusetts Center for Health Information and Analysis
Slide 11: HCUP Statistical Brief #172
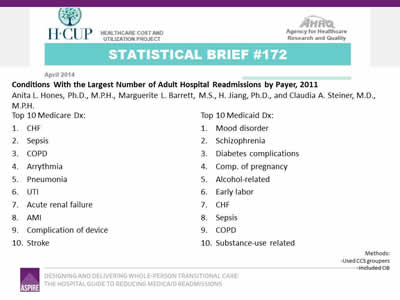
Conditions With the Largest Number of Adult Hospital Readmissions by Payer, 2011
Anita L. Hones, Ph.D., M.P.H., Marguerite L. Barrett, M.S., H. Jiang, Ph.D., and Claudia A. Steiner, M.D., M.P.H.
Top 10 Medicare Dx:
- CHF.
- Sepsis.
- COPD.
- Arrhythmia.
- Pneumonia.
- UTI.
- Acute renal failure.
- AMI.
- Complication of device.
- Stroke.
Top 10 Medicaid Dx:
- Mood disorder.
- Schizophrenia.
- Diabetes complications.
- Complications of pregnancy.
- Alcohol-related.
- Early labor.
- CHF.
- Sepsis.
- COPD.
- Substance-use related.
Slide 12: Top 10 Principal Discharge Diagnoses Leading to a 30-Day Readmission by Discharge Destination
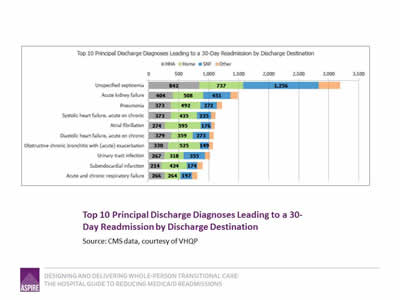
Image: Graph shows Top 10 Principal Discharge Diagnoses Leading to a 30-Day Readmission by Discharge Destination:
| Principal Discharge Diagnosis | HHA | Home | SNF |
|---|---|---|---|
| Unspecified septicemia | 842 | 737 | 1256 |
| Acute kidney failure | 404 | 508 | 451 |
| Pneumonia | 373 | 492 | 272 |
| Systolic heart failure, acute on chronic | 373 | 435 | 235 |
| Atrial fibrilation | 274 | 595 | 176 |
| Diastolic heart failure, acute on chronic | 379 | 359 | 273 |
| Obstructive chronic bronchitis with (acute) exacerbation | 330 | 525 | 149 |
| Urinary tract infection | 267 | 318 | 355 |
| Subendocardial infection | 214 | 424 | 174 |
| Acute and chronic respiratory failure | 266 | 264 | 197 |
Source: CMS data, courtesy of VHQP.
Slide 13: Readmission Rates for Congestive Heart Failure
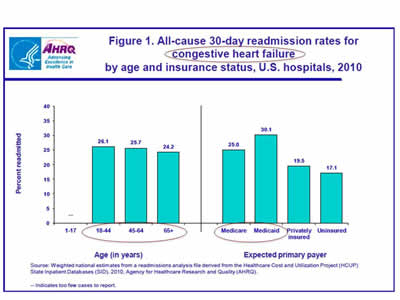
Image: Two bar graphs show All-cause 30-day readmission rates for congestive heart failure by age and insurance status in U.S. hospitals, 2010:
Age (in years):
- 1-17: Too few cases to report.
- 18-44: 26.1%
- 45-64: 25.7%.
- 65+: 24.2%.
Expected primary payer:
- Medicare: 25.0%.
- Medicaid: 30.1%.
- Privately insured: 19.5%.
- Uninsured: 17.1%.
Source: Weighted national estimates from a readmissions analysis file derived from the Healthcare Cost and Utilization Project (HCUP) State Inpatient Databases (SID), 2010. Agency for Healthcare Research and Quality (AHRQ).
Slide 14: Readmissions for Patients With High Utilization
- 4+ hospitalizations/year.
- Readmission rate 40% v. 8%.
- 74% of discharged to home.
- Top Discharge Diagnoses:
- Mood disorders.
- Schizophrenia.
- Diabetes.
- Chemotherapy.
- Sickle cell.
- Alcohol.
- Sepsis.
- Heart Failure.
- COPD.
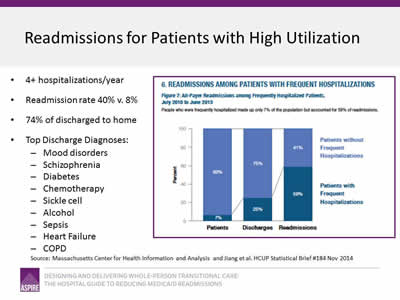
Image: A bar graph captioned Readmissions for Patients with High Utilization shows All-Payer Readmissions among Frequently Hospitalized Patients, July 2010 to June 2013. People who were frequently hospitalized made up only 7% of the population but accounted for 59% of readmissions:
- Patients:
- Patients without Frequent Hospitalizations - 93%.
- Patients with Frequent Hospitalizations - 7%.
- Discharges:
- Patients without Frequent Hospitalizations - 75%.
- Patients with Frequent Hospitalizations - 25%.
- Readmissions:
- Patients without Frequent Hospitalizations - 41%.
- Patients with Frequent Hospitalizations - 59%.
Source: Massachusetts Center for Health Information and Analysis and Jiang et al. HCUP Statistical Brief #184 Nov 2014.
Slide 15: 15-Point Analytic Plan: All Payer and Payer-Specific
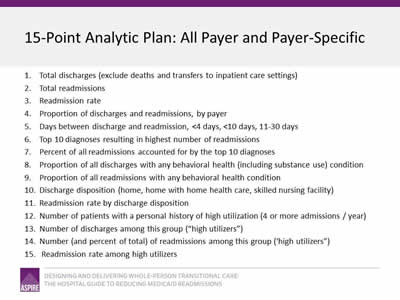
- Total discharges (exclude deaths and transfers to inpatient care settings).
- Total readmissions.
- Readmission rate.
- Proportion of discharges and readmissions, by payer.
- Days between discharge and readmission, <4 days, <10 days, 11-30 days.
- Top 10 diagnoses resulting in highest number of readmissions.
- Percent of all readmissions accounted for by the top 10 diagnoses.
- Proportion of all discharges with any behavioral health (including substance use) condition.
- Proportion of all readmissions with any behavioral health condition.
- Discharge disposition (home, home with home health care, skilled nursing facility).
- Readmission rate by discharge disposition.
- Number of patients with a personal history of high utilization (4 or more admissions / year).
- Number of discharges among this group ("high utilizers").
- Number (and percent of total) of readmissions among this group (‘high utilizers").
- Readmission rate among high utilizers.
Slide 16: Data Analysis Tool
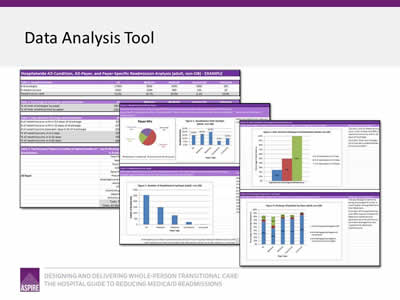
Images: Three screenshots display the Data Analysis Tool.
Slide 17: Ask your patients "Why"
Elicit the story behind the chief complaint; identify root causes.
Slide 18: Review readmissions from "whole person" view
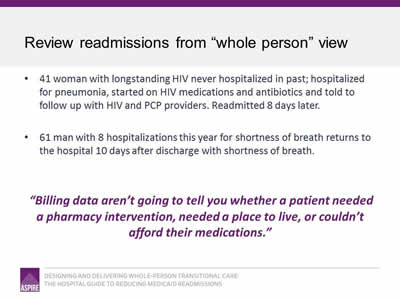
- 41 woman with longstanding HIV never hospitalized in past; hospitalized for pneumonia, started on HIV medications and antibiotics and told to follow up with HIV and PCP providers. Readmitted 8 days later.
- 61 man with 8 hospitalizations this year for shortness of breath returns to the hospital 10 days after discharge with shortness of breath.
"Billing data aren’t going to tell you whether a patient needed a pharmacy intervention, needed a place to live, or couldn’t afford their medications."
Slide 19: 41 woman with HIV hospitalized with pneumonia
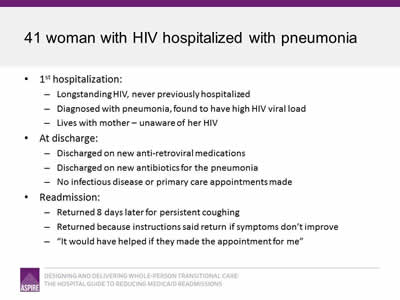
- 1st hospitalization:
- Longstanding HIV, never previously hospitalized.
- Diagnosed with pneumonia, found to have high HIV viral load.
- Lives with mother—unaware of her HIV.
- At discharge:
- Discharged on new anti-retroviral medications.
- Discharged on new antibiotics for the pneumonia.
- No infectious disease or primary care appointments made.
- Readmission:
- Returned 8 days later for persistent coughing.
- Returned because instructions said return if symptoms don’t improve.
- "It would have helped if they made the appointment for me."
Slide 20: 61 man with 8 hospitalizations this year for SOB
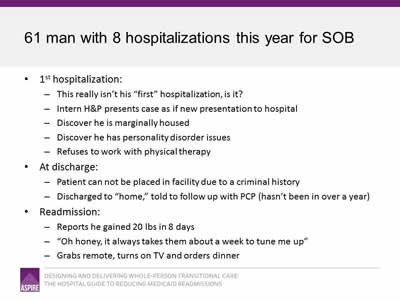
- 1st hospitalization:
- This really isn’t his "first" hospitalization, is it?
- Intern H&P presents case as if new presentation to hospital.
- Discover he is marginally housed.
- Discover he has personality disorder issues.
- Refuses to work with physical therapy.
- At discharge:
- Patient cannot be placed in facility due to a criminal history.
- Discharged to "home," told to follow up with PCP (hasn’t been in over a year).
- Readmission:
- Reports he gained 20 lbs in 8 days.
- "Oh honey, it always takes them about a week to tune me up."
- Grabs remote, turns on TV and orders dinner.
Slide 21: Do not over-medicalize root causes of readmissions
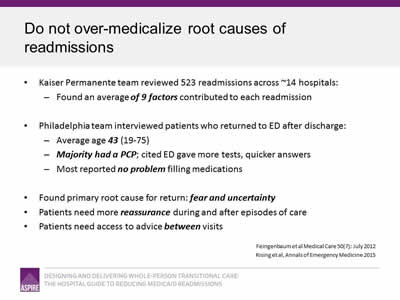
- Kaiser Permanente team reviewed 523 readmissions across ~14 hospitals:
- Found an average of 9 factors contributed to each readmission.
- Philadelphia team interviewed patients who returned to ED after discharge:
- Average age 43 (19-75).
- Majority had a PCP; cited ED gave more tests, quicker answers.
- Most reported no problem filling medications.
- Found primary root cause for return: fear and uncertainty.
- Patients need more reassurance during and after episodes of care.
- Patients need access to advice between visits.
Sources: Feingenbaum et al., Medical Care 50(7): July 2012; Rising et al, Annals of Emergency Medicine.
Slide 22: Readmission Review Tool
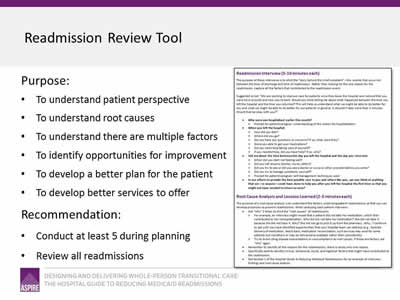
- Purpose:
- To understand patient perspective.
- To understand root causes.
- To understand there are multiple factors.
- To identify opportunities for improvement.
- To develop a better plan for the patient.
- To develop better services to offer.
- Recommendation:
- Conduct at least 5 during planning.
- Review all readmissions.
Image: A page from the Readmission Review Tool.
Slide 23: Using Data To Identify Your High Risk Populations
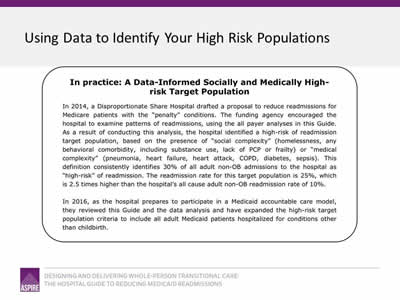
In practice: A Data-Informed Socially and Medically High-Risk Target Population
In 2014, a Disproportionate Share Hospital drafted a proposal to reduce readmissions for Medicare patients with the "penalty" conditions. The funding agency encouraged the hospital to examine patterns of readmissions, using the all payer analyses in this Guide. As a result of conducting this analysis, the hospital identified a high-risk of readmission target population, based on the presence of "social complexity" (homelessness, any behavioral comorbidity, including substance use, lack of PCP or frailty) or "medical complexity" (pneumonia, heart failure, heart attack, COPD, diabetes, sepsis). This definition consistently identifies 30% of all adult non-OB admissions to the hospital as "high-risk" of readmission. The readmission rate for this target population is 25%, which is 2.5 times hgher than the hospital's all cause adult non-OB readmission rate of 10%.
In 2016, as the hospital prepares to participate in a Medicaid accountable care model, they reviewed this Guide and the data analysis and have expanded the high-risk target population criteria to include all adult Medicaid patients hospitalized for conditions other than childbirth.
Slide 24: Summary
- Know your data.
- Elicit the root causes of readmissions.
- Use this information to:
- Identify groups of patients with high readmission rates.
- Determine how to target readmission reduction efforts.
- Better understand "why" patients return.
- Identify opportunities for improvement.
- Design strategies that will address patients’ transitional care needs.
Slide 25: Thank you
Thank you for your commitment to reducing readmissions
Amy E. Boutwell, MD, MPP
Collaborative Healthcare Strategies
amy@collaborativehealthcarestrategies.com
Angel Bourgoin, PhD & Jim Maxwell, PhD
John Snow, Inc.
Angel_Burgoin@jsi.com; Jim_Maxwell@jsi.com


