Toolkit for Using the AHRQ Quality Indicators - A “How to” Guide for Improving Hospital Quality and Safety
Slide presentation of the webinar held on August 1, 2016
Slide 1
Need Help?
- Audio is provided through your computer; don't forget to turn on your speakers! Closed captioning is also available.
- For technical help, please type your question in the Q&A box on your screen.
Slide 2
Toolkit for Using the AHRQ Quality Indicators
A "How to" Guide for Improving Hospital Quality and Safety
Webinar Monday,
August 1, 2016
1:00-‐2:30 pm ET
Slide 3
Agenda
- Welcome
- Overview of the AHRQ QIs
- Q&A
- A tour of the QI Toolkit
- A conversation with a Toolkit user
- Q&A
Slide 4
Accessing the QI Toolkit
Toolkit for Using the AHRQ Quality Indicators
How To Improve Hospital Quality and Safety
Available on the AHRQ Web site at http://www.ahrq.gov/professionals/systems/hospital/qitoolkit/index.html
Slide 5
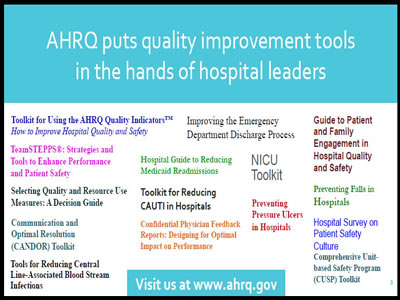
AHRQ puts quality improvement tools in the hands of hospital leaders
Toolkit for Using the AHRQ Quality Indicators™
How to Improve Hospital Quality and Safety
TeamSTEPPS®: Strategies and Tools to Enhance Performance and Patient Safety
Selecting Quality and Resource Use Measures: A Decision Guide
Communication and Optimal Resolution (CANDOR) Toolkit
Tools for Reducing Central Line-Associated Blood Stream Infections
Improving the Emergency Department Discharge Process
Hospital Guide to Reducing Medicaid Readmissions
Toolkit for Reducing CAUTI in Hospitals
Confidential Physician Feedback Reports: Designing for Optimal Impact on Performance
NICU Toolkit
Preventing Pressure Ulcers in Hospitals
Guide to Patient and Family Engagement in Hospital Quality and Safety
Preventing Falls in Hospitals
Hospital Survey on Patient Safety Culture
Comprehensive Unit-based Safety Program (CUSP) Toolkit
Visit us at www.ahrq.gov
Slide 6
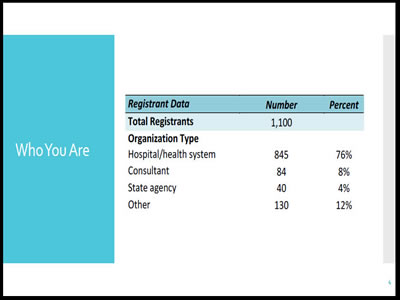
Who You Are
| Registrant Data | Number | Percent |
|---|---|---|
| Total Registrants | 1,100 | |
| Organization Type | ||
| Hospital/health system | 845 | 76% |
| Consultant | 84 | 8% |
| State agency | 40 | 4% |
| Other | 130 | 12% |
Slide 7

Today's Speakers
Pamela Owens, PhD
Senior Research
Scientist
AHRQ
Peter Hussey, PhD
Senior Policy
Researcher
RAND Corporation
Courtney Gidengil, MD, MPH
Physician Scientist
RAND Corporation
Ellen Robinson, PT
Clinical Quality Specialist
Harborview Medical Center
Seattle, Washington
Slide 8
Need Help?
- Hearing us: Audio is provided through your computer's speakers. Closed captioning is also available.
- Asking questions: Please type your questions in the Q&A box on your screen.
Slide 9

Overview of the AHRQ QIs
Pam Owens, PhD, Senior Research Scientist
AHRQ
Slide 10
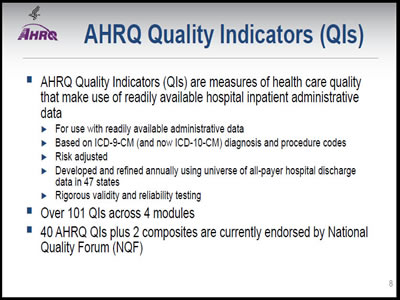
AHRQ Quality Indicators (QIs)
- AHRQ Quality Indicators (QIs) are measures of health care quality that make use of readily available hospital inpatient administrative data
- For use with readily available administrative data
- Based on ICD-9-CM (and now ICD-10-CM) diagnosis and procedure codes
- Risk adjusted
- Developed and refined annually using universe of all-payer hospital discharge data in 47 states
- Rigorous validity and reliability testing
- Over 101 QIs across 4 modules
- 40 AHRQ QIs plus 2 composites are currently endorsed by National Quality Forum (NQF)
Slide 11
Origins of the AHRQ Quality Indicators (QIs)
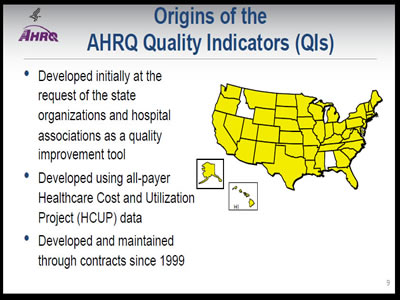
- Developed initially at the request of the state organizations and hospital associations as a quality improvement tool
- Developed using all-payer Healthcare Cost and Utilization Project (HCUP) data
- Developed and maintained through contracts since 1999
Slide 12
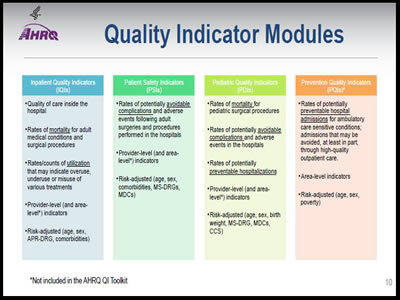
Quality Indicator Modules
Inpatient Quality Indicators (IQIs)
- Quality of care inside the hospital
- Rates of mortality for adult medical conditions and surgical procedures
- Rates/counts of utilization that may indicate overuse, underuse or misuse of various treatments
- Provider-level (and area-level*) indicators
- Risk-adjusted (age, sex, APR-DRG, comorbidities)
Patient Safety Indicators (PSIs)
- Rates of potentially avoidable complications and adverse events following adult surgeries and procedures performed in the hospitals
- Provider-level (and area-level*) indicators
- Risk-adjusted (age, sex, comorbidities, MS-DRGs, MDCs)
Pediatric Quality Indicators (PDIs)
- Rates of mortality for pediatric surgical procedures
- Rates of potentially avoidable complications and adverse events in the hospitals
- Rates of potentially preventable hospitalizations
- Provider-level (and area-level*) indicators
- Risk-adjusted (age, sex, birth weight, MS-DRG, MDCs, CCS)
Prevention Quality Indicators (PQIs)*
- Rates of potentially preventable hospital admissions for ambulatory care sensitive conditions; admissions that may be avoided, at least in part, through high-quality outpatient care.
- Area-level indicators
- Risk-adjusted (age, sex,poverty)
*Not included in the AHRQ QI Toolkit
Slide 13
Ensuring Quality of the Quality Indicators
- Annual updates to align with coding changes
- Rigorous testing with every annual update to assess:
- Reliability
- Validity
- Alignment with evolving evidence base
- NQF endorsement for many QIs
- Additional testing performed
- Extensive review of testing, feasibility, use
- http://www.qualityindicators.ahrq.gov/Modules/list_ahrq_qi.aspx
- Improvements to QIs driven by
- Testing
- NQF, other expert feedback
- User feedback
- Evolving evidence base
Slide 14
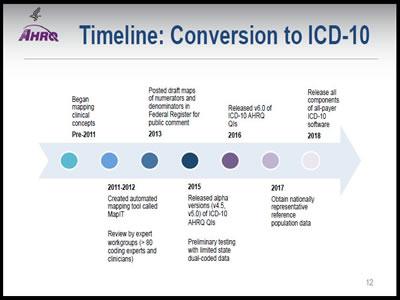
Timeline: Conversion to ICD-10
Pre-2011
- Began mapping clinical concepts
2011-2012
- Created automated mapping tool called MapIT
- Review by expert workgroups (> 80 coding experts and clinicians)
2013
- Posted draft maps of numerators and denominators in Federal Register for public comment
2015
- Released alpha versions (v4.5, v5.0) of ICD-10 AHRQ QIs
- Preliminary testing with limited state dual-coded data
2016
- Released v6.0 of ICD-10 AHRQ QIs
2017
- Obtain nationally representative reference population data
2018
- Release all components of all-payer ICD-10 software
Slide 15
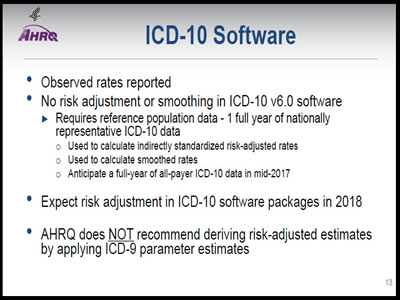
ICD-10 Software
- Observed rates reported
- No risk adjustment or smoothing in ICD-10 v6.0 software
- Requires reference population data - 1 full year of nationally representative ICD-10 data
- Used to calculate indirectly standardized risk-adjusted rates
- Used to calculate smoothed rates
- Anticipate a full-year of all-payer ICD-10 data in mid-2017
- Requires reference population data - 1 full year of nationally representative ICD-10 data
- Expect risk adjustment in ICD-10 software packages in 2018
- AHRQ does NOT recommend deriving risk-adjusted estimates by applying ICD-9 parameter estimates
Slide 16
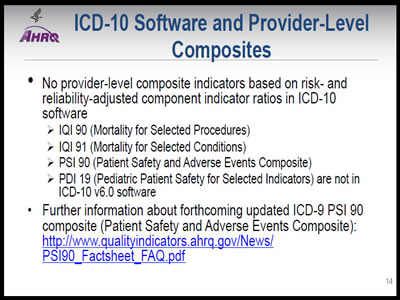
ICD-10 Software and Provider-Level Composites
- No provider-level composite indicators based on risk- and reliability-adjusted component indicator ratios in ICD-10 software
- IQI 90 (Mortality for Selected Procedures)
- IQI 91 (Mortality for Selected Conditions)
- PSI 90 (Patient Safety and Adverse Events Composite)
- PDI 19 (Pediatric Patient Safety for Selected Indicators) are not in ICD-10 v6.0 software
- Further information about forthcoming updated ICD-9 PSI 90 composite (Patient Safety and Adverse Events Composite): http://www.qualityindicators.ahrq.gov/News/PSI90_Factsheet_FAQ.pdf
Slide 17
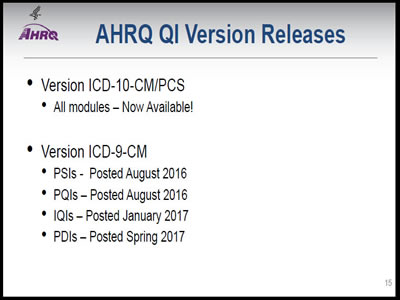
AHRQ QI Version Releases
- Version ICD-10-CM/PCS
- All modules – Now Available!
- Version ICD-9-CM
- PSIs - Posted August 2016
- PQIs – Posted August 2016
- IQIs – Posted January 2017
- PDIs – Posted Spring 2017
Slide 18
Questions and Comments on AHRQ Quality Indicators
Please email all additional inquiries to qisupport@ahrq.hhs.gov
Slide 19
A Tour of the QI Toolkit
Courtney Gidengil, MD, MPH, Physician Scientist
RAND Corporation
Peter Hussey, PhD, Senior Policy Researcher
RAND Corporation
Slide 20
What is the AHRQ QI Toolkit?
- Set of tools that hospitals can use to help improve performance in quality and patient safety
- Toolkit designed for use with the AHRQ QIs, but could be used with other quality measures
- Applicable for hospitals with differing quality improvement infrastructures, knowledge and skills
Slide 21
Toolkit Development
- AHRQ QI Toolkit first released in 2011, and updated in 2014
- 2016 version expanded to include PDIs, and the change from ICD-‐9 to ICD-‐10
- 2016 version tested with 20 hospitals
- In-depth evaluation with 6 hospitals
Slide 22
How Can Hospitals Use the Toolkit?
- Serves as a "resource inventory" from which hospitals can select tools
- Different audiences for each tool (e.g., quality officer, finance officer, programmer)
Slide 23
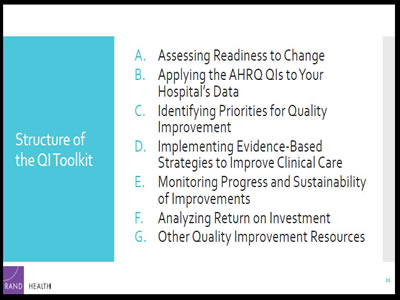
Structure of the QI Toolkit
- Assessing Readiness to Change
- Applying the AHRQ QIs to Your Hospital's Data
- Identifying Priorities for Quality Improvement
- Implementing Evidence-‐Based Strategies to Improve Clinical Care
- Monitoring Progress and Sustainability of Improvements
- Analyzing Return on Investment
- Other Quality Improvement Resources
Slide 24
A. Readiness to Change
Slide 25
Introduction (Tool A.1)
- Serves as a navigational guide
- Describes format for each tool, which includes:
- Action steps
- Brief description of the tool
- Target users
- For Pediatric QI Toolkit, explains unique issues in pediatric QI
Slide 26
Fact Sheets on AHRQ Quality Indicators (Tools A.1.a-c)
- Introduces the AHRQ QIs (PSIs, IQIs, PDIs)
- Provides 2012 national rates for each indicator, if available [based on Healthcare Cost and Utilization Project (HCUP), State Inpatient Databases]
- Indicates National Quality Forum endorsement status for each indicator
Slide 27
Board/Senior Leadership PowerPoint® Presentation on the Quality Indicators (Tool A.2)
- Helps Board members and senior leadership understand clinical and financial implications of improving performance on the AHRQ QIs
- The "notes" view in PowerPoint® has additional instructions for using this tool
Slide 28
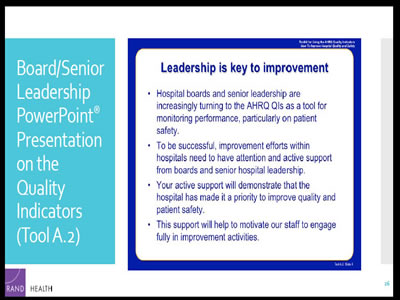
Board/Senior Leadership PowerPoint® Presentation on the Quality Indicators (Tool A.2)
Leadership is key to improvement
- Hospital boards and senior leadership are increasingly turning to the AHRQ QIs as a tool for monitoring performance, particularly on patient safety.
- To be successful, improvement efforts within hospitals need to have attention and active support from boards and senior hospital leadership.
- Your active support will demonstrate that the hospital has made it a priority to improve quality and patient safety.
- This support will help to motivate our staff to engage fully in improvement activities.
Slide 29
Getting Ready for Change Self-Assessment (Tool A.3)
- Provides a survey template to assess capabilities that should be in place before implementing improvement efforts
- Senior hospital executives (e.g. CMO, chief quality officer, nursingleadership, and members of hospital's quality committee) independently self-‐assess, then meet as a group to discuss
Slide 30
Getting Ready for Change Self-Assessment (Tool A.3)
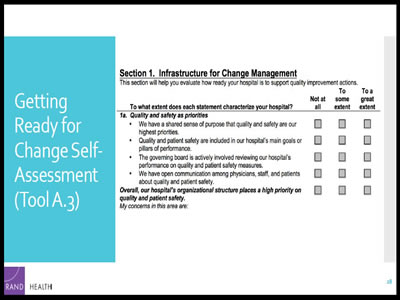
This figure shows section one of the Getting Ready for Change Self-Assessment. It includes several statements, and the user is instructed to choose the extent to which each statement characterizes their hospital. The choices are "Not at all," "To some extent," and "To a great extent."
1a. Quality and Safety as Priorities
We have a shared sense of purpose that quality and safety are our highest priorities (not at all, to some extent and to a great extent)
Quality and patient safety are included in our hospital's main goals or pillars of performance (not at all, to some extent and to a great extent)
The governing board is actively involved reviewing our hospital's performance on quality and patient safety measures (not at all, to some extent and to a great extent)
We have open communication among physicians, staff, and patients about quality and patient safety (not at all, to some extent and to a great extent).
Slide 31
Case Studies of Improvement Implementation (Tool A.4)
- Two hospital case studies demonstrating use of the QI Toolkit for improvement
- Describes tools used by the hospitals to improve performance on selected indicators
- Presents pre/post data showing impact
- Shares lessons learned
Slide 32
B. Applying QIs to Hospital Data
Slide 33
Applying the AHRQ Quality Indicators to Hospital Data(Tool B.1)
- Overview of the AHRQ QIs and data requirements
- Descriptions of the rates calculated for the QIs and how to work with them
- Example of how to interpret a hospital's QI rates
- Limited by available software (no risk-adjustment for ICD-10 data)
Slide 34
QI Rates Generated by the AHRQ Software (Tools B.2.a and B.2.b)
- Support for both the AHRQ SAS Programs (Tool B.2a) and Windows QI Software (Tool B.2b)
- Outline of the steps and programs used to calculate rates for the QIs
- Notes for analysts and programmers on potential issues when working with the SAS programs/Windows software
- Example of the output from the SAS program/Windows software
Slide 35
Displaying and Sharing QI Trends and Rates (Tools B.3.a and B.3.b)
- Excel® worksheets (Tool B.3a) generate charts on AHRQ QI data, trends, and rates to populate the companion PowerPoint® Presentation
- Companion PowerPoint® presentation (Tool B.3b) is a template for sharing AHRQ QI results and discussion of data analysis
Slide 36
Documentation and Coding for Quality Indicators (Tool B.4)
- Designed to facilitate improvements to documentation and coding processes to ensure QI rates are accurate
- Describes procedures to address problems with documentation and coding practices
- Illustrates issues that can arise when documenting and coding each QI
- Updated for ICD-‐10 as feasible
Slide 37
Assessing Indicator Rates Using Trends and Comparators (Tool B.5)
- Supports hospitals' understanding of how their QI rates compare to:
- performance in previous years (trends)
- similar hospitals if available
- Can help identify which QIs the hospital may need to address for quality improvement
Slide 38
C. Identifying Priorities for Quality Improvement
Slide 39
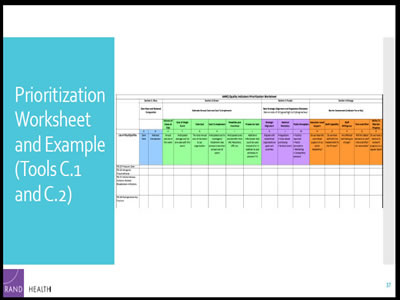
Prioritization Worksheet and Example (Tools C.1 and C.2)
This is an example of the prioritzation worksheet. It contains Section 1: Own Rate and National Comparator, Section 2: Estimate Annual Cost and Cost to Implement, Section 3: Rate Strategic Alignment and Regulatory Mandates, and Section 4: Barrier Assessment.
Slide 40
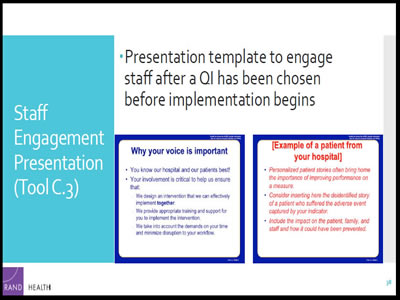
Staff Engagement Presentation (Tool C.3)
- Presentation template to engage staff after a QI has been chosen before implementation begins
Why your voice is important
You know our hospital and our patients best!
Your involvement is critical to help us ensure that: we design an intervention that we can effectively implement together, we provide appropriate training and support for you to implement the intervention, and we take into account the demands on your time and minimize disruption to your workflow.
Example of a patient from your hospital
- Personalized patient stories often bring home the importance of improving performance on a measure.
- Consider inserting here the deidentified story of a patient who suffered the adverse event captured by your indicator.
- Include the impact on the patient, family, and staff and how it could have been prevented.
Slide 41
D. Implementation Methods
Slide 42
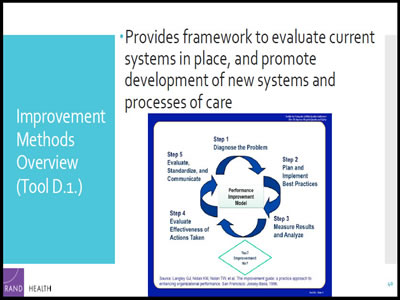
Improvement Methods Overview (Tool D.1.)
- Provides framework to evaluate current systems in place, and promote development of new systems and processes of care
This figure shows the five steps in the Performance Improvement Model Framework.
Step 1: Diagnose the Problem
Step 2: Plan and Implement Best Practices
Step 3: Measure Results and Analyze (Improvement? Yes/No)
Step 4: Evaluate Effectiveness of Actions Taken
Step 5: Evaluate, Standardize, and Communicate
Slide 43
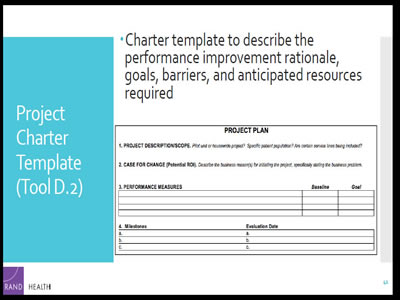
Project Charter Template (Tool D.2)
- Charter template to describe the performance improvement rationale, goals, barriers, and anticipated resources required
The Project Plan Template is a form with four different elements. The first element is the project description or scope. It asks whether it is a pilot unit or housewide project, whether there is a specific patient population, and if certain service lines are included. The second element is the case for change, or potential return on investment. Here the user can describe the business reasons for initiating the project, and specifically state the business problem. The third element is for performance measures, where the user can set the baseline and goal for each measure. The fourth and final element is a space for the user to list the milestones and the evaluation date for each.
Slide 44
Best Practices and Suggestions for Improvement (Tool D.4)
- Begins with an introduction to the clinical best practices (Tool D.4)
- Tools D4.a through D4.y outline best practices for selected PSIs, IQIs, and PDIs
Slide 45
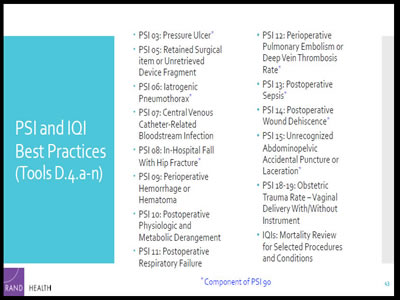
PSI and IQI Best Practices (Tools D.4.a-‐n)
- PSI 03: Pressure Ulcer*
- PSI 05: Retained Surgical item or Unretrieved Device Fragment
- PSI 06: Iatrogenic Pneumothorax*
- PSI 07: Central Venous Catheter-‐Related Bloodstream Infection
- PSI 08: In-‐Hospital Fall With Hip Fracture*
- PSI 09: Perioperative Hemorrhage or Hematoma
- PSI 10: Postoperative Physiologic and Metabolic Derangement
- PSI 11: Postoperative Respiratory Failure
- PSI 12: Perioperative Pulmonary Embolism or Deep Vein Thrombosis Rate*
- PSI 13: Postoperative Sepsis*
- PSI 14: Postoperative Wound Dehiscence*
- PSI 15: Unrecognized Abdominopelvic Accidental Puncture or Laceration*
- PSI 18-‐19: Obstetric Trauma Rate – Vaginal Delivery With/Without Instrument
- IQIs: Mortality Review for Selected Procedures and Conditions
Slide 46
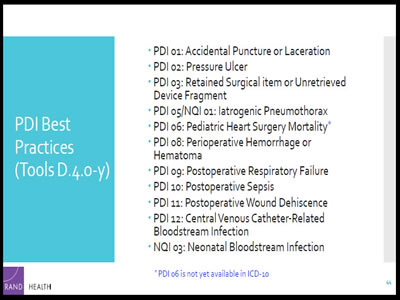
PDI Best Practices (Tools D.4.o-y)
- PDI 01: Accidental Puncture or Laceration
- PDI 02: Pressure Ulcer
- PDI 03: Retained Surgical item or Unretrieved Device Fragment
- PDI 05/NQI 01: Iatrogenic Pneumothorax
- PDI 06: Pediatric Heart Surgery Mortality*
- PDI 08: Perioperative Hemorrhage or Hematoma
- PDI 09: Postoperative Respiratory Failure
- PDI 10: Postoperative Sepsis
- PDI 11: Postoperative Wound Dehiscence
- PDI 12: Central Venous Catheter-‐Related Bloodstream Infection
- NQI 03: Neonatal Bloodstream Infection
* PDI 06 is not yet available in ICD-‐10
Slide 47
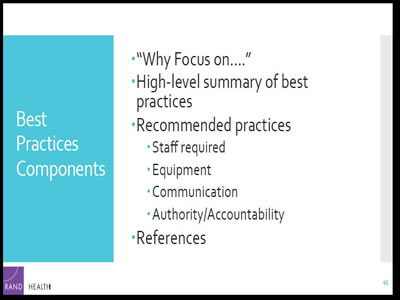
Best Practices Components
- "Why Focus on…."
- High-level summary of best practices
- Recommended practices
- Staff required
- Equipment
- Communication
- Authority/Accountability
- References
Slide 48
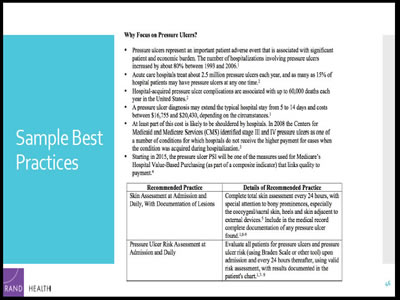
Sample Best Practices
Pressure ulcers represent an important patient adverse event that is associated with significant patient and economic burden. The number of hospitalizations involving pressure ulcers increased by about 80% between 1993 and 2006. Acute care hospitals treat about 2.5 million pressure ulcers each year, and as many as 15% of hospital patients may have pressure ulcers at any one time. Hospital-acquired pressure ulcer complications are associated with up to 60,000 deaths each year in the United States. A pressure ulcer diagnosis may extend the typical hospital stay from 5 to 14 days and costs between $16,755 and $20,430, depending on the circumstances. At least part of this cost is likely to be shouldered by hospitals. In 2008 the Centers for Medicaid and Medicare Services (CMS) identified stage III and IV pressure ulcers as one of a number of conditions for which hospitals do not receive the higher payment for cases when the condition was acquired during hospitalization. Starting in 2015, the pressure ulcer PSI will be one of the measures used for Medicare's Hospital Value-Based Purchasing (as part of a composite indicator) that links quality to payment.
Skin Assessment at Admission and Daily, with documentation of lesions. Complete total skin assessment every 24 hours, with special attention to bony prominences, especially the coccygeal/sacral skin, heels and skin adjacent to external devices. Include in the medical record complete documentation of any pressure ulcer found. Pressure Ulcer Risk Assessment at Admission and Daily: Evaluate all patients for pressure ulcers and pressure ulcer risk (using Braden Scale or other tool) upon admission and every 24 hours thereafter, using valid risk assessment, with results documented in the patient's chart.
Slide 49
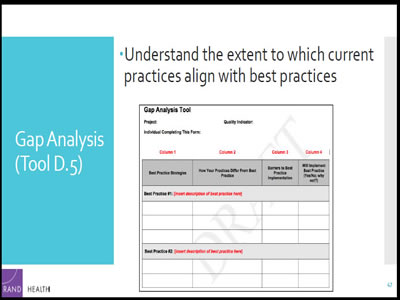
Gap Analysis (Tool D.5)
- Understand the extent to which current practices align with best practices
This is a form for performing gap analyses. It contains places to list the project, the individual completing this form, and the quality indicator. The form includes 4 columns, including best practice strategies, how your practices differ from best practices, barriers to best practice implementation, and if the user will implement best practices.
Slide 50
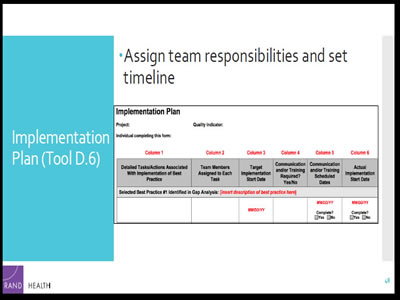
ImplementationPlan (Tool D.6)
- Assign team responsibilities and set timeline
This figure includes the team responsibilities section of the implementation plan. These columns include detailed tasks associated with the implementation of the best practice, team members assigned to each task, target implementation start date, if communication or training is required, communication or training scheduled dates, and actual implementation start date.
Slide 51
Implementation Measurement (Tool D.7)
- Supports the measurement of progress in improving work and clinical care processes
- Includes an example of how to monitor progress once implementation has begun
Slide 52
Project Evaluation and Debriefing (Tool D.8)
- Understand what worked in the implementation process and what needs improvement
- Identify barriers and contributors to success
- Identify additional clinical areas for spread of best practices
- Identify follow-up work
- Determine how to communicate results of project
Slide 53
E. Monitoring Progress and Sustainability of Improvements
Slide 54
Monitoring Progress for Sustainable Improvement (Tool E.1)
- What is involved in ongoing monitoring?
- Establish a schedule for regular reporting
- Develop report formats to communicate clearly
- Establish procedures for acting on problems identified
- Assess sustainability on a periodic basis
Slide 55
F. Return-on-Investment Analysis
Slide 56
Return on Investment Estimation (Tool F.1)
- Step-by-step guide to calculating ROI
- Worksheets for calculating net costs and returns
- Case study for ROI calculation
- Additional guidance for effective ROI calculation
- Resources and information sources
Slide 57
G. Additional Quality Improvement Resources
Slide 58
Comprehensive QI Guides and Specific Tools to Support Change (Tools G.1 and G2)
- Available Comprehensive Quality Improvement Guides (Tool G.1)
- e.g., Overview of the Institute for Healthcare Improvement (IHI) Tools
- Specific Tools To Support Change (Tool G.2)
- e.g., AHRQ's Confidential Physician Feedback Reports: Designing for Optimal Impact on Performance
Slide 59
Summary of the AHRQ QI Toolkit
- Supports hospitals with differing quality infrastructures, knowledge, and skills in making quality and patient safety improvements
- Addresses all stages of improvement, from self-‐assessment to ongoing monitoring
- Includes tools that are practical, easy to use, and for a wide variety of audiences
- Serves as a "resource inventory" from which hospitals can pick and choose tools to meet their needs
- Stand-‐alone Pediatric QI Toolkit also available
Slide 60
Harborview's Experience with the AHRQ QI Toolkit
Ellen Robinson, PT, clinical quality specialist, UW Medicine at Harborview Medical Center, Seattle
Slide 61
Harborview's Story
Please tell us about your hospital and how you started looking at the AHRQ QIs.
Slide 62
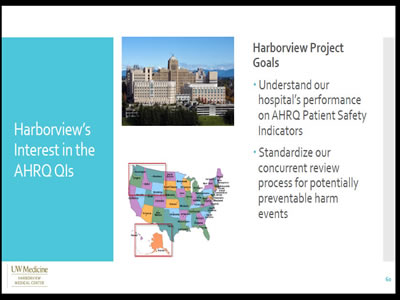
Harborview's Interest in the AHRQ QIs
Harborview Project Goals
- Understand our hospital's performance on AHRQ Patient Safety Indicators
- Standardize our concurrent review process for potentially preventable harm events
Slide 63
Harborview's Story
How did improving care for venous thromboembolism (VTE) become a priority?
Slide 64
Initial Focus: Improving Care for VTE
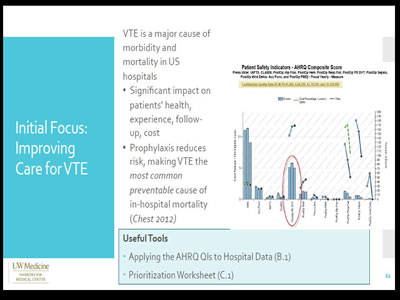
VTE is a major cause of morbidity and mortality in US hospitals
- Significant impact on patients' health, experience, follow-up, cost
- Prophylaxis reduces risk, making VTE the most common preventable cause of in-hospital mortality (Chest 2012)
Useful Tools
|
This graph shows that VTE is the most common preventable cause of in-hospital mortality.
Slide 65
Harborview's Story
How did you identify opportunities and solutions for improvement in care for VTEs?
Slide 66
Harborview's Approach to Improvement
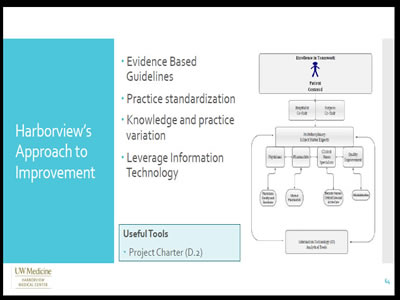
- Evidence Based Guidelines
- Practice standardization
- Knowledge and practice variation
- Leverage Information Technology
|
Useful Tools
|
This flow chart displays the excellence in teamwork flow chart for patient-centered treatment. It flows down from the hospitalist co-chair and surgeon co-chair down to multidisciplinary subject matter experts to information technology analytical tools and back. Then it flows down and between physicians, pharmacists, clinical nurse specialists, and quality improvement.
Slide 67
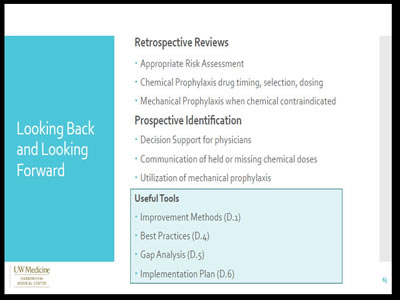
Looking Back and Looking Forward
Retrospective Reviews
- Appropriate Risk Assessment
- Chemical Prophylaxis drug timing, selection, dosing
- Mechanical Prophylaxis when chemical contraindicated
Prospective Identification
- Decision Support for physicians
- Communication of held or missing chemical doses
- Utilization of mechanical prophylaxis
|
Useful Tools
|
Slide 68
Harborview's Story
What have been the biggest challenges in improving care for VTEs, and how did the QI Toolkit help you navigate those challenges?
Slide 69
Harborview's Story
What is the impact of the changes you implemented?
Slide 70
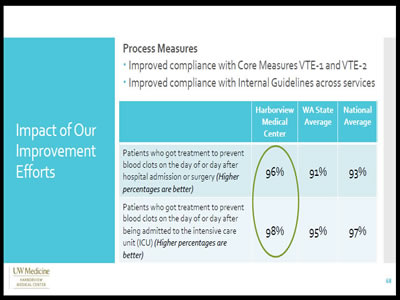
Impact of Our Improvement Efforts
Process Measures
- Improved compliance with Core Measures VTE-1 and VTE-2
- Improved compliance with Internal Guidelines across services
| Harborview Medical Center | WA State Average | National Average | |
|---|---|---|---|
| Patients who got treatment to prevent blood clots on the day of or day after hospital admission or surgery (Higher percentages are better) | 96% | 91% | 93% |
| Patients who got treatment to prevent blood clots on the day of or day after being admitted to the intensive care unit (ICU) (Higher percentages are better) | 98% | 95% | 97% |
Slide 71
Impact of Our Improvement Efforts
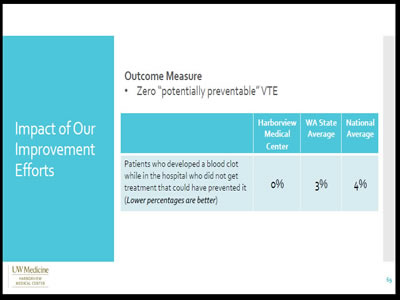
Outcome Measure
- Zero "potentially preventable" VTE
| Harborview Medical Center | WA State Average | National Average | |
|---|---|---|---|
| Patients who developed a blood clot while in the hospital who did not get treatment that could have prevented it (Lower percentages are better) | 0% | 3% | 4% |
Slide 72
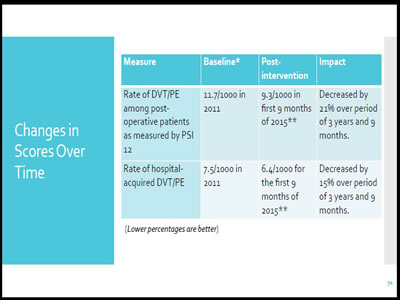
Changes in Scores Over Time
| Measure | Baseline* | Post-intervention | Impact |
|---|---|---|---|
| Rate of DVT/PE among post-‐operative patients as measured by PSI 12 | 11.7/1000 in 2011 | 9.3/1000 in first 9 months of 2015** | Decreased by 21% over period of 3 years and 9 months. |
| Rate of hospital-acquired DVT/PE | 7.5/1000 in 2011 | 6.4/1000 for the first 9 months of 2015** | Decreased by 15% over period of 3 years and 9 months. |
(Lower percentages are better)
Slide 73
Harborview's Story
What lessons or advice would you offer to other hospitals about using the QI Toolkit or improving patient safety more broadly?
Slide 74
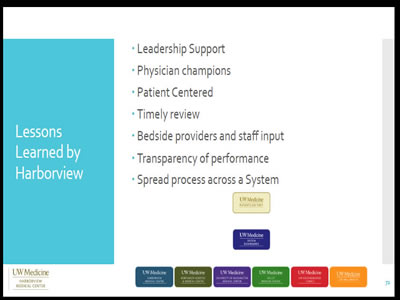
Lessons Learned by Harborview
- Leadership Support
- Physician champions
- Patient Centered
- Timely review
- Bedside providers and staff input
- Transparency of performance
- Spread process across a System
Slide 75

Questions and Comments for Panel
Slide 76
Accessing the QI Toolkit
Toolkit for Using the AHRQ Quality Indicators
How To Improve Hospital Quality and Safety
Available on the AHRQ Web site at http://www.ahrq.gov/professionals/systems/hospital/qitoolkit/index.html
Slide 77
Thank you
Please take several minutes to answer 3 evaluation questions.
Any suggestions for future quality improvement tools? Please contact us at: peggy.mcnamara@ahrq.hhs.gov


