Types of Hospitals Represented
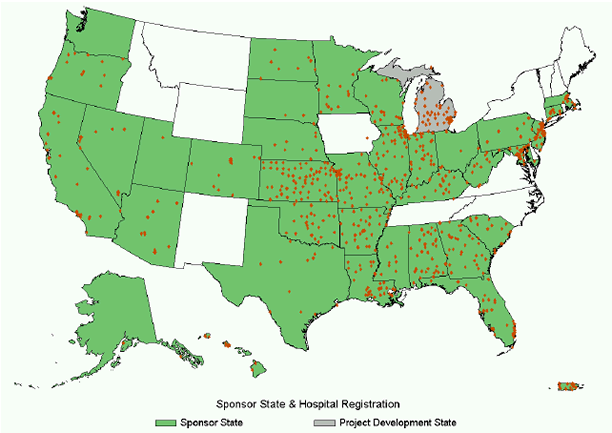
There are 861 registered hospitals participating in the initiative as of July 15, 2013. These hospitals are located in 37 States, the District of Columbia, and Puerto Rico and have been recruited by 39 sponsors (37 State hospital associations, plus Puerto Rico and UHC's HEN; Figure 2). To assess hospital characteristics for cohorts 1–6, participating hospital data were linked to the annual AHA 2010 National Survey results. Hospitals not participating in the AHA survey (n=44) were excluded from analyses examining hospital characteristics.
Figure 2. Sponsor State Hospital Associations and Hospitals Registered in the Projecta,b,c

a The work on which this project is based originated in Michigan, the project development State.
b The State of Washington does not disclose names of participating hospitals.
c Map includes all available hospitals and States (including cohort 6) registered in the Care Counts system as of July 15th, 2013. Units sponsored by missing AHA Survey data are not shown.
The majority of participating hospitals are categorized as having between 26 and 175 total hospital beds (44.9%; n=367), a finding similar to the AHA National Survey data (51%; n=3,201). On average, participating hospitals have 185 beds (median = 117; standard deviation [SD] = 204; Min = 6; Max = 1,597), a slightly larger number of beds than the AHA National Survey average of 154 (median = 87; SD = 184; Min = 1; Max = 2,261). Additional characteristics of participating hospitals, including comparisons to national data, are shown in Table 3.
Table 3. Characteristics of Registered Hospitals for Cohorts 1–6 (n=817)a as Compared With Like Hospital Data From the AHA National Survey
| Category | Registered Hospitalsb (n=817) |
National Hospitalsc (n=6,334) |
||
|---|---|---|---|---|
| n | % | N | % | |
| Bed Size Category | ||||
| 1–25 | 138 | 16.9% | 1,249 | 19.7% |
| 26–175 | 367 | 44.9% | 3,201 | 50.5% |
| 176–325 | 174 | 21.3% | 1,064 | 16.8% |
| 326–475 | 73 | 8.9% | 455 | 7.2% |
| >475 | 65 | 8.0% | 365 | 5.8% |
| Hospital Type | ||||
| System | 426 | 52.1% | 3,669 | 57.9% |
| Rural | 333 | 40.8% | 2,226 | 35.1% |
| Teaching | 239 | 29.3% | 1,543 | 24.4% |
| Critical Access | 183 | 22.4% | 1,315 | 20.8% |
| In Top 100 Largest Cities |
112 | 13.7% | 1,143 | 18.0% |
a. Represents the total number of hospitals registered in the project that could be linked to their AHA 2010 National Survey results.
b. Forty-four hospitals could not be linked to their AHA 2010 National Survey results and were excluded.
c. Represents the total number of hospitals included in the AHA 2010 National Survey results.
Types of Units Represented
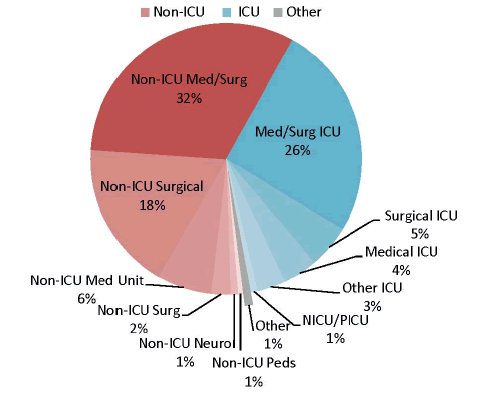
Figure 3 depicts the types of units registered in the project (n=1,366 registered units). More than 60 percent of the registered units are non-ICUs, with the majority of these being medical/surgical units (38%).
Figure 3. Types of Units Registered in the Project

Data Submission
Within each State, there is some variation in the lag time between the data collection period and the actual data submission date. The majority of units are entering data directly into Care Counts; therefore their data are submitted within 45 days immediately following the data collection period; however, the remaining units submit data through the State leads after retrieval from another system, such as CDC's NHSN, which can result in up to a three-month lag in their submission. Table 4 presents the outcome data submission rates by cohort as of July 15, 2013, for all expected measurement periods across all units not formally withdrawn from the initiative.
Table 4. Outcome Data Submission by Cohort
| Cohort | Baseline Collection Periods | Post-Baseline Collection Periods | |||||||
|---|---|---|---|---|---|---|---|---|---|
| 1 | 2 | 3 | 1 | 2 | 3 | 4 | 5 | 6 | |
| 1 | 80% | 79% | 77% | 77% | 77% | 76% | 30% | 66% | 15% |
| 2 | 86% | 85% | 87% | 86% | 81% | 77% | 71% | 65% | 56% |
| 3 | 98% | 98% | 98% | 96% | 96% | 93% | 90% | 81% | 61% |
| 4 | 96% | 96% | 95% | 94% | 91% | 83% | 51% | ||
| 5 | 91% | 91% | 90% | 84% | 54% | ||||
| Total | 93% | 93% | 92% | 91% | 86% | 84% | 65% | 73% | 54% |
One hundred seventy-two units have formally withdrawn from the project and are not included in the analyses. Table 5 shows units withdrawn by cohort. Emergency departments (EDs) and post-acute care units were also excluded from outcome analyses, as these units do not incur patient or device days.
Table 5. Units Formally Withdrawn From the Project by Cohort
| Cohort | Regis- tered Units |
# of Units Formally With- drawn |
% of Units Formally With- drawn |
Post-Baseline Collection Period (Number of Units Formally Withdrawn) |
|||||
|---|---|---|---|---|---|---|---|---|---|
| 1 | 2 | 3 | 4 | 5 | 6 | ||||
| 1 | 74 | 3 | 4.1% | 1 | 2 | ||||
| 2 | 319 | 67 | 21.0% | 34 | 4 | 14 | 14 | 1 | |
| 3 | 324 | 44 | 13.6% | 10 | 17 | 3 | 4 | 8 | 2 |
| 4 | 484 | 37 | 7.6% | 13 | 14 | 9 | 1 | ||
| 5 | 128 | 20 | 15.6% | 6 | 14 | ||||
| Totals | 1,329 | 171 | 12.9% | 64 | 49 | 28 | 19 | 8 | 3 |
Additionally, submission of at least one baseline and one post-baseline data point is required for inclusion in outcomes analyses, and missing data totals for these analyses are reflected in Table 6. A total of 1,051 remaining units met the inclusion criteria for analysis. Due to the inconsistency of missing data within each of the data collection periods, these 1,051 units reflect the total number of unique units represented in analyses for all tables and graphs below and do not reflect a sum of the units across all time periods. Analyses to assess the effect of cohort participation and missing data on these key measures are ongoing.


