CAUTI rates were calculated following both the NHSN method and a population-adjusted method (go to Measures for details). Catheter utilization reflects a ratio of the total catheter days divided by the total number of patient days and is presented as a percent. Data were pooled at each time period, regardless of cohort assignment. Due to the staggered assignment of cohort startup in this nationwide effort, data submission is also staggered. As of July 15, 2013, cohorts 1, 2, and 3 have entered data for all data collection periods, cohort 4 has entered data through post-baseline data collection period four (P4), and cohort 5 has entered data through post-baseline data collection period two (P2). All remaining tables and figures reflect only these expected data submission points for cohorts 1–5. For units to be included in tables and figures depicting outcome and process measures, units had to have submitted a minimum of one baseline and one post-baseline data point.
Table 6. Units Missing Expected Data in CAUTI Rates and Catheter Utilization Ratio Figures (n=1,051)a
| Baseline | Post-Baseline Collection Period | |||||||
|---|---|---|---|---|---|---|---|---|
| 1 | 2 | 3 | 1 | 2 | 3 | 4 | 5 | 6 |
| 1.5% | 1.1% | 0.5% | 0.5% | 6.2% | 9.0% | 29.2% | 19.7% | 40.2% |
a. Post-baseline data are not yet available for cohort 4 post-baseline periods five and six or for cohort 5 post-baseline periods three through six. These units are not reflected in the denominator when calculating missing data percentages.
Outcome Measures
CAUTI Rates
CAUTI Rate Using NHSN Calculation
CAUTI rates calculated using NHSN methodology can be found in Figures 4, 5, 6, and 7. Rates were examined as: overall CAUTI rate and CAUTI rate by cohort, ICU status, and bed size.
Overall
Overall, CAUTI rates have decreased over time compared to baseline. Although variability is found across the 3 baseline periods (BL1–BL3), the average baseline CAUTI rate was 2.55 infections per 1,000 catheter days. The decrease in CAUTI rate from baseline ranges from 6.3 percent during post-baseline period two (2 months post-baseline) to 16.1 percent during post-baseline period six (14 months post-baseline), as shown in Figure 4 (go to Table 7 for all relative changes over time). Catheter utilization rates have also been measured; however, this rate has stayed relatively constant over the time periods. Regarding both measures, it is important to note that due to the project's approach of staggered cohort implementation, CAUTI rates do not yet represent the complete data for all cohorts, as only cohorts 1–3 have completed participation and all remaining cohorts continue to submit data across all collection periods. While the initial relative reduction shown represents cohorts 1–5, the relative reduction reported at P6 does not include data from cohorts 4–5 (cohort 6 has not yet completed baseline data submission and is therefore not included in the analysis). Of note, cohort 4, representing over 400 units, had a higher baseline, while cohort 5, representing less than 100 units, had a lower baseline. Therefore, caution must be exercised when interpreting relative reductions and rates in later time periods, as additional data submission and analysis is ongoing.
Figure 4. CAUTI Rate During Baseline (BL) and Post-Baseline (P) Collection Periods – NHSN Calculation – (CAUTIs/Catheter Days) x 1,000a
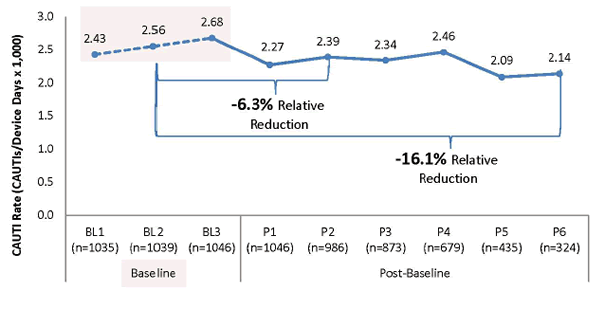
a. BL1 to P2 represents cohorts 1–5, P3 and P4 represent cohorts 1–4, and P5 and P6 represent cohorts 1–3.
Note: n's represent the total number of reporting units for corresponding collection periods.
Table 7. Relative Change From Baselinea
| Post-Baseline Collection Periods | ||||||
|---|---|---|---|---|---|---|
| 1 | 2 | 3 | 4 | 5 | 6 | |
| Units Reporting | 1,046 | 986 | 873 | 679 | 435 | 324 |
| NHSN Rate | 2.271 | 2.389 | 2.339 | 2.464 | 2.088 | 2.138 |
| Relative Reduction |
-10.9% | -6.3% | -8.2% | -3.3% | -18.1% | -16.1% |
a. Baseline aggregated over three baseline time periods (BL1–BL3).
Cohort Status
Figure 5. CAUTI Rate During Baseline (BL) and Post-Baseline (P) Collection Periods – NHSN Calculation – By Cohort Status – (CAUTIs/Catheter Days) x 1,000
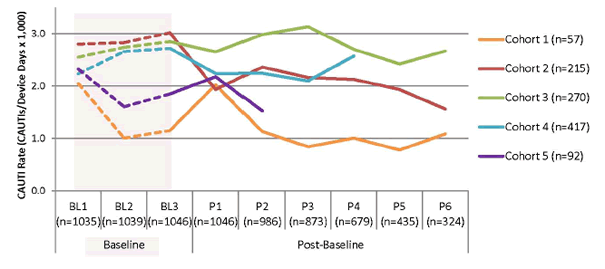
Note: n's represent the total number of reporting units for corresponding cohorts and collection periods.
ICU Status
Figure 6. CAUTI Rate During Baseline (BL) and Post-Baseline (P) Collection Periods – NHSN Calculation – By ICU Status – (CAUTIs/Catheter Days) x 1,000
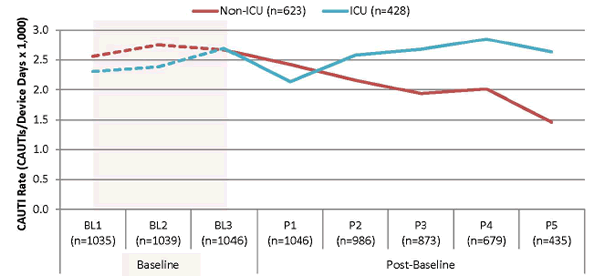
Note: n's represent the total number of reporting units for corresponding unit types and collection periods.
Bed Size
Figure 7. CAUTI Rate During Baseline (BL) and Post-Baseline (P) Collection Periods – NHSN Calculation – By Bed Size – (CAUTIs/Catheter Days) x 1,000a
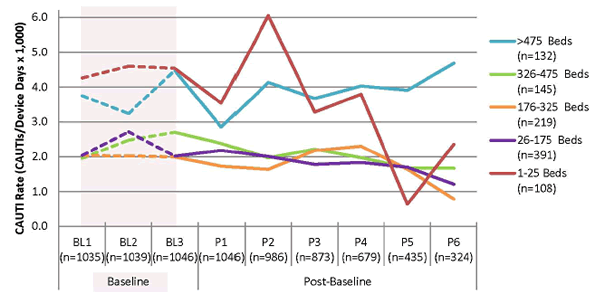
a. Fifty-six units in hospitals with unknown total bed size
Note: n's represent the total number of reporting units for corresponding bed sizes and collection periods.
Population CAUTI Rate
Population CAUTI rates can be found in Figures 8, 9, 10, and 11. Rates examined were overall population CAUTI rate and population CAUTI rate by cohort, ICU status, and bed size.
Overall
Overall, CAUTI rates have decreased over time compared to baseline. Although variability is found among the three baseline periods (BL1–BL3), the average baseline CAUTI rate is 7.97 infections per 10,000 patient days. Over time, CAUTI rates have decreased from baseline with a relative reduction ranging from 6.3 percent during post-baseline period two (2 months post-baseline) to 22.3 percent during post-baseline period six (14 months post-baseline). Table 8 shows all relative changes over time.
While the relative reduction of the population rate is 22.3 percent, it is worth noting that the relative reduction based upon device days—the CAUTI NHSN rate—is 16.1 percent. Due to the project's approach of staggered cohort implementation, CAUTI rates for later time periods do not represent the complete data for all cohorts, as only Cohorts 1–3 have reached the end of the project while all remaining cohorts continue to submit data. Therefore, caution must be exercised when interpreting relative reductions in later time periods.
Figure 8. CAUTI Rate During Baseline (BL) and Post-Baseline (P) Collection Periods – Population CAUTI Rate – (CAUTIs/Patient Days) x 10,000
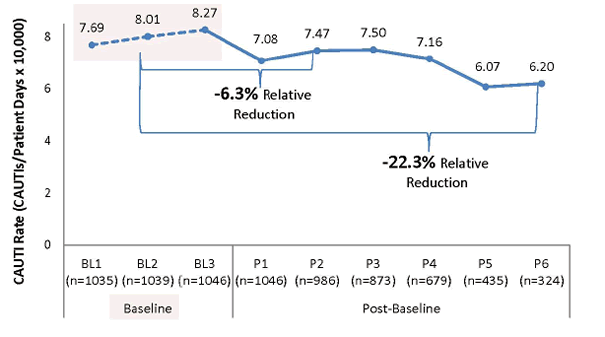
Note: n's represent the total number of reporting units for corresponding collection periods.
Table 8. Relative Change From Baselinea
| Post-Baseline Collection Periods | ||||||
|---|---|---|---|---|---|---|
| 1 | 2 | 3 | 4 | 5 | 6 | |
| Units Reporting | 1,046 | 986 | 873 | 679 | 435 | 324 |
| Population Rate | 7.083 | 7.469 | 7.504 | 7.157 | 6.073 | 6.199 |
| Relative Reduction |
-11.2% | -6.3% | -5.9% | -10.2% | -23.8% | -22.3% |
a. Baseline aggregated over three baseline time periods (BL1–BL3).
Cohort Status
Figure 9. Population CAUTI Rate by Cohort for all Baseline (BL) and Post-Baseline (P) Collection Periods – (CAUTIs/Patient Days) x 10,000
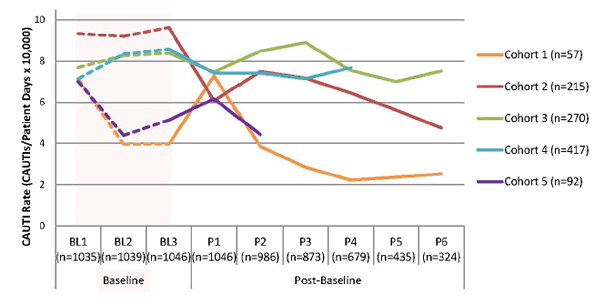
Note: n's represent the total number of reporting units for corresponding cohorts and collection periods.
ICU Status
Figure 10. CAUTI Rate During Baseline (BL) and Post-Baseline (P) Collection Periods – Population CAUTI Rate – By ICU Status – (CAUTIs/Patient Days) x 10,000
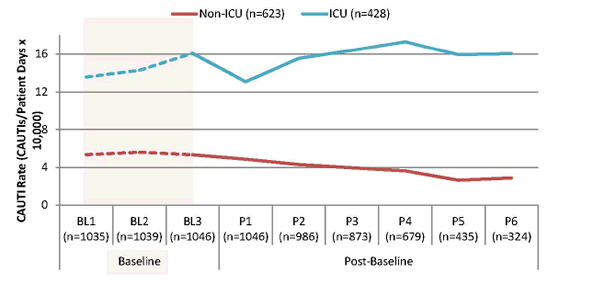
Note: n's represent the total number of reporting units for corresponding unit types and collection periods.
Bed Size
Figure 11. CAUTI Rate During Baseline (BL) and Post-Baseline (P) Collection Periods – Population CAUTI Rate – By Bed Size – (CAUTIs/Patient Days) x 10,000a
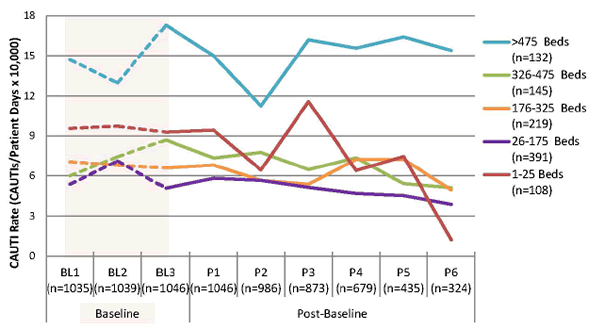
a. Fifty-six units in hospitals with unknown total bed size
Note: n's represent the total number of reporting units for corresponding bed sizes and collection periods.


