Example 5. Cost Dimensions Tool
Principal Investigator: Michael Magill
Institution: University of Utah, School of Medicine
Contact Information: michael.magill@hsc.utah.edu
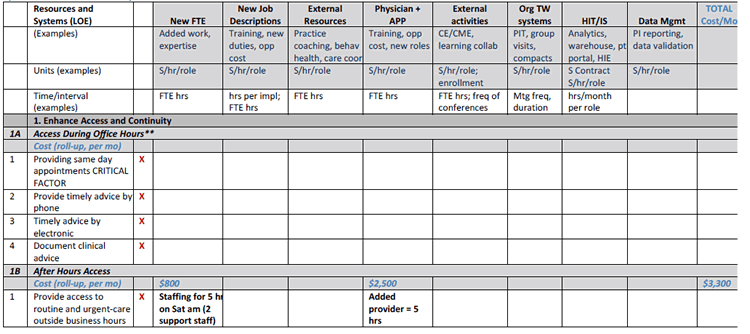
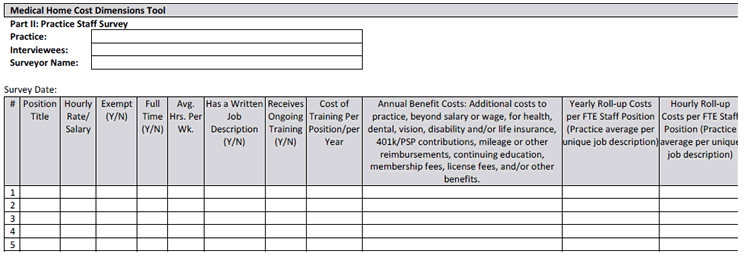
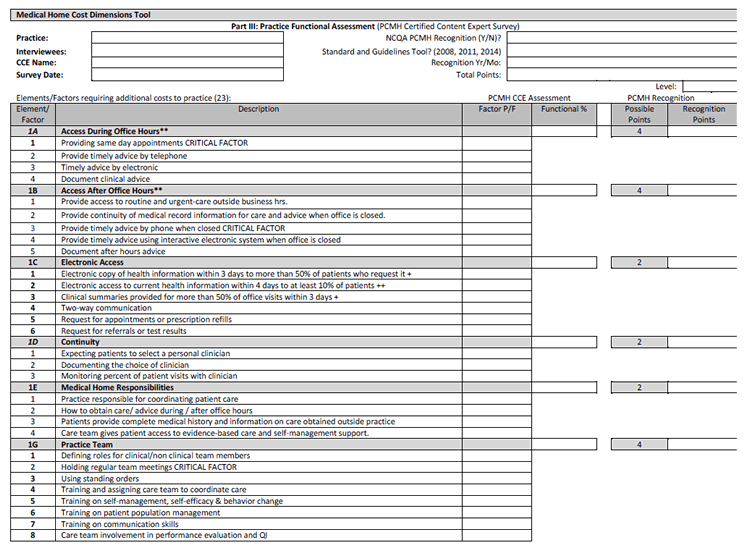
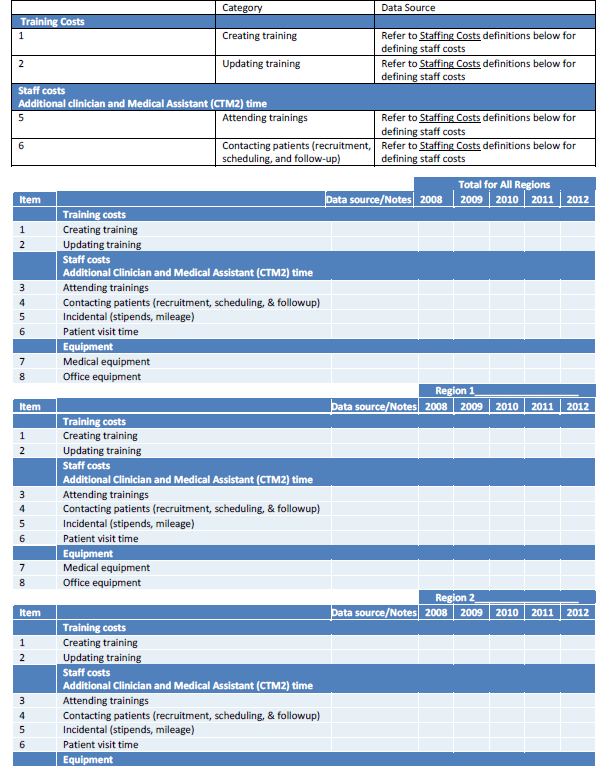
The screenshots below are extracts of the cost dimensions tool developed by Magill et al. This tool was based on NCQA 2011 PCMH recognition criteria to assess the line item costs to practices associated with activities to sustain PCMH services. The tool includes three worksheets: Costs, Personnel, and PCMH Functions. Staff used to support each NCQA Standard, Element, and Factor were identified, including the number of FTEs in various staff positions (e.g., nurse, clinical care manager) and hours worked per month to deliver PCMH services (cost worksheet). An hourly rate was calculated for every staff position (salary or hourly rate adjusted for the cost of benefits) and referenced to produce the line item cost attributed to each PCMH service.
2011 NCQA PCMH
Resources and Systems unique to mature PCMH 2011 Level III practices (i.e., not found in traditional, high performing, primary care practices) (Development and implementation NOT bolded.)
Example 6. Cost Capture Template
Principal Investigator: Arturo Vargas-Bustamante
Institution: University of California, Los Angeles
Contact Information: avb@ucla.edu
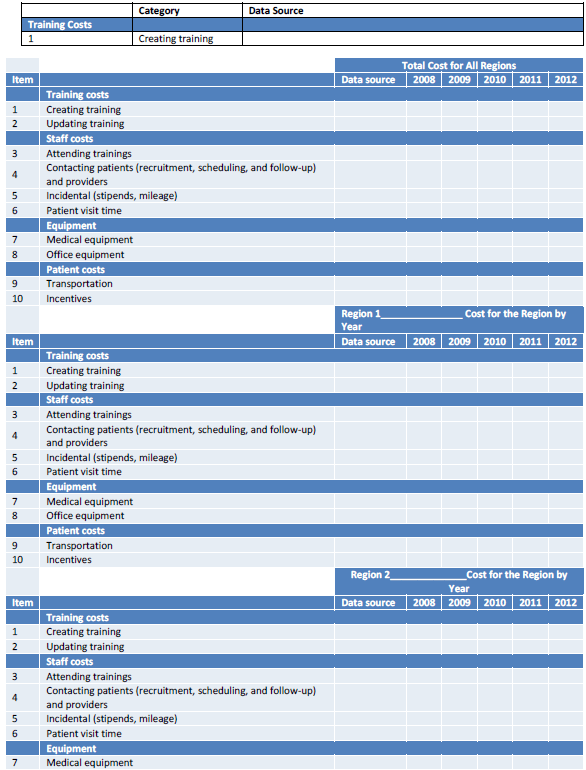
The screenshots below are of the structured cost tool developed by Vargas-Bustamante et al. This tool is a short, easy-to-understand cost capture template (CCT) that was completed by key program administrators to report on the costs of senior wellness care redesign. The CCT structure was based on the Prescription for Health (P4H) framework (developed in collaboration between the Robert Wood Johnson Foundation and AHRQ), which outlines various categories of startup and incremental expenses. To customize the CCT, appropriate job descriptions were added to the template based on labor resources used for the transformation. Screen shots of the original P4H tool have also been included in this Practice Guide.
Overview: The cost capture template is designed to collect costs for the Comprehensive Wellness Visit (CWV).
Regions: The upper section includes costs for all regions together. Below that, the regions are listed separately. While the regions are now broken into North and South; however, the former region names are used to indicate the historical regions.
- Region 1 is ______________________
- Region 2 presents ________________
- Region 3/4 are ___________________
Time periods: The template includes columns for each year from 2008–2012.
- Please include both startup and incremental costs. If the program was not implemented in a year, please indicate this in the comments. For example, if there were no costs in 2008 ($0 in 2009), startup costs in 2009 ($X in 2009), and early pilot testing in 2010 ($Y in 2010), please indicate each costs in the appropriate year with the comments indicating which costs are entered in each year.
- Please also indicate the number of clinics operating the program in each year (in the green section, to the right of the blue costs section). For example, there could be 0 clinics in 2008, 0 clinics in 2009, and X clinics in 2010.
I. Methods to calculate costs:
Since there may be multiple methods used to estimate the costs for each category, please provide:
- Comments or supporting documentation to facilitate review and support of the cost identified.
- A detailed description of the allocation method used to distribute total provider costs.
Overview: The cost capture template is designed to collect costs for the Senior Wellness Visit (SWV).
Regions: The upper section includes costs for all regions together. Below that, the regions are listed separately. While the regions are now broken into North and South; however, the former region names are used to indicate the historical regions.
- Region 1 is ______________________
- Region 2 presents ________________
- Region 3 / 4 are __________________
Time periods: The template includes columns for each year from 2008–2012.
- Please include both startup and incremental costs. If the program was not implemented in a year, please indicate this in the comments. For example, if there were no costs in 2008 ($0 in 2009), startup costs in 2009 ($X in 2009), and early pilot testing in 2010 ($Y in 2010), please indicate each costs in the appropriate year with the comments indicating which costs are entered in each year.
- Please also indicate the number of clinics operating the program in each year (in the green section, to the right of the blue costs section). For example, there could be 0 clinics in 2008, 0 clinics in 2009, and X clinics in 2010.
I. Methods to calculate costs:
Since there may be multiple methods used to estimate the costs for each category, please provide:
- Comments or supporting documentation to facilitate review and support of the cost identified.
- A detailed description of the allocation method used to distribute total provider costs.
Example 7. Prescription for Health (P4H) Toolkit: Templates for Collecting and Calculating Expenditure Data in Primary Care Interventions
Web Site: http://www.prescriptionforhealth.org/results/toolkit.html
Contact Person: Maribel Cifuentes
Institution: University of Colorado Health Sciences Center
Contact Information: Maribel.cifuentes@uchsc.edu
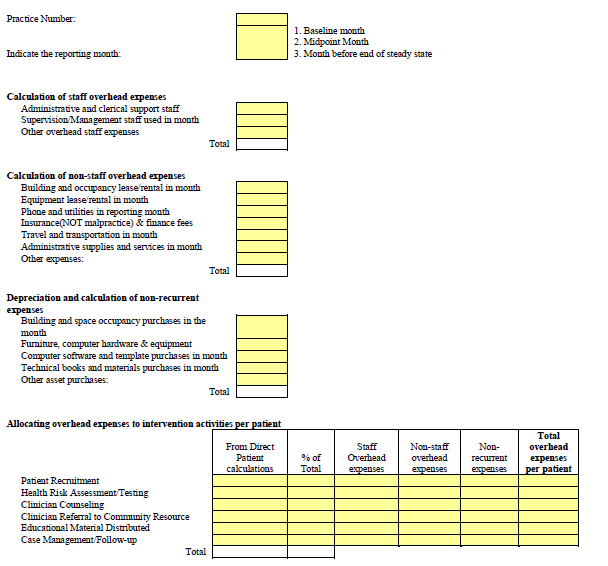
The screenshots below contain images taken from the original P4H templates for collecting and calculating expenditure data in primary care interventions, developed in collaboration between the Robert Wood Johnson Foundation and AHRQ. This set of standardized tools was created for the collection of expenditure data in primary care practices during three phases of a behavioral change intervention (baseline, steady state midpoint, and steady state endpoint). The user’s guide provides step-by-step instructions on the use of these tools. The tools were developed to arrive at credible estimates of startup and incremental expenses incurred by practices to implement their Prescription for Health interventions. The tools were not developed to be used as data collection/calculation instruments to undertake a full-fledged cost-benefit or cost-effectiveness study. The screenshots included in this Practice Guide are for the baseline intervention only; the steady state midpoint and steady state endpoint tools were similar.
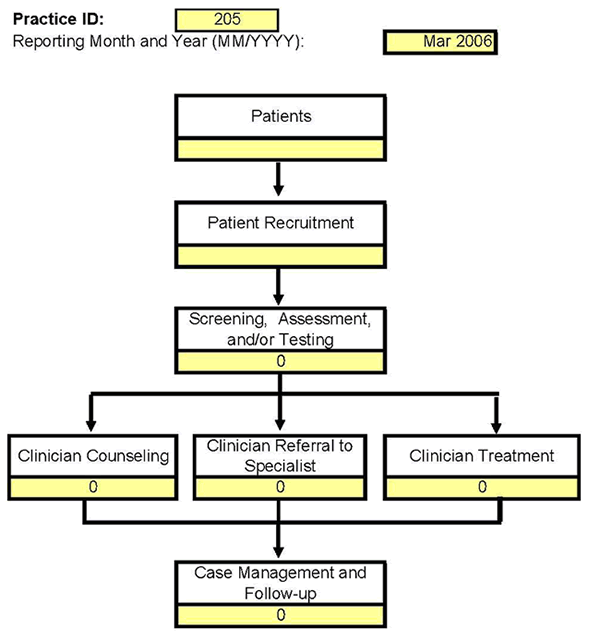
Collecting intervention expenses data
Figure 1 - Participant Flow Diagram
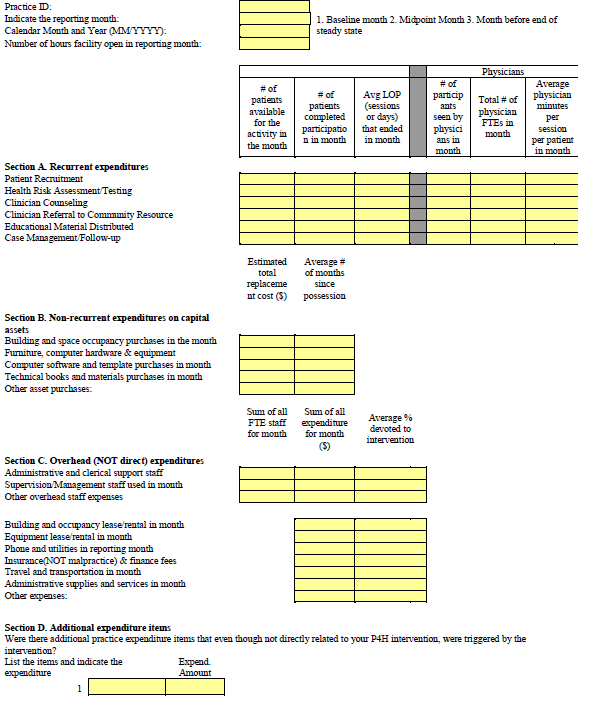
Collecting intervention expenses data
Table 3 - Basic Operating Expenditures
Calculating intervention expenses
Table for Calculating - Gross Direct Patient Expenses
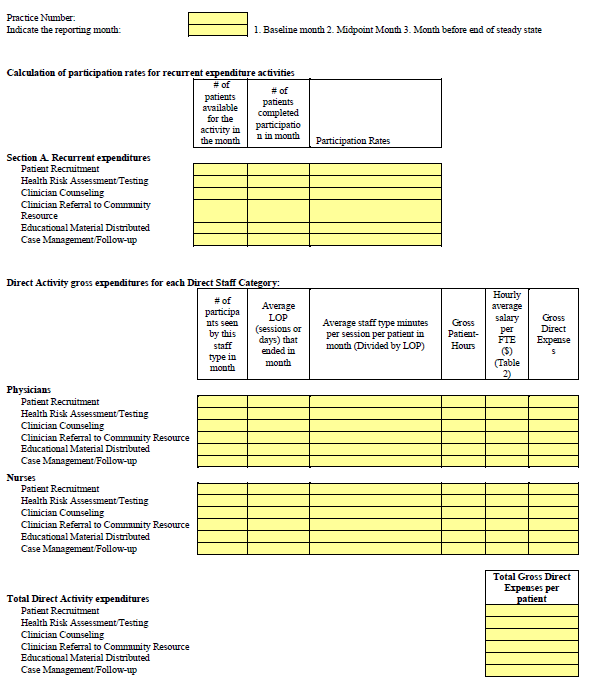
Calculating intervention expenses
Table for Calculating - Overhead Gross Expenses
