| This chapter addresses the importance of measurement in tracking and preventing hospital-associated venous thromboembolism and discusses key metrics and strategies for using them effectively. |
The Importance and Purpose of Measurement
A good system of measurement is crucial to achieving a goal of optimal venous thromboembolism (VTE) prevention. The previous chapter discussed how to plan for measurement; this chapter explains measurement more fully and how to use it to meet your goals.
The inability to secure a good system of metrics for VTE prevention is among the most common sources of improvement team failure. This inability may reflect lack of institutional support and prioritization, failure to create a protocol with measurable operational definitions, or failure to appreciate which particular metrics can drive improvement efforts and effect real change.
Measurement serves several purposes. It is required to assess baseline performance and understand the health care delivery process. Many measures also satisfy public reporting and the reporting requirements of regulatory bodies, many of which are increasingly tied to reimbursement.
Metrics are necessary to monitor progress and the impact of interventions. Good measurement also informs ongoing improvement efforts and illuminates pockets of strengths and weaknesses (opportunities for improvement) within the system, allowing for smarter deployment of precious time and resources and concurrent remediation of failures in the health care delivery process. In addition, local data can raise the health care team's awareness of the need for improvement and can engage members in improvement efforts. Ultimately, a meaningful measurement system drives improved care.
Categories of Measurement
Measures are commonly categorized as assessing structure, process, or outcomes, complemented by balancing measures that monitor for unintended negative consequences.
Structural measures assess the availability of organizational tools to support VTE prevention efforts. For example, does the institution have a VTE prevention policy in place? Are there standardized order sets incorporating clinical decision support that reinforce appropriate VTE prophylaxis? Is a measurement system in place?
Process measures examine the reliability of crucial steps in health care delivery. Examples in VTE prevention might include the percentage of patients who have a documented VTE risk assessment within 24 hours of admission, the percentage of patients with mechanical prophylaxis ordered that actually have compression devices properly in place, and order set utilization.
Good process measures are strongly linked to outcomes. The incidence of appropriate VTE prophylaxis has the potential to be just such a measure in populations with strong evidence of the efficacy of prophylaxis. Not only does it have the most causal relationship to the main clinical endpoint of hospital-associated VTE (HA-VTE), but it is also a sensitive indicator of how well the various care delivery steps come together. Defining "appropriate" implies that standardization and measurable operational definitions are in place, underscoring that the VTE protocol serves as the main ingredient not only for the improvement intervention but also for the measurement system that can track performance.
Outcome measures assess the impact of the effort on a clinical outcome. Specifically, in the context of this guide, an outcome measure is to safely reduce the incidence of HA-VTE and its associated morbidity, costs, emotional suffering, and mortality. This clinical endpoint is unsuitable as a lone metric for performance tracking, however, because the events are too infrequent, subclinical, or delayed in onset to provide timely and useful feedback to the team. Thus, it should be coupled with process and structural measures to accurately track performance.
Balancing measures monitor for potential unintended adverse consequences of interventions. This is a fourth category of measures that improvement teams may want to consider. For VTE prophylaxis, an important balancing measure would assess the incidence of bleeding complications attributable to anticoagulant prophylaxis.
Figure 6.1 illustrates care delivery at different stages and depicts an outcomes chain for HA-VTE. The outcome (whether a patient develops an HA-VTE) is linked to use of the order set, whether the patient was assessed and appropriately reassessed for VTE and bleeding risk throughout his or her stay, and whether ordered prophylaxis was reliably delivered. The most important summary process measure ascertains whether the patient is on appropriate VTE prophylaxis at different stages of hospitalization.
Figure 6.1: Outcomes Chain for HA-VTE
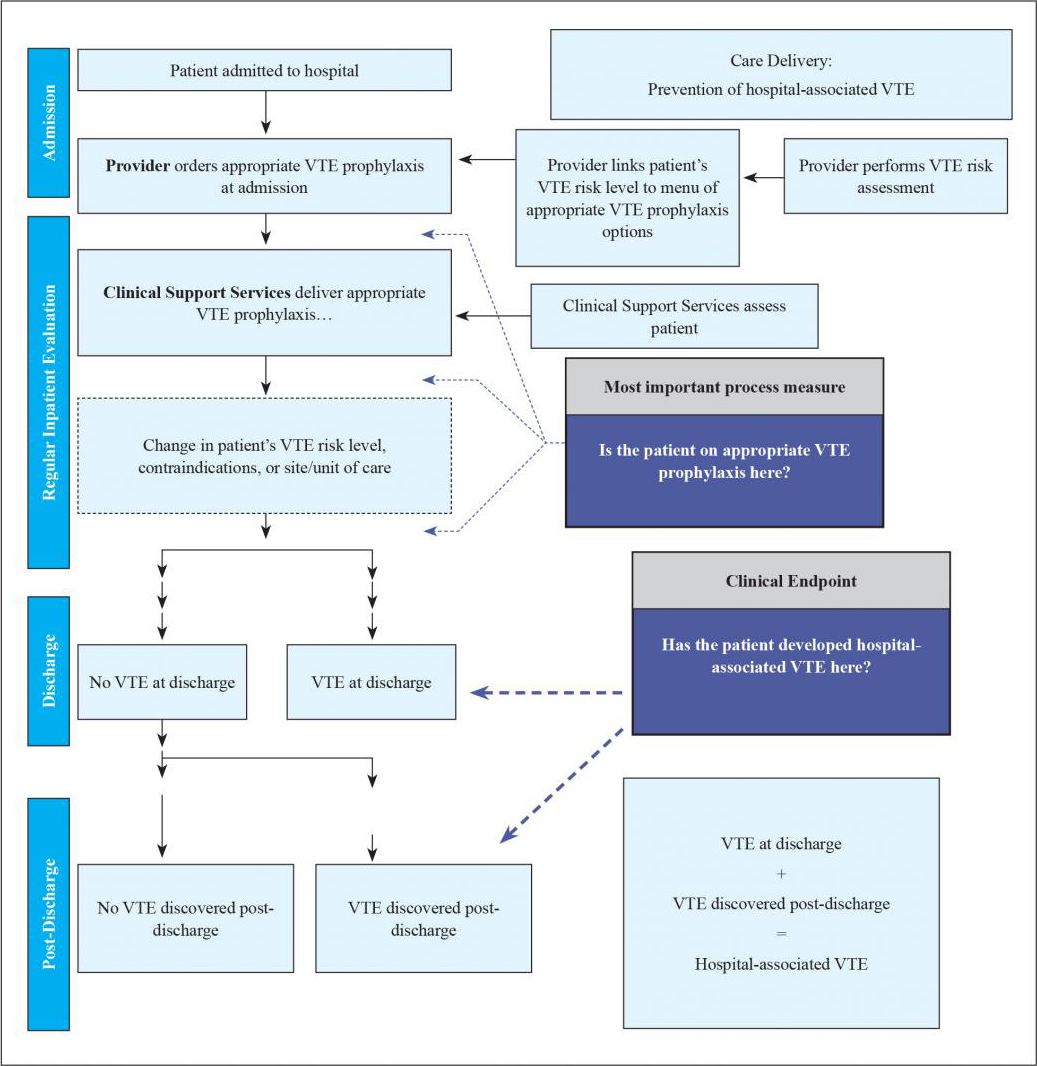
Whether or not a patient develops a preventable, hospital-associated deep vein thrombosis (DVT) or pulmonary embolism (PE) depends heavily on recent, appropriate VTE prophylaxis. While one key metric to track this is the process measure for the prevalence of "appropriate VTE prophylaxis," the more proximal steps in the care delivery pathway are where care redesign will likely occur (e.g., the VTE protocol). The other key metric to track is the incidence of hospital-associated DVT or PE. HA-VTE includes VTE events detected during the index admission as well as those found in patients who were discharged without a diagnosis of VTE but present with VTE at some time interval after discharge (this guide uses 30 days; some go out to 90 days).
Metric Selection
While an entire array of metrics may be useful, the two key metrics to focus on are the prevalence of appropriate VTE prophylaxis and the incidence of HA-VTE (with an important subset of potentially preventable HA-VTE). Publicly reported measures included in the National Hospital Inpatient Quality Measures for VTE prevention (Table 6.1) attempt to capture these two key metrics.
This section explains what the National Hospital Inpatient Quality Measures capture and how "appropriate prophylaxis" and HA-VTE rates can be measured more accurately and usefully in a project.
Table 6.1 depicts several National Hospital Inpatient Quality Measures for VTE. These VTE measures and others were developed as a set of aligned measures common to The Joint Commission and the Center for Medicare & Medicaid Services (CMS).1-3
Table 6.1: National Hospital Inpatient Quality Measures for VTE Prevention and Management
| Measure ID | Measure Abbreviated Name |
|---|---|
| VTE-1 | VTE Prophylaxis |
| VTE-2 | ICU VTE Prophylaxis |
| VTE-3 | VTE Patients with Anticoagulation Overlap Therapy |
| VTE-4 | VTE Patients Receiving UFH with dosages/platelet count monitoring by protocol or nomogram |
| VTE-5 | VTE Warfarin Therapy Discharge Instructions |
| VTE-6 | Hospital-Acquired Potentially-Preventable Venous Thromboembolism |
| STK-1 | VTE Prophylaxis (in Stroke) |
| SCIP-VTE-2 | Surgery Patients Who Received Appropriate VTE Prophylaxis Within 24 Hours After Surgery |
Many VTE measures are publicly reported and available on Hospital Compare. VTE-1, VTE-2, STK-1, and SCIP-VTE-2 pertain to the prevalence of appropriate VTE prophylaxis in different populations (see Key Metric 1, below), while VTE-6 focuses on tracking the incidence of potentially preventable HA-VTE. VTE-3, VTE-4, and VTE-5 are more relevant to the management of VTE.
Individual hospitals may already be collecting data on most if not all of these measures. In addition, the Health Information Technology for Economic and Clinical Health (HITECH) Act offers incentives for hospitals that meet specific meaningful use criteria for important health problems.4 Meaningful use criteria to promote VTE prevention are aligned with VTE-1 and VTE-2 measures.
Key Metric 1: Prevalence of Appropriate VTE Prophylaxis
Several measures focus on the proportion of eligible patients who receive prophylaxis. VTE-1 estimates the proportion of eligible patients who receive prophylaxis the day of or the day after hospital admission (or the day of or the day after surgery for surgeries that start the day of or the day after hospital admission) or have documentation of why no prophylaxis was given. Exclusion criteria are patients <18 years of age, a length of stay <2 days or >120 days, patients with comfort measures only, and patients enrolled in clinical trials. VTE-2 is similar, but focuses on patients admitted or transferred to the intensive care unit (ICU); STK-1 focuses on stroke patients.
There are several limitations to this approach to measuring prophylaxis. First, the use of any prophylaxis equates with appropriate prophylaxis in these measures. Therefore, hospitals can appear to have very high performance on these measures even if the majority of patients do not receive adequate prophylaxis. For example, a critically ill cancer surgery patient with a host of VTE risk factors and no bleeding risk would pass the standard of care if he had only anti-thromboembolism stockings—even when guidelines would call for pharmacologic or combination prophylaxis. In addition, hospitals with radically different prophylaxis patterns and different levels of adequate prophylaxis might look exactly the same under this measurement approach.
Second, these measures reflect prophylaxis provided only during narrow time periods: on admission to the hospital, on admission or transfer to the ICU, or perioperatively. The ability to adjust prophylaxis after these time intervals pass is not assessed. Ideally, measures will capture prophylaxis across the patient stay, not during narrow 24-hour time periods.
Third, this approach uses retrospective data collection, leaving no opportunity to address deficits in care proactively.
SCIP-VTE-2 addresses one of these deficits in that it lists acceptable VTE prophylaxis options for each surgery addressed by the measure.2 The choices are often (but not always) aligned with the ACCP guidelines (AT9), and improvement teams may want to review this measure for alignment with their VTE prevention protocol.
Strategies To Improve on the National Hospital Inpatient Quality Measures for VTE Prevention
The limitations of the National Hospital Inpatient Quality Measures should not lead institutions to abandon them. Instead, improvement teams can deploy a number of strategies to leverage the data collection already being done, ensure very high performance on the measures, and address all of their limitations—thereby sparking accelerated improvement. The following strategies have been successfully used in a wide variety of hospitals in large-scale national collaborative efforts.5,6 Improvement teams can review and prioritize which options are most feasible and impactful in their setting.
Change VTE-1, VTE-2, and STK-1 Into Measures of Appropriate Prophylaxis
Data collection for these measures captures the type of VTE prophylaxis, if any, that the patient is receiving. Adding just a few more items to the team's audit tool can allow facilities to track the percentage of eligible patients receiving appropriate prophylaxis per the protocol. This additional information can also help the team understand where the process is failing so they can make appropriate adjustments.
Questions that could be added include:
- Was the standardized VTE order set used on admission or transfer to the unit?
- What was the risk level or score documented by the physician?
- What is the risk level or score from the reviewer evaluation?
- Does the VTE prophylaxis the patient is receiving match the choices listed in the VTE protocol?
- If so, patient can be classified as having appropriate prophylaxis.
- If the risk level or score warrants anticoagulant prophylaxis but the patient is not on a protocol-accepted anticoagulant prophylactic agent:
- Does the patient have a documented contraindication or condition that justifies using alternatives to anticoagulant prophylaxis?
- If the risk level or score warrants mechanical prophylaxis but the patient is not on a protocol-accepted mechanical agent:
- Does the patient have a documented contraindication for mechanical prophylaxis?
- Final judgment: Is the current prophylaxis the patient is receiving appropriate, as defined by the VTE protocol?
- Yes.
- No, patient was under-prophylaxed, OR No, patient was over-prophylaxed.
Proactively Review Patients in the First 24 Hours
Proactively reviewing patients in the 24-hour window after admission or transfer can identify and address deficiencies in care very early in the hospitalization and improve performance on the National Hospital Inpatient Quality Measures for VTE. A review could quickly identify whether a patient is on an anticoagulant, mechanical prophylaxis, both, or neither. Many hospitals can pull those data elements into the report itself; others have a unit champion perform this review.
In its simplest version, the proactive review ends if either anticoagulant or mechanical prophylaxis is in place and the patient "passes"; those patients on no prophylaxis are reviewed more carefully to see if there is justification for the lack of prophylaxis (e.g., low risk, bleeding, mechanical prophylaxis contraindications). A more indepth review could also be performed for patients on mechanical prophylaxis alone to determine whether they meet the protocol definition of appropriate VTE prophylaxis. Scripted phone calls, pages, or notes can then be used, if appropriate, to contact the responsible prescribing provider to ask for clarification or a prophylaxis order.
Perform a VTE Prevention Audit
As noted earlier in this chapter, National Hospital Inpatient Quality Measures look at VTE prophylaxis at specific points in time during the patient's hospitalization. However, VTE risk and bleeding risk can change during the course of a hospitalization. Therefore, measuring the prevalence of appropriate VTE prophylaxis across the length of the hospital stay is important.
One method for assessing VTE and bleeding risks throughout the hospital stay entails assessing appropriate VTE prophylaxis on a representative sample of patients. Assessing the adequacy of prophylaxis on active inpatients (rather than recent discharges) offers several real-time advantages. It is faster and easier to do. In addition, providers can be alerted to prophylaxis oversights, which might create opportunities to improve care as well as to educate staff. Moreover, sampling active inpatients may allow insights into process barriers and valid reasons to amend the new processes to emerge more readily.
To track performance and advance Plan-Do-Study-Act (PDSA) cycles, the team will need just enough data to know whether changes are leading to improvement. A sampling strategy that uses 20 to 30 randomly selected patient charts per month can be statistically appropriate for most hospitals; it is also relatively quick and easy. To make the time commitment more manageable, charts can be audited each week with the results rolled up into monthly reports. A team member can be designated to collect, collate, plot, and manage the data.
Available data collection resources in any given hospital may dictate methods and definitions. Whatever method is chosen, consistency and usefulness are critical. It is often helpful to pilot the metric definitions and steps in data collection to identify and solve stumbling blocks. The team can also use PDSA cycles to perfect the performance tracking system. For example, to refine the VTE protocol and develop it as a valid audit tool, the team can use three independent reviewers to apply the protocol to audit 10 to 20 patients. (Appendix E contains case scenarios that can be useful to pilot protocols and measurement tools.) These principles apply to all the measurement strategies in this section, not just this strategy of auditing patients throughout their stay.
When you assess audit results, questions that should be answered include:
- Did the reviewers arrive at the same risk level?
- Did the reviewers agree on the absence or presence of contraindications to pharmacologic prophylaxis?
- Did the reviewers share the same conclusion about whether the patient was receiving adequate prophylaxis?
There are also questions that sequential pilots of the audit tool should help answer:
- How much time is acceptable in perioperative or trauma settings for a patient not to be on pharmacologic prophylaxis? What is the appropriate leeway time for these conditions?
- Which patients will be included in the sampling?
Depending on the scope of the initiative, it may make sense to exclude:
- Patients receiving obstetric care.
- Patients being seen on the psychiatric or behavioral health unit.
- Patients hospitalized less than 48 hours.
- Patients <18 years of age.
- Comfort care patients.
- Patients on therapeutic anticoagulation.
- Patients enrolled in clinical trials.
- Which data collection strategy is best for performance tracking?
Note that improvement teams often use a simple before-and-after approach to see the effects of an intervention. Unfortunately, that approach can be misleading to accurately assess prevalence of VTE prophylaxis, which can vary by as much as 35 percent day to day. Rather, multiple sampling events are recommended to ensure accurate conclusions. Results can be tracked and trended in run charts.
Sampling Techniques
There are three main sampling techniques that teams can use for a VTE prevention audit:
- Convenience sampling: Reviewers select patients because they are available on the ward (with no other particular selection process). Convenience samples categorized by ward or service are a common model.
- Random sampling: All patients in a representative population are subject to selection. As an example, a roster of all adult inpatients hospitalized for more than 48 hours could be assigned a random number (a number of free random number generators are available on the Internet). The data collector selects the first random patient generated for the audit. This has the advantage of giving an accurate picture of the demographics and VTE risk in the institution. The main disadvantage is the potential that some small but important patient group could be underrepresented.
- Stratified random sampling: Patients from several important patient groups are randomly sampled (e.g., medical versus surgical versus orthopedic, or critical care versus noncritical care). The advantage of this method is the ability to target patient groups at higher risk for VTE or with other criteria important to the VTE prevention effort.
The need for unambiguous operational definitions of ambulation and mobility, bleeding risk factors, and a host of other terms will become apparent during the piloting process.
Note: Before piloting and finalizing an audit tool, the team should pilot and finalize the VTE protocol, as feedback from the VTE protocol pilot may change the audit form.
Use Stoplight Audits To Identify and Mitigate Under-Prophylaxis
Another way to audit appropriate VTE prophylaxis and improve upon the National Inpatient Hospital Quality Measures is a measurement method called the red/yellow/green or stoplight method .5,6 The medication administration record or an automated report is generated identifying the VTE prophylaxis status of each patient on the ward as being "green" (receiving therapeutic or prophylactic anticoagulant), "yellow" (mechanical prophylaxis as a sole method of prophylaxis), or "red" (no prophylaxis ordered). This is essentially the same as the proactive review approach discussed earlier, except that this method is directed at all patients on a given unit rather than restricted to patients in the first 24 hours after hospitalization or transfer to the ICU. There are a number of variations, depending on local resources and the sophistication of the reporting tool.
Figure 6.2 depicts an automated report using the stoplight method. The report shows all active inpatients on a given unit. The service, VTE risk category chosen by the ordering provider, anticoagulant (if present), absence or presence of sequential compression devices (SCD), and several lab contraindications (low platelet count, low hemoglobin, or elevated INR) are all captured and available to the reviewer. Color coding is added to enhance ease of use. Green represents the presence of an anticoagulant, yellow represents SCDs, and red represents patients with no VTE prophylaxis. The orange color represents patients with a lab contraindication within the last 2 days who are on mechanical prophylaxis only.
Figure 6.2: Automated Version of a Stoplight Report
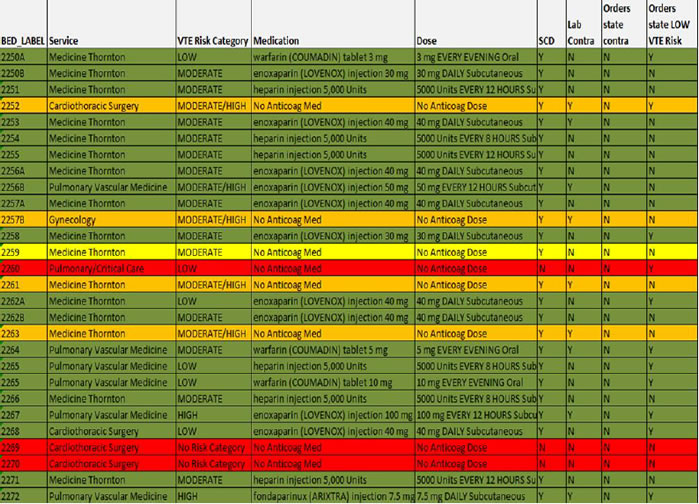
Patient identifiers have been removed.
This kind of reporting has many strengths. The automation allows monitoring of virtually every inpatient on a daily basis as opposed to focusing only on the first hospital day or on a relatively small subset of patients captured by sampling techniques. Attention can quickly be focused on those who are at highest risk of under-prophylaxis—namely those in the red and the yellow. This method of audit or measurement can spur concurrent intervention (aka measure-vention), which will be discussed in more detail in the next chapter. This technique can very rapidly improve VTE prophylaxis rates.5,6
More detailed reviews can be performed on samples of patients to make sure that the prophylaxis being delivered is consistent with the institutional VTE prevention protocol. Patterns of prophylaxis by service and unit will very quickly become apparent, focusing the attention of the improvement team on underperforming units. Patients without a captured VTE risk level from the protocol (in the example, two cardiothoracic surgery patients coded red) identifies providers and services that somehow evaded the VTE prevention order set. Finally, measures around the pattern of prophylaxis can provide a constant frame of reference, even if the protocol and the definition of "appropriate" prophylaxis evolves.
Use Audits To Target Over-Prophylaxis
As previously stated, the risk of HA-VTE can change throughout a patient's hospitalization. Thus, a few point-in-time assessments have the potential to lead to under-prophylaxis as well as over-prophylaxis. To address the latter, a similar stoplight (red/yellow/green) method can be used. Sampling some patients in the "green" category of the example stoplight report and determining whether they meet criteria for low risk can be done fairly efficiently.
Adding a data field to a report to capture whether the patient is ambulating can efficiently identify ambulatory patients on anticoagulation. For example, the Braden decubitus risk scale captures the degree of ambulation on a 4-point scale:
- Bedfast—Confined to bed.
- Chairfast—Ability to walk is severely limited or nonexistent. Cannot bear own weight and/or must be assisted into a chair or wheelchair.
- Walks occasionally—Walks occasionally during the day, but only for very short distances, with or without assistance. Spends the majority of each shift in bed or in a chair.
- Walks frequently—Walks outside of the room at least twice a day and inside the room at least once every 2 hours during waking hours.
This scale can also be used to identify patients who are walking frequently and on prophylaxis and targeted for further review, with the goal of removing prophylaxis from low-risk patients. The score need merely be added as a distinct data field (rather than as free text) to allow it to be incorporated into an automated report.
Key Metric 2: Incidence of Hospital-Associated VTE
The goal of the improvement team is to reduce the overall incidence of HA-VTE. Completely eliminating HA-VTE is unrealistic, as clinical trials typically achieve a 30 to 65 percent reduction in events with the best possible prophylaxis available—and many patients have contraindications for prophylactic agents.7 Tracking potentially preventable HA-VTE is an attractive corollary measure, as these are the events most amenable to remediation. The VTE-6 measure is one method to track HA-VTE; however, like the other National Hospital Inpatient Quality Measures for VTE, this measure has some serious limitations.
The VTE-6 measure is restricted to patients with non-principal diagnosis of VTE not present on admission. Since October 2007, medical centers designate diagnoses as:
- Y = Yes (present at the time of inpatient admission, or POA).
- W = Provider is unable to clinically determine if condition was present on admission.
- N = No (not present at the time of inpatient admission, or NPOA).
- U = Unknown (documentation is insufficient to determine if condition was present on admission).
One major limitation of the measure is that only VTE events with a POA indicator of N or U are included in the measure. This results in an underestimation of VTE associated with hospitalization (and potentially preventable HA-VTE) as it fails to recognize that VTE associated with hospitalization may not present until after the index hospitalization.
Capturing patients who are readmitted with newly diagnosed VTE is very important, as a very large proportion of VTE can present in the 30 days after hospital discharge. This is especially true for medical inpatients, and readmitted VTE patients may outnumber not-present-on-admission patients.
A second major limitation of this measure is the definition of "potentially preventable." Any prophylaxis provided before the VTE diagnostic order date leads to the conclusion that the VTE was not preventable. For example, a VTE event that is discovered on the tenth day of hospitalization would be deemed not preventable if the patient had received mechanical prophylaxis on the ninth hospital day but inadequate or no prophylaxis throughout the remainder of his or her stay.
AHRQ's Quality Indicators include a Patient Safety Indicator (AHRQ PSI #12) that does not use the POA indicator and is focused only on patients with surgical diagnoses or operating room procedure codes.8 Using this indicator, some patients who are readmitted with VTE may be captured, but only if VTE is not the primary reason for admission.
|
Compensate for the Limitations in Using Administrative Data Improvement teams need to understand the important limitations of ICD-9 coding and administrative data in tracking outcomes. First, not all patients will be readmitted to the same hospital; others who are diagnosed with a VTE event may remain in the skilled nursing or rehabilitation facility that accepted the patient after hospitalization. In addition, not everyone with HA-VTE will be readmitted; newer oral anticoagulants and low-molecular-weight heparin can be used to treat some patients with VTE without hospitalization. The predictive value of the present on admission designation is only 71 percent and 81 percent in studies of surgical and medical inpatients, respectively, with higher performance in those with total knee arthroplasty.9-12 Both underestimates and overestimates of HA-VTE rates can occur. Second, although major guidelines13,14 recommend against routine screening for asymptomatic VTE in the hospital, the practice remains common for high-risk populations (e.g., trauma or cancer patients) in many hospitals. Hospitals performing more routine screening will therefore appear to have higher rates of symptomatic VTE than those that do not perform this screening. Even in centers that do not practice routine screening for asymptomatic patients, medical centers with ongoing improvement and educational efforts may have a lower threshold for ordering tests. This surveillance bias can make it especially hard to compare performance across different medical centers and to identify top performers.15-18 In fact, a recent study found that hospitals with higher quality scores for VTE often had worse risk-adjusted VTE rates, most likely due to surveillance bias.15 Increasingly sensitive CT scans and variability in diagnosing small, subsegmental PE also pose challenges to tracking VTE over time and to comparing performance across different institutions. Finally, the improvement team should revisit the accuracy of administrative coding for HA-VTE and attempt to reduce any inappropriate routine screening for deep vein thrombosis. Screening practices and coding accuracy can vary widely from hospital to hospital, and this may represent a valid opportunity to reduce the reported number of hospital-associated cases of VTE. |
Strategies To Improve on the National Hospital Inpatient Quality Measures for VTE Prevention
Several strategies are available to improve on the VTE-6 metric (and AHRQ PSI #12) and to track potentially preventable and nonpreventable HA-VTE.
Capture Patients Readmitted With Diagnostic Codes for VTE
One strategy to better track the incidence of HA-VTE is to set up a data query to capture both patients who develop VTE during an admission and patients who are readmitted within 30 days with a newly diagnosed VTE. Another data point to consider tracking and reporting is the incidence of upper extremity DVT. This is an important but distinct diagnosis with different implications for prevention.
Use Chart Review To Capture Potentially Preventable Versus Nonpreventable HA-VTE
HA-VTE should be considered potentially preventable if there was a significant lapse in protocol-directed VTE prophylaxis (i.e., rather than the VTE-6 standard of a complete lack of any prophylaxis) prior to VTE diagnosis at any time prior to the diagnostic test for VTE. Diagnostic coding is not perfectly accurate, and chart review allows validation of whether the patient experienced an HA-VTE.
Chart review also allows the team to prioritize its educational efforts and understand where the process is most prone to failure. In addition, chart review can raise awareness of HA-VTE, and potentially preventable HA-VTE can be referred for peer review where the powerful human stories revealed by chart review can garner support for the VTE prevention program.
Track the Incidence of HA-VTE and Concurrent Case Review
The methods reviewed above rely on identification of VTE diagnostic codes. A better method, if feasible, is to identify and review all VTE cases as they are diagnosed by CT angiograms of the chest, Doppler-ultrasound tests of the extremities, ventilation perfusion scans, venograms, and autopsy findings.
One center, for example, designed a query in the digital radiology information system that could efficiently pull up a roster of all VTE diagnostic studies performed in the previous 1 to 3 days.19 A nurse data reviewer screened the studies for a new VTE diagnosis, then determined through further chart review if the VTE was hospital associated or community acquired. If an HA-VTE was diagnosed, further review using a case review form determined whether the HA-VTE was potentially preventable. This strategy allows a more efficient, less labor-intensive, and more complete case review, often completed while the patient is still in the hospital.
Track Bleeding Episodes Associated With Anticoagulant Prophylaxis
Concern about bleeding complications limits how aggressively anticoagulant prophylaxis can be used. Bleeding complications, however, are notoriously difficult to track accurately, and determining the incremental rate of bleeding induced by anticoagulant prophylaxis can be even more difficult. Patients followed longitudinally over time, such as patients in registries and the American College of Surgeons National Surgical Quality Improvement Program (ACS NSQIP®), may provide the most robust opportunity to track risk complications. Unfortunately, high-quality registries, if available in a hospital at all, typically cover a minority of patients.
Voluntarily reported cases can provide useful insights, but many cases are not detected in this manner as the approach lacks sensitivity. Electronic monitoring for patients requiring transfusion or having significant drops in hemoglobin while on anticoagulation can spur chart review to determine if an adverse drug event occurred, to assess the level of harm, and to examine the case for error.20
An approach popularized by the Institute for Healthcare Improvement does not require advanced clinical decision support. A small sample of charts is reviewed for a list of "triggers" for further review.21 Triggers potentially related to anticoagulant adverse drug events (ADEs), such as an elevated INR, elevated PTT, use of anticoagulant reversal agents, change in level of care, or blood transfusions, lead to further analysis to determine if an ADE occurred. Each method has strengths and limitations, and it appears that using a combination of them is likely most sensitive. Of course, some of these methods are directed at capturing ADEs from therapeutic, rather than prophylactic, doses of anticoagulant, so refinement of reporting is needed to capture these nuances.
Using Charts for Data Reporting
Run charts are easy to make and tend to be a useful way to graph the improvement data needed to follow performance over time. Compared with tables of data, run charts offer a quicker picture of how an intervention is working relative to the baseline. The table and run chart in Figure 6.3 represent data from the University of California, San Diego. As is visible, the run chart makes it easy to appreciate dramatic trends in performance over time.
Figure 6.3: Comparison of Tabular Data and Run Chart on Appropriate Prophylaxis (from UC San Diego Medical Center)
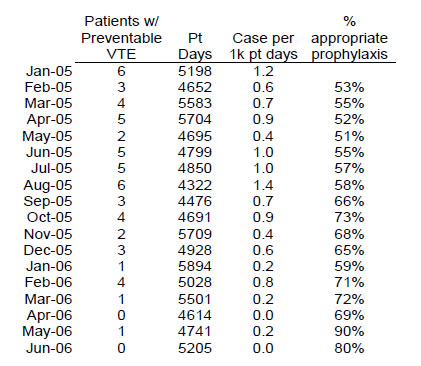
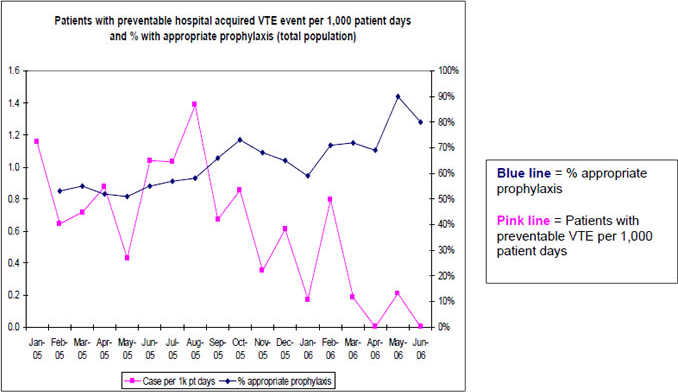
Note that the run charts are more intuitive to use and often have more weight than the tabular presentation of data.
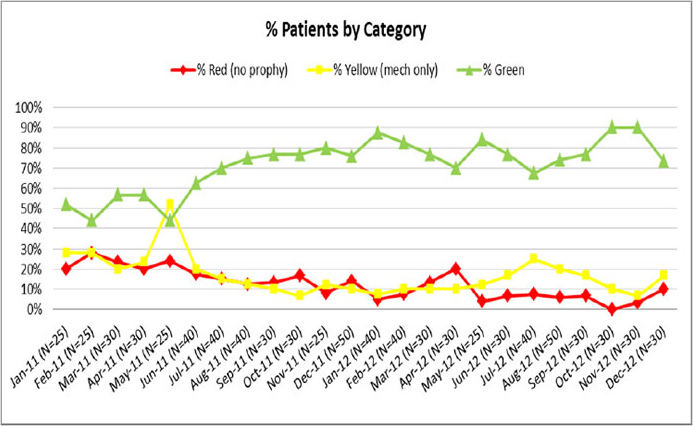
Run charts can be annotated along the x axis where new interventions or events occur. This addition can make it easier to see the effects of different stages of an intervention or to subtract the effects of known local trends. Ubiquitous software (Excel® or any of several free online run chart applications) can be used to create run charts without statistical expertise. For quality improvement projects, monthly plots are usually adequate; when testing incremental layered interventions and ongoing longitudinal monitoring, however, weekly plots will let the team see the results faster.
Figure 6.4 depicts a run chart of prophylaxis patterns.
Figure 6.4: Run Chart of Prophylaxis Patterns
Generated from audit tool in Appendix C3.
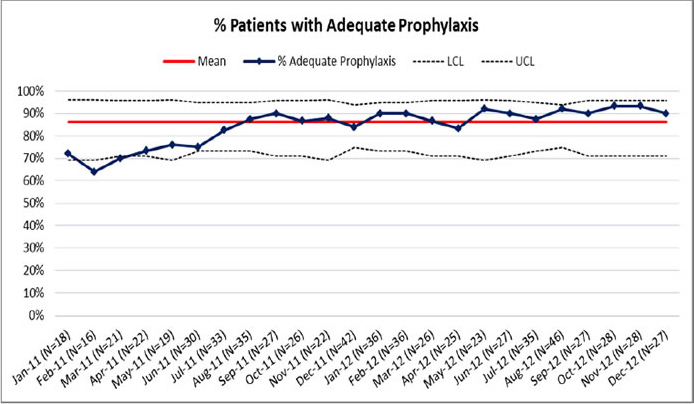
Statistical process charts (SPCs) are a special kind of run chart that are useful in gauging whether fluctuations in run charts are due to noise in the data (and variation within an unchanged system) or to real change (indicating that the underlying process has changed). Different types of SPC charts are required for different types of data.
Figure 6.5 depicts an SPC chart of trends in the percentage of patients receiving adequate prophylaxis.
Figure 6.5: SPC Chart of the Percentage of Patients With Adequate Prophylaxis
Generated from audit tool in Appendix C3.
Summary of the Approach to Measurement
Improvement teams need a meaningful measurement system to support improvement. The two key metrics of measurement include the prevalence of appropriate prophylaxis and the incidence of HA-VTE and potentially preventable HA-VTE. While publicly reported measures for these metrics exist, they have some shortcomings, and improvement teams will want to consider how to add more granularity to capture more meaningful data. Measurement of important metrics can often be made easier if documentation and order sets are designed proactively to capture them, rather than treating measurement as an afterthought.


