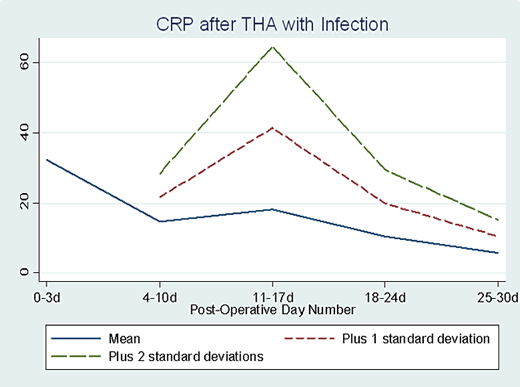
CRP = C-reactive protein; SSI = surgical site infection; THA = total hip arthroplasty.
Text Description
This exhibit graphs the blood levels of C-reactive protein [CRP] (vertical axis = y-axis) versus days after surgery (horizontal axis = x-axis) for patients who develop a surgical site infection following total hip replacement. The graph plots the mean level of this protein for 5 time periods after surgery (0 to 3 days, 4 to 10 days, 11 to 17 days, 18 to 24 days, and 25 to 30 days), as well as plotting blood CRP levels that are 1 and 2 standard deviations above the mean for each time period. The mean value of CRP decreases during the first 10 days after surgery, but increases slightly during days 11 to 17. The plot for patients with CRP levels 1 standard deviation above the mean shows a doubling of levels between days 4-10 and days 11-17 after surgery, before decreasing markedly for the rest of the 30-day period. The plot for patients with CRP levels 2 standard deviations above the mean peak at 3 times the mean at days 11-17, before decreasing markedly for the rest of the 30-day period.


