- People under age 65 whose family’s health insurance premiums and out-of-pocket medical expenses were more than 10% of total family income.
- People without a usual source of care who indicate a financial or insurance reason for not having a source of care.
- People under age 65 who were in families having problems paying medical bills in the past year.
High health care costs can prevent some patients from receiving the care that they need.
People Whose Family’s Health Insurance Premiums and Medical Expenses Were More Than 10% of Family Income
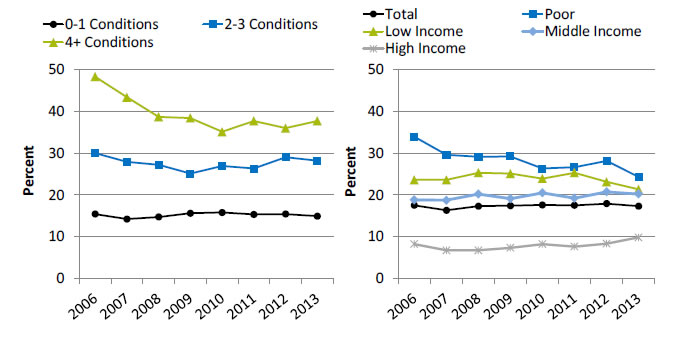
People under age 65 whose family's health insurance premiums and out-of-pocket medical expenses were more than 10% of total family income, by chronic conditions (18-64) and family income, 2006-2013

Left Chart:
| No. of Conditions | 2006 | 2007 | 2008 | 2009 | 2010 | 2011 | 2012 | 2013 |
|---|---|---|---|---|---|---|---|---|
| 0-1 Conditions | 15.4 | 14.2 | 14.7 | 15.6 | 15.8 | 15.3 | 15.4 | 14.9 |
| 2-3 Conditions | 30.0 | 27.9 | 27.2 | 25.1 | 26.9 | 26.3 | 29.0 | 28.2 |
| 4+ Conditions | 48.3 | 43.4 | 38.7 | 38.4 | 35.1 | 37.7 | 36.0 | 37.7 |
Right Chart:
| Income | 2006 | 2007 | 2008 | 2009 | 2010 | 2011 | 2012 | 2013 |
|---|---|---|---|---|---|---|---|---|
| Total | 17.5 | 16.3 | 17.3 | 17.4 | 17.6 | 17.5 | 17.9 | 17.3 |
| High Income | 8.2 | 6.7 | 6.7 | 7.3 | 8.2 | 7.6 | 8.3 | 9.8 |
| Middle Income | 18.8 | 18.7 | 20.2 | 19.1 | 20.5 | 19.2 | 20.7 | 20.2 |
| Low Income | 23.6 | 23.6 | 25.3 | 25.1 | 23.9 | 25.3 | 23.1 | 21.3 |
| Poor | 33.9 | 29.6 | 29.1 | 29.2 | 26.3 | 26.6 | 28.1 | 24.3 |
Source: Agency for Healthcare Research and Quality, Medical Expenditure Panel Survey, 2006-2013.
Denominator: Civilian noninstitutionalized population under age 65.
Note: For this measure, lower rates are better. Total financial burden includes premiums and out-of-pocket costs for health care services.
- Importance: Health care expenses that exceed 10% of family income are a marker of financial burden for families.
- Overall Percentage: In 2013, 17.3% of people under age 65 had health insurance premium and out-of-pocket medical expenses that were more than 10% of total family income.
- Trends:
- From 2006 to 2013, there were no statistically significant changes in the overall percentage.
- Among people with 4 or more chronic conditions and poor people, the percentage decreased.
- Among high-income and middle-income people, the percentage increased.
- Groups With Disparities:
- In all years, the percentage of adults under age 65 whose family’s health insurance premium and out-of-pocket medical expenses were more than 10% of total family income was higher among those with 2-3 and 4+ chronic conditions compared with those with 0-1 chronic conditions. The gap between people with 4+ chronic conditions and 0-1 conditions narrowed over time.
- In all years, the percentage was about 3 times as high for poor individuals and low-income individuals and more than twice as high for middle-income individuals compared with high-income individuals. The gaps between poor and high-income people and between low-income and high-income people were narrowing over time.
People Without a Usual Source of Care for Financial or Insurance Reasons
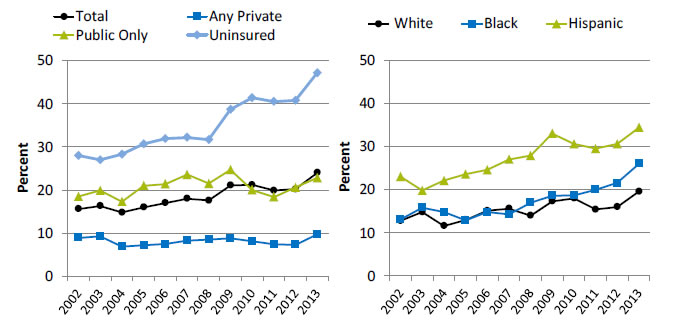
People without a usual source of care who indicate a financial or insurance reason for not having a source of care, by insurance (under age 65) and race/ethnicity, 2002-2013

Left Chart:
| Insurance Status | 2002 | 2003 | 2004 | 2005 | 2006 | 2007 | 2008 | 2009 | 2010 | 2011 | 2012 | 2013 |
|---|---|---|---|---|---|---|---|---|---|---|---|---|
| Total | 15.6 | 16.3 | 14.8 | 16.0 | 17.0 | 18.0 | 17.6 | 21.1 | 21.2 | 19.9 | 20.2 | 24.0 |
| Uninsured | 28.0 | 27.0 | 28.3 | 30.7 | 31.9 | 32.2 | 31.7 | 38.7 | 41.4 | 40.5 | 40.8 | 47.2 |
| Public Only | 18.5 | 19.9 | 17.3 | 21.0 | 21.4 | 23.6 | 21.5 | 24.7 | 20.0 | 18.4 | 20.6 | 22.8 |
| Any Private | 8.9 | 9.3 | 6.9 | 7.2 | 7.5 | 8.3 | 8.5 | 8.8 | 8.1 | 7.4 | 7.3 | 9.7 |
Right Chart:
| Race/Ethnicity | 2002 | 2003 | 2004 | 2005 | 2006 | 2007 | 2008 | 2009 | 2010 | 2011 | 2012 | 2013 |
|---|---|---|---|---|---|---|---|---|---|---|---|---|
| White | 12.8 | 14.8 | 11.6 | 13.0 | 15.1 | 15.6 | 14.0 | 17.3 | 18.0 | 15.4 | 16.0 | 19.6 |
| Black | 13.1 | 15.8 | 14.8 | 12.9 | 14.8 | 14.3 | 17.0 | 18.6 | 18.7 | 20.0 | 21.6 | 26.0 |
| Hispanic | 23.0 | 19.8 | 22.1 | 23.6 | 24.6 | 27.0 | 27.9 | 33.0 | 30.6 | 29.5 | 30.6 | 34.4 |
Source: Agency for Healthcare Research and Quality, Medical Expenditure Panel Survey, 2002-2013.
Denominator: Civilian noninstitutionalized population without a usual source of care.
Note: For this measure, lower rates are better. White and Black are non-Hispanic. Hispanic includes all races.
- Importance: High-quality health care is facilitated by having a regular provider, but some Americans may not be able to afford one.
- Overall Percentage: In 2013, 24.0% of people without a usual source of care indicated a financial or insurance reason for not having a source of care.
- Trends:
- The overall percentage worsened from 2002 to 2013.
- The percentage worsened among uninsured people and among Whites, Blacks, and Hispanics.
- Groups With Disparities:
- In all years, the percentage of people without a usual source of care who indicated a financial or insurance reason for not having a source of care was higher:
- Among uninsured people and people with public insurance compared with people with any private insurance. The gap between uninsured people and people with any private insurance was growing larger over time.
- Among Hispanics compared with Whites.
- From 2011 to 2013, the percentage of people without a usual source of care who indicated a financial or insurance reason for not having a source of care was higher among Blacks compared with Whites. This represents a new disparity that is growing larger over time.
- In all years, the percentage of people without a usual source of care who indicated a financial or insurance reason for not having a source of care was higher:
People With Problems Paying Medical Bills
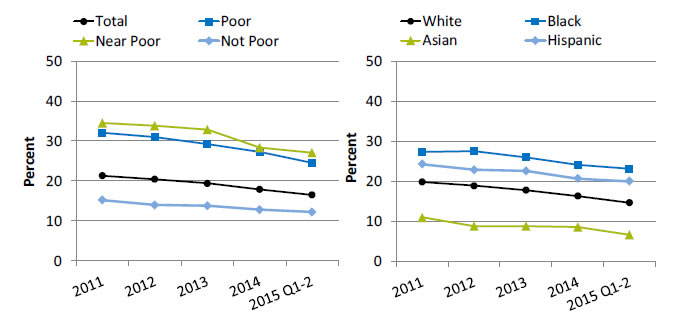
People under age 65 who were in families having problems paying medical bills in the past year, by poverty status and race/ethnicity, 2011-2015 Q2

Left Chart:
| Poverty Status | 2011 | 2012 | 2013 | 2014 | 2015 Q1-2 |
|---|---|---|---|---|---|
| Total | 21.3 | 20.4 | 19.4 | 17.9 | 16.5 |
| Poor | 32.1 | 31 | 29.3 | 27.3 | 24.5 |
| Near Poor | 34.6 | 33.9 | 32.9 | 28.4 | 27.1 |
| Not Poor | 15.2 | 14 | 13.8 | 12.8 | 12.2 |
Right Chart:
| Race/Ethnicity | 2011 | 2012 | 2013 | 2014 | 2015 Q1-2 |
|---|---|---|---|---|---|
| White | 19.8 | 18.9 | 17.8 | 16.3 | 14.7 |
| Black | 27.3 | 27.5 | 26 | 24.1 | 23.1 |
| Asian | 11 | 8.8 | 8.8 | 8.6 | 6.7 |
| Hispanic | 24.3 | 22.9 | 22.6 | 20.7 | 20 |
Key: Q = quarter.
Source: Cohen RA, Schiller JS. Problems paying medical bills among persons under age 65: early release of estimates from the National Health Interview Survey, 2011-June 2015. Hyattsville, MD: National Center for Health Statistics; 2015. http://www.cdc.gov/nchs/nhis/releases.htm.
Note: For this measure, lower rates are better.
- Trends: From 2011 to the first half of 2015, the percentage of people under age 65 in families having problems paying medical bills decreased overall and for all poverty status and racial/ethnic groups.
- Groups With Disparities:
- In all years, people in poor and near-poor families were more likely to have problems paying medical bills than people in families that were not poor. The gaps between people in poor and not poor families and between near-poor and not poor families have narrowed over time.
- In all years, compared with Whites, Blacks and Hispanics were more likely to have problems paying medical bills while Asians were less likely to have problems. None of these gaps were changing over time.


