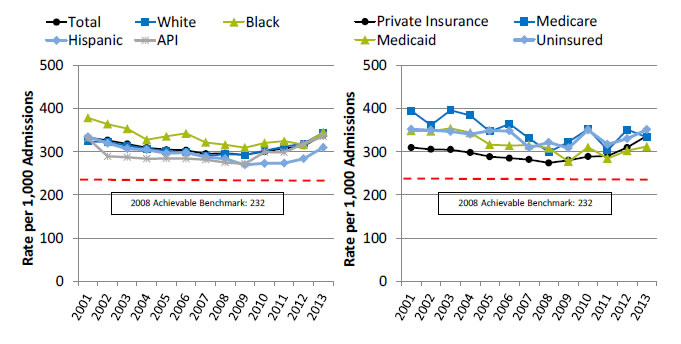
- Ruptured appendix per 1,000 adult admissions with appendicitis.
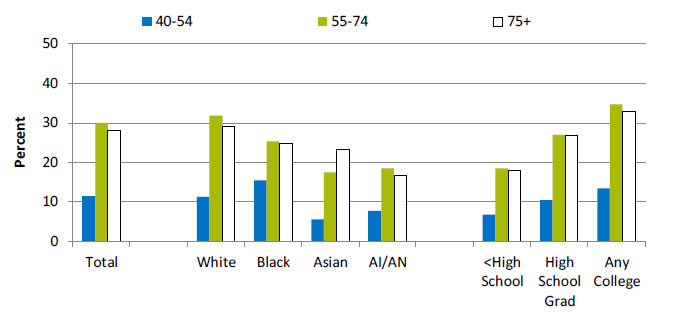
- Men age 40+ who had a screening prostate-specific antigen test in the past year.
Inefficient care includes delayed care that is more costly and care with risks that exceed benefits. This inefficiency can raise health care costs and make it harder for people to afford care.
Admissions for Perforated Appendix
Admissions for perforated appendix per 1,000 adult admissions with appendicitis age 18 and over, United States, by race/ethnicity and insurance, 2001-2013

Left Chart:
| Year | Total | White | Black | Hispanic | API |
|---|---|---|---|---|---|
| 2001 | 332.7 | 323.8 | 378.5 | 334.7 | 331.1 |
| 2002 | 326.7 | 322.4 | 364.1 | 319.7 | 289.3 |
| 2003 | 318.1 | 314.0 | 353.4 | 306.9 | 287.2 |
| 2004 | 309.5 | 306.8 | 327.8 | 304.5 | 284.0 |
| 2005 | 304.8 | 301.3 | 335.5 | 296.7 | 284.3 |
| 2006 | 303.6 | 298.1 | 342.7 | 298.0 | 284.2 |
| 2007 | 295.2 | 289.8 | 321.7 | 287.9 | 281.4 |
| 2008 | 296.7 | 294.4 | 316.1 | 283.8 | 275.1 |
| 2009 | 292.4 | 292.8 | 309.6 | 269.4 | 271.9 |
| 2010 | 300.8 | 302.6 | 320.4 | 273.2 | 299.3 |
| 2011 | 307.4 | 311.4 | 324.9 | 273.4 | 298.7 |
| 2012 | 313.6 | 319.1 | 316.1 | 283.9 | 317.6 |
| 2013 | 338.4 | 344.4 | 345.3 | 310.0 | 335.8 |
Right Chart:
| Insurance Status | 2001 | 2002 | 2003 | 2004 | 2005 | 2006 | 2007 | 2008 | 2009 | 2010 | 2011 | 2012 | 2013 |
|---|---|---|---|---|---|---|---|---|---|---|---|---|---|
| Private Insurance | 309.7 | 305.6 | 305.0 | 298.0 | 288.8 | 285.0 | 281.9 | 274.3 | 280.3 | 288.8 | 290.5 | 309.9 | 336.7 |
| Medicare | 394.2 | 361.7 | 395.9 | 384.3 | 347.0 | 364.5 | 331.0 | 299.3 | 322.8 | 352.3 | 303.8 | 351.4 | 333.4 |
| Medicaid | 348.7 | 347.8 | 354.2 | 344.2 | 316.5 | 314.6 | 314.9 | 308.9 | 277.4 | 310.6 | 284.7 | 302.5 | 312.1 |
| Uninsured | 352.0 | 349.9 | 346.8 | 340.9 | 349.0 | 348.4 | 309.7 | 321.6 | 308.5 | 350.5 | 317.1 | 330.4 | 351.5 |
2008 Achievable Benchmark: 232.
Source: Agency for Healthcare Research and Quality, Healthcare Cost and Utilization Project, State Inpatient Databases, disparities analysis file and Nationwide Inpatient Sample, 2001-2013.
Denominator: Adults age 18 and over.
Note: For this measure, lower rates are better. Annual rates are adjusted for age and gender.
- Importance: Timely assessment of abdominal pain and diagnosis of appendicitis reduces rates of perforated appendix.
- Overall Rate: In 2013, there were 338 perforated appendixes for every 1,000 adult admissions with appendicitis.
- Trends:
- From 2001 to 2013, there were no statistically significant changes in the overall rate.
- The rate improved among Blacks and Hispanics and among people with Medicare and Medicaid.
- Groups With Disparities:
- Until 2007, Blacks tended to have higher rates than Whites, and people with Medicare, Medicaid, or no insurance tended to have higher rates than people with private insurance.
- Since 2007, only the gap between uninsured and privately insured people has persisted.
- The disparities between Blacks and Whites and between people with Medicaid and those with private insurance were eliminated.
- Achievable Benchmark:
- In 2008, the top 4 State achievable benchmark for perforated appendix per 1,000 admissions with appendicitis was 232. The States that contributed to the achievable benchmark were Connecticut, Hawaii, Massachusetts, and New Jersey.
- No group had reached the benchmark by 2013.
Men Who Had a Screening Prostate-Specific Antigen Test
Men age 40+ who had a screening prostate-specific antigen test in the past year as part of routine exam, by age, race, and education, 2014

| Race / Education | 40-54 | 55-74 | 75+ |
|---|---|---|---|
| Total | 11.4 | 30.0 | 28.0 |
| White | 11.3 | 31.8 | 29.0 |
| Black | 15.5 | 25.4 | 24.7 |
| Asian | 5.5 | 17.4 | 23.3 |
| AI/AN | 7.6 | 18.4 | 16.7 |
| <High School | 6.7 | 18.5 | 18.0 |
| High School Grad | 10.4 | 27.0 | 26.7 |
| Any College | 13.4 | 34.7 | 32.8 |
Key: AI/AN = American Indian or Alaska Native.
Source: Centers for Disease Control and Prevention, Behavioral Risk Factor Surveillance Survey, 2014.
Denominator: Men age 40 and over.
Note: For this measure, lower rates are better. The 2014 data are not comparable with previous data, because screening is defined as a routine exam in the past year. Data in last year’s chart were based on broader definition of screening.
- Importance: Finding more harm than benefit, in 2008, the U.S. Preventive Services Task Force recommended against screening men age 75 and over with prostate-specific antigen (PSA) tests. In 2012, this recommendation was extended to all men.
- Overall Rate: In 2014, 21.1% of men age 40 and over reported a PSA test in the past year (data not shown).
- Groups With Disparities:
- In 2014, men ages 40-54 were less likely to receive a PSA test in the past year compared with those ages 55-74 and 75 and over.
- Among men ages 40-54, Asians were less likely than Whites to receive PSA testing and Blacks were more likely to receive the test.
- Among men ages 55-74, Blacks, Asians, and American Indians and Alaska Natives (AI/ANs) were less likely than Whites to receive PSA testing.
- Among men age 75 and over, AI/ANs were less likely than Whites to receive PSA testing.
- Across all age groups, men with less than a high school education and those with a high school education were less likely than men with any college to receive PSA testing.


