- Supplemental measures:
- May provide contextual information related to health care quality.
- Are not part of the measure set tracked in the QDR because they are difficult to interpret.
- Supplemental measure of Care Affordability:
- Per capita national health expenditures.
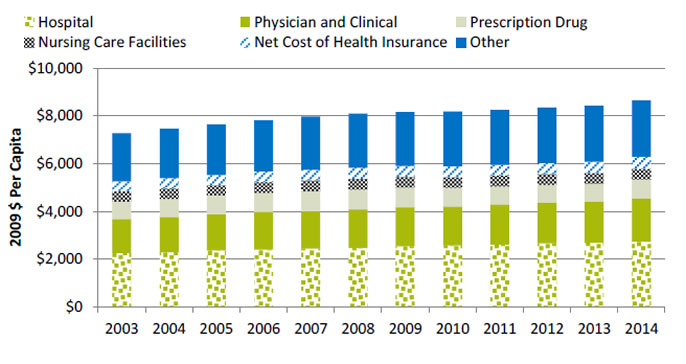
Per Capital National Health Expenditures
Per capita national health expenditures in 2009 $, by largest components, 2003-2014

| Component | 2003 | 2004 | 2005 | 2006 | 2007 | 2008 | 2009 | 2010 | 2011 | 2012 | 2013 | 2014 |
|---|---|---|---|---|---|---|---|---|---|---|---|---|
| Hospital | 2,263 | 2,295 | 2,363 | 2,399 | 2,440 | 2,465 | 2,543 | 2,570 | 2,608 | 2,667 | 2,683 | 2,739 |
| Physician and Clinical | 1,421 | 1,474 | 1,523 | 1,572 | 1,575 | 1,628 | 1,636 | 1,634 | 1,677 | 1,709 | 1,739 | 1,799 |
| Prescription Drug | 725 | 758 | 774 | 808 | 829 | 821 | 826 | 785 | 765 | 745 | 741 | 798 |
| Nursing Care Facilities | 432 | 432 | 440 | 441 | 451 | 447 | 447 | 447 | 452 | 446 | 445 | 453 |
| Net Cost of Health Insurance | 420 | 434 | 428 | 450 | 450 | 467 | 451 | 460 | 442 | 450 | 479 | 497 |
| Other | 2,010 | 2,065 | 2,118 | 2,141 | 2,226 | 2,264 | 2,256 | 2,288 | 2,307 | 2,328 | 2,336 | 2,367 |
Source: Centers for Medicare & Medicaid Services, National Health Expenditure Data, 2003-2014.
Denominator: U.S. population.
Note: Net cost of health insurance consists of insurers’ costs of paying bills, advertising, sales commissions, and other administrative costs; net additions to reserves; rate credits and dividends; premium taxes; and profits or losses. Other includes other professional services; dental services; other health, residential, and personal care; home health; government administration; other nondurable medical products; durable medical equipment; government public health activities; research; structures; and equipment.
- Importance: Increases in national expenditures on health care can affect costs for consumers.
- Trends:
- Total per capita national health expenditures in 2009 dollars rose from $7,271 in 2003 to $8,653 in 2014.
- Expenditures on hospitals and physicians rose an average of 2% per year while expenditures on prescription drugs changed little.
- The five largest components of national health expenditures were hospital, physician and clinical, prescription drug, and nursing care facilities, along with net cost of health insurance (revenues minus expenses).


