Connecting the Dots: Improving Unit Safety Culture to Stop HAI
Slide Presentation
Slide 1
Connecting the Dots: Improving Unit Safety Culture to Stop HAI
Katherine J. Jones, PT, PhD
University of Nebraska Medical Center
Slide 2
Supported By
- AHRQ Partnerships in Implementing Patient Safety Grants (1 U18 HS015822, 1R18HS021429)
The content is solely the responsibility of the author and does not necessarily represent the official views of the Agency for Healthcare Research and Quality. - National Rural Health Association
- Nebraska Department of Health and Human Services
- AHRQ Office of Communications and Knowledge Transfer
- Hospitals in Nebraska, Iowa, Louisiana, Washington, Oregon, Alaska
Slide 3
Learning Objectives
- Define safety culture
- Describe how to measure safety culture
- Explain the relationship between prevention and healthcare-associated infections and safety culture
Slide 4
What is Safety Culture
- Definition
- Role of Organizational Culture
- Categories of Culture
- 3 Levels of Culture
- 4 Components of Culture
Slide 5
Definition of Safety Culture
- Enduring, shared, learned1 beliefs and behaviors that reflect an organization’s willingness to learn from errors2
- Four beliefs present in a safe, informed culture3:
- Our processes are designed to prevent failure
- We are committed to detect and learn from error
- We have a just culture that disciplines based on risk taking
- People who work in teams make fewer errors
Slide 6
The Role of Organizational Culture
Organizational Culture1
- Allows us to make sense of environment
- Reflects common language… is heard and observed
- Leaders create/teach culture:
- Share information
- Reward, provide feedback
- Hold people accountable
Safety Culture4
- A cross cutting contextual factor
- Moderates effectiveness of patient safety interventions
- Associated with adverse events and patient satisfaction
Slide 7
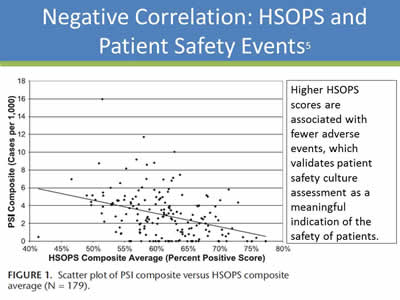
Negative Correlation: HSOPS and Patient Safety Events5
Higher HSOPS scores are associated with fewer adverse events, which validates patient safety culture assessment as a meaningful indication of the safety of patients.
Image: A scatter plot illustrating a negative correlation between HSOPS average composite scores and a composite of patient safety indicators (PSIs) for 179 hospitals.
Slide 8
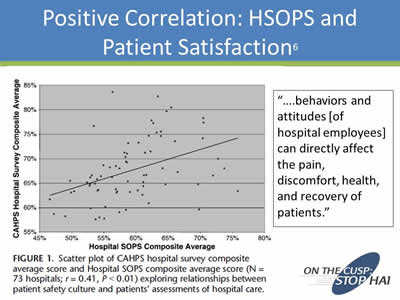
Positive Correlation: HSOPS and Patient Satisfaction6
“….behaviors and attitudes [of hospital employees] can directly affect the pain, discomfort, health, and recovery of patients.”
Image: A scatter plot illustrating a positive correlation between HSOPS average composite scores and CAHPS average composite scores for 73 hospitals.
Slide 9
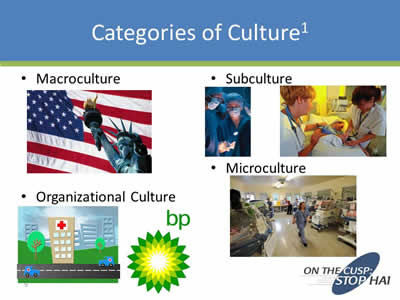
Categories of Culture1
- Macroculture
- Subculture
- Organizational Culture
- Microculture
Images: Photo of the American flag and Statue of Liberty under Macroculture; photos of health professionals under Subculture, photos of a cartoon hospital and BP logo under Organizational Culture; and photo of a supermarket underneath Microculture.
Slide 10
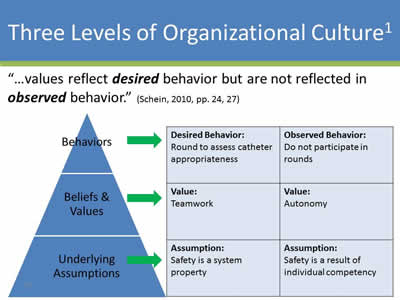
Three Levels of Organizational Culture1
“…values reflect desired behavior but are not reflected in observed behavior.” (Schein, 2010, pp. 24, 27)
Image: Pyramid with Behaviors on the top, Beliefs & Values in the middle, and Underlying Assumptions on the bottom. Arrows are pointed to the right to a table with more descriptions.
| Desired Behavior: Round to assess catheter appropriateness |
Observed Behavior: Do not participate in rounds |
| Value: Teamwork |
Value: Autonomy |
| Assumption: Safety is a system property |
Assumption: Safety is a result of individual competency |
Slide 11
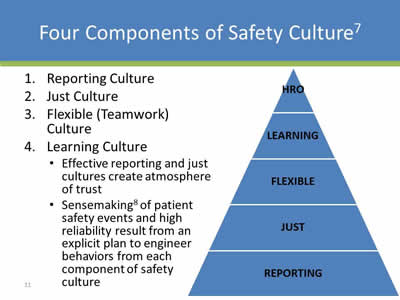
Four Components of Safety Culture7
- Reporting Culture
- Just Culture
- Flexible (Teamwork) Culture
- Learning Culture:
- Effective reporting and just cultures create atmosphere of trust
- Sensemaking8 of patient safety events and high reliability result from an explicit plan to engineer behaviors from each component of safety culture
Image: Pyramid with five levels from top to bottom: HRO, Learning, Flexible, Just, Reporting
Slide 12
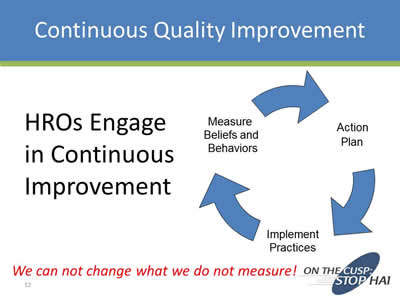
Continuous Quality Improvement
HROs Engage in Continuous Improvement
We can not change what we do not measure!
Image: Cycle diagram showing how to engage in continuous improvement through Measure Beliefs and Behaviors, Action Plan, and Implement Practices.
Slide 13
How Do You Measure Safety Culture?1
- Qualitative:
- Focus Groups
- Structured Interviews
- Observation
- Quantitative Survey Tools…use best tool for your setting:
- Goals of assessment
Slide 14
Goals of Culture Assessment 1,9,10
- Identify areas of culture in need of improvement:
- Identify impairments in organizational learning
- Increase awareness of patient safety concepts
- Evaluate effectiveness of patient safety interventions over time
- Conduct internal and external benchmarking
- Meet regulatory requirements
- Identify gaps between beliefs and observed behaviors within subcultures and microcultures
Slide 15
When Should You Measure Safety Culture?11
- Baseline prior to patient safety intervention
- 12 – 24 month intervals to monitor change over time
Slide 16
Hospital Survey on Patient Safety Culture12
- Survey tool kit available
http://www.ahrq.gov/professionals/quality-patient-safety/patientsafetyculture/hospital/index.html - Comparative Database for Benchmarking
http://www.ahrq.gov/professionals/quality-patient-safety/patientsafetyculture/hospital/hosp-reports.html- 1,128 hospitals; 567,703 respondents in 2012 database
- 42 items categorized in 12 composites/dimensions:
- 9 dimensions measure culture at dept/unit level
- 3 dimensions measure culture at hospital level
- 2 additional outcome measures at dept/unit level (Patient Safety Grade, Number of Events Reported)
- Comments
Slide 17
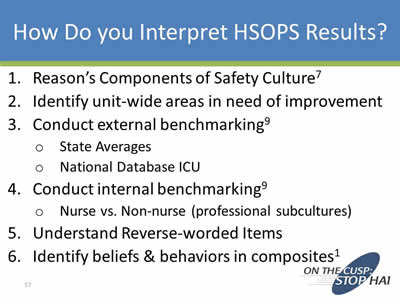
How Do You Interpret HSOPS Results?
- Reason’s Components of Safety Culture7
- Identify unit-wide areas in need of improvement
- Conduct external benchmarking9:
- State Averages
- National Database ICU
- Conduct internal benchmarking9:
- Nurse vs. Non-nurse (professional subcultures)
- Understand Reverse-worded Items
- Identify beliefs & behaviors in composites1
Slide 18
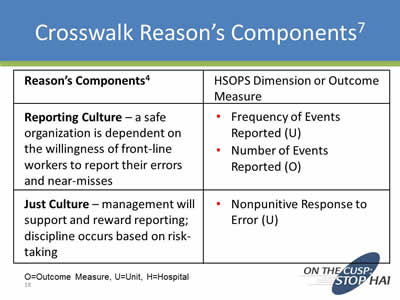
Crosswalk Reason’s Components7
| Reason’s Components4 | HSOPS Dimension or Outcome Measure |
|---|---|
| Reporting Culture - a safe organization is dependent on the willingness of front-line workers to report their errors and near-misses |
|
| Just Culture - management will support and reward reporting; discipline occurs based on risk-taking |
|
O=Outcome Measure, U=Unit, H=Hospital
Slide 19
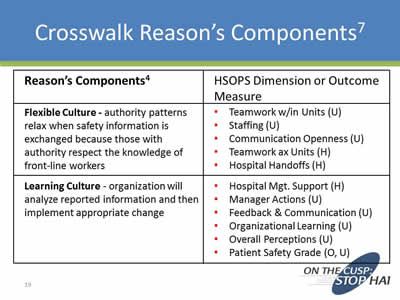
Crosswalk Reason’s Components7
| Reason’s Components4 | HSOPS Dimension or Outcome Measure |
|---|---|
| Flexible Culture - authority patterns relax when safety information is exchanged because those with authority respect the knowledge of front-line workers |
|
| Learning Culture - organization will analyze reported information and then implement appropriate change |
|
Slide 20
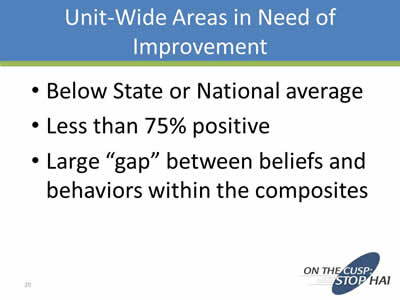
Unit-Wide Areas in Need of Improvement
- Below State or National average
- Less than 75% positive
- Large “gap” between beliefs and behaviors within the composites
Slide 21
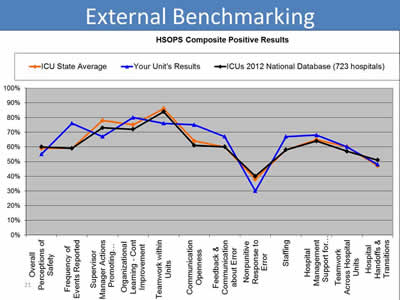
External Benchmarking
Image: This is a graph with 12 Composites of HSOPS on the X axis and percent positive on the Y axis. It compares HSOPS results for a unit, the state average, and ICUs reporting to the 2012 National Comparative Database.
Slide 22
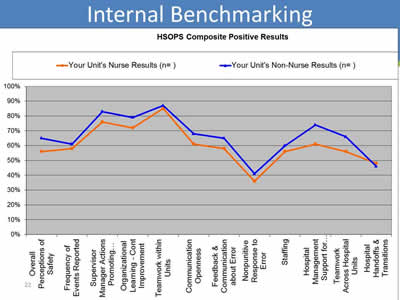
Internal Benchmarking
Image: This is a graph with 12 Composites of HSOPS on the X axis and percent positive on the Y axis. It compares HSOPS results for Nurses in ICU to Non-Nurses.
Slide 23
Reverse-Worded Items
- Score reported is “percent positive”:
- Percentage of responses rated 4 or 5 (Agree/Strongly agree or Most of the Time/Always) for positively-worded items, or 1 or 2 (Disagree/Strongly Disagree or Rarely/Never) for reverse-worded items
- Positive is positive for patient safety, higher score better:
- We work in “crisis mode” trying to do too much, too quickly. (A14R)
- 8 of 12 composites have at least 1 reverse-worded item
- 2 Composites all items reverse-worded:
- Handoffs & Transitions
- Nonpunitive Response to Error
Slide 24
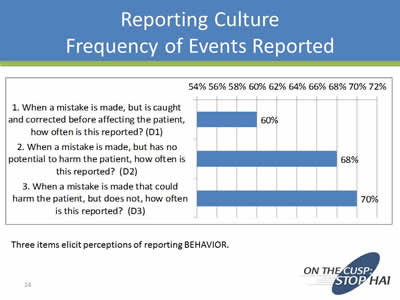
Reporting Culture Frequency of Events Reported
Three items elicit perceptions of reporting Behavior.
Image: Bar chart depicting results for the three items in the HSOPS Frequency of Events Reported Composite.
1. When a mistake is made, but is caught and corrected before affecting the patient, how often is this reported? 60%
2. When a mistake is made, but has no potential to harm the patient, how often is this reported? 68%
3. When a mistake is made that could harm the patient, but does not, how often is this reported? 70%
Slide 25
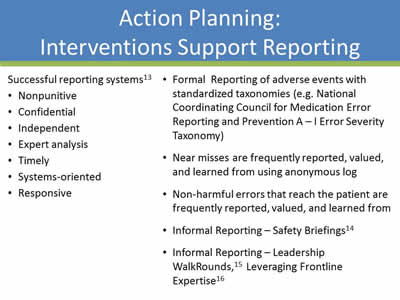
Action Planning: Interventions Support Reporting
Successful reporting systems13
- Nonpunitive
- Confidential
- Independent
- Expert analysis
- Timely
- Systems-oriented
- Responsive
Formal Reporting of adverse events with standardized taxonomies (e.g. National Coordinating Council for Medication Error Reporting and Prevention A–I Error Severity Taxonomy)
- Near misses are frequently reported, valued, and learned from using anonymous log
- Non-harmful errors that reach the patient are frequently reported, valued, and learned from
- Informal Reporting – Safety Briefings14
- Informal Reporting – Leadership WalkRounds,15 Leveraging Frontline Expertise16
Slide 26
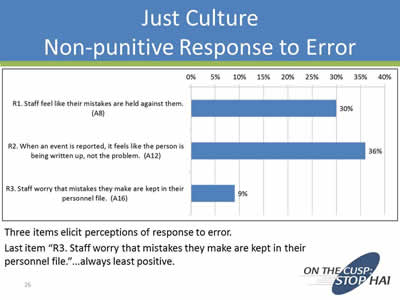
Just Culture: Non-punitive Response to Error
Three items elicit perceptions of response to error.Action Planning: Interventions to Support Just Culture
Last item “R3. Staff worry that mistakes they make are kept in their personnel file.”…always least positive.
Image: Bar chart depicting results for the three items in the HSOPS Nonpunitive Response to Error Composite.
1. Staff feel like their mistakes are held against them. 30%
2. When an event is reported, it feels like the person is being written up, not the problem. 36%
3. Staff worry that mistakes they make are kept in their personnel file. 9%
Slide 27
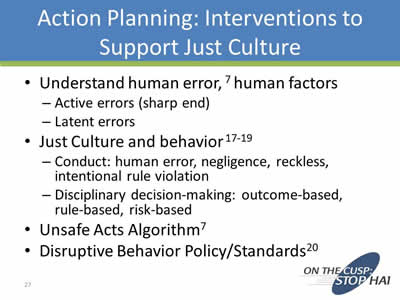
Action Planning: Interventions to Support Just Culture
- Understand human error,7 human factors:
- Active errors (sharp end)
- Latent errors
- Just Culture and behavior17-19:
- Conduct: human error, negligence, reckless, intentional rule violation
- Disciplinary decision-making: outcome-based, rule-based, risk-based
- Unsafe Acts Algorithm7
- Disruptive Behavior Policy/Standards20
Slide 28
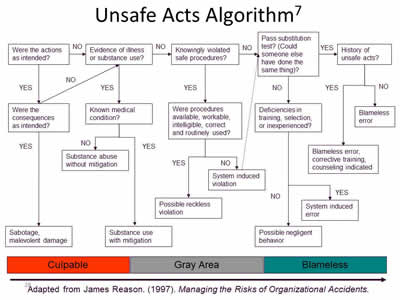
Unsafe Acts Algorithm7
Adapted from James Reason. (1997). Managing the Risks of Organizational Accidents.
Image: Organizational chart showing the unsafe acts algorithm. Goes from culpable to gray area to blameless.
Slide 29
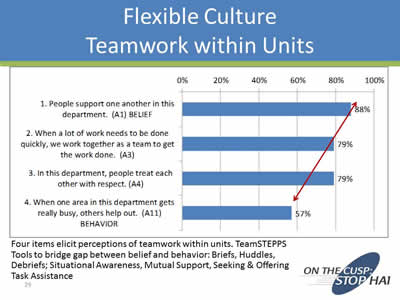
Flexible Culture: Teamwork within Units
Four items elicit perceptions of teamwork within units. TeamSTEPPS Tools to bridge gap between belief and behavior: Briefs, Huddles, Debriefs; Situational Awareness, Mutual Support, Seeking & Offering Task Assistance.
Image: Bar chart depicting results for the four items in the HSOPS Teamwork within Units Composite.
1. People support one another in this department. BELIEF 88%
2. When a lot of work needs to be done quickly, we work together as a team to get the work done. 79%
3. In this department, people treat each other with respect. 79%
4. When one area in this department gets really busy, others help out. BEHAVIOR 57%
Slide 30
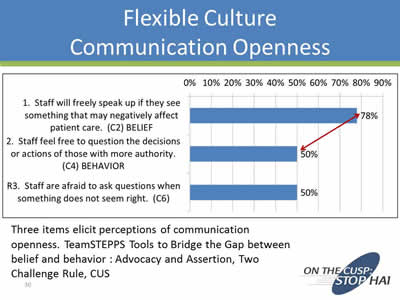
Flexible Culture: Communication Openness
Three items elicit perceptions of communication openness. TeamSTEPPS Tools to Bridge the Gap between belief and behavior : Advocacy and Assertion, Two Challenge Rule, CUS.
Image: Bar chart depicting results for the three items in the HSOPS Communication Openness Composite.
1. Staff will freely speak up if they see something that may negatively affect patient care. BELIEF 78%
2. Staff feel free to question the decisions or actions of those with more authority. BEHAVIOR 50%
3. Staff are afraid to ask questions when something does not seem right. 50%
Slide 31
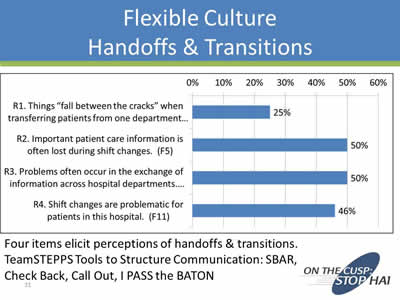
Flexible Culture: Handoffs & Transitions
Four items elicit perceptions of handoffs & transitions. TeamSTEPPS Tools to Structure Communication: SBAR, Check Back, Call Out, I PASS the BATON
Image: Bar chart depicting results for the four items in the HSOPS Handoffs & Transitions Composite.
1. Things "fall between the cracks" when transferring patients from one department... 25%
2. Important patient care information is often lost during shift changes. 50%
3. Problems often occur in the exchange of information across hospital departments... 50%
4. Shift changes are problematic for patients in this hospital. 46%
Slide 32
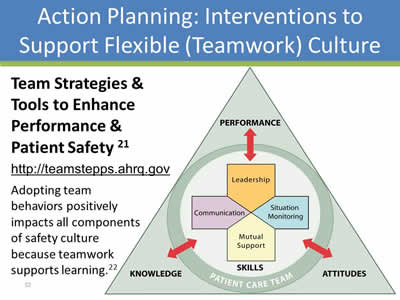
Action Planning: Interventions to Support Flexible (Teamwork) Culture
Team Strategies & Tools to Enhance Performance & Patient Safety21
http://teamstepps.ahrq.gov
Adopting team behaviors positively impacts all components of safety culture because teamwork supports learning.22
Image: The TeamSTEPPS Logo: A triangle showing the relationship between knowledge, attitudes, and performance with the patient care team skills.
Slide 33
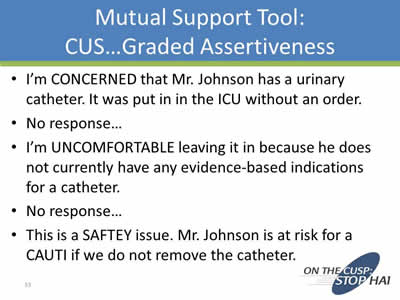
Mutual Support Tool: CUS… Graded Assertiveness
- I’m CONCERNED that Mr. Johnson has a urinary catheter. It was put in in the ICU without an order.
- No response…
- I’m UNCOMFORTABLE leaving it in because he does not currently have any evidence-based indications for a catheter.
- No response…
- This is a SAFETY issue. Mr. Johnson is at risk for a CAUTI if we do not remove the catheter.
Slide 34
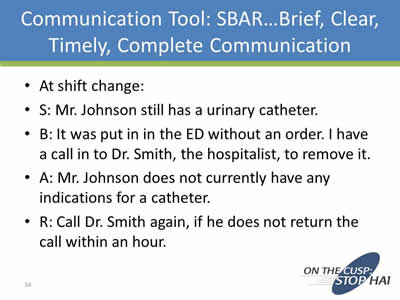
Communication Tool: SBAR… Brief, Clear, Timely, Complete Communication
- At shift change.
- S: Mr. Johnson still has a urinary catheter.
- B: It was put in in the ED without an order. I have a call in to Dr. Smith, the hospitalist, to remove it.
- A: Mr. Johnson does not currently have any indications for a catheter.
- R: Call Dr. Smith again, if he does not return the call within an hour.
Slide 35
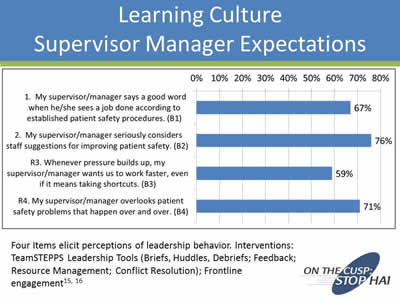
Learning Culture: Supervisor Manager Expectations
Four Items elicit perceptions of leadership behavior. Interventions: TeamSTEPPS Leadership Tools (Briefs, Huddles, Debriefs; Feedback; Resource Management; Conflict Resolution); Frontline engagement15, 16
Image: Bar chart depicting results for the four items in the HSOPS Supervisor/Manager Expectations and Actions Promoting Patient Safety Composite.
1. My supervisor/manager says a good work when he/she sees a job done according to established patient safety procedures. 67%
2. My supervisor/manager seriously considers staff suggestions for improving patient safety. 76%
3. Whenever pressure builds up, my supervisor/manager wants us to work faster, even if it means taking shortcuts. 59%
4. My supervisor/manager overlooks patients safety problems that happen over and over. 71%
Slide 36
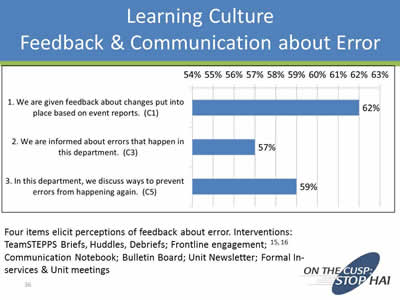
Learning Culture: Feedback & Communication About Error
Four items elicit perceptions of feedback about error. Interventions: TeamSTEPPS Briefs, Huddles, Debriefs; Frontline engagement;15, 16 Communication Notebook; Bulletin Board; Unit Newsletter; Formal In-services & Unit meetings
Image: Bar chart depicting results for the three items in the HSOPS Feedback and Communication about Error Composite.
1. We are given feedback about changes put into place based on event reports. 62%
2. We are informed about errors that happen in this department. 57%
3. In this department, we discuss ways to prevent errors from happening again. 59%
Slide 37
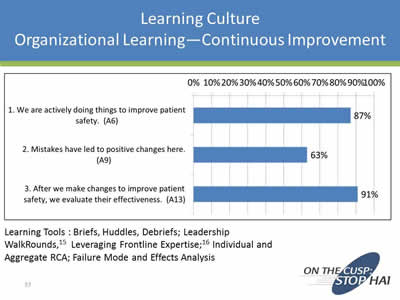
Learning Culture: Organizational Learning—Continuous Improvement
Learning Tools: Briefs, Huddles, Debriefs; Leadership WalkRounds,15 Leveraging Frontline Expertise;16 Individual and Aggregate RCA; Failure Mode and Effects Analysis
Image: Bar Chart depicting results for the three items in the HSOPS Feedback and Communication about Error Composite.
1. We are actively doing things to improve patient safety. 87%
2. Mistakes have led to positive changes here. 63%
3. After we make changes to improve patient safety, we evaluate their effectiveness. 91%
Slide 38
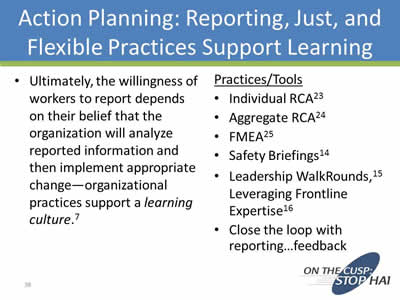
Action Planning: Reporting, Just, and Flexible Practices Support Learning
- Ultimately, the willingness of workers to report depends on their belief that the organization will analyze reported information and then implement appropriate change—organizational practices support a learning culture.7
Practices/Tools
- Individual RCA23
- Aggregate RCA24
- FMEA25 Safety Briefings14
- Leadership WalkRounds,15 Leveraging Frontline Expertise16
- Close the loop with reporting…feedback
Slide 39
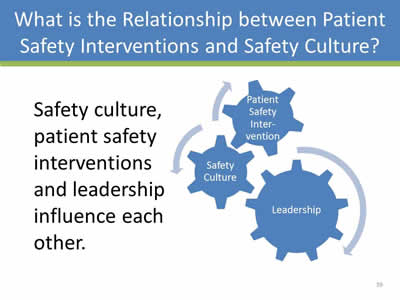
What is the Relationship between Patient Safety Interventions and Safety Culture?
Safety culture, patient safety interventions and leadership influence each other.
Image: Graphic that depicts the interrelationship between safety culture and patient safety interventions; and the fact that leadership drives both.
Slide 40
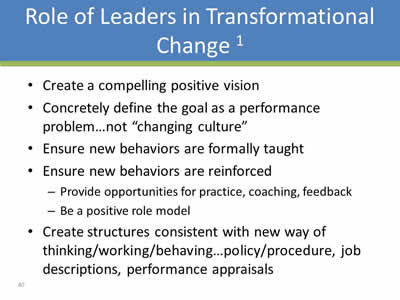
Role of Leaders in Transformational Change1
- Create a compelling positive vision
- Concretely define the goal as a performance problem…not “changing culture”
- Ensure new behaviors are formally taught
- Ensure new behaviors are reinforced:
- Provide opportunities for practice, coaching, feedback
- Be a positive role model
- Create structures consistent with new way of thinking/working/behaving…policy/procedure, job descriptions, performance appraisals
Slide 41
Summary
- What is safety culture?
- Beliefs, behaviors reflect organizational ability to learn
- Associated with adverse events, patient satisfaction
- How do you interpret results?
- Reason’s Components (12 composites – 4 components)
- Gaps between beliefs/behaviors within composites
- Variation by subculture (profession), microculture (unit)
- Leadership must drive culture
Slide 42
Summary
- Action Planning:
- Identify areas in need of improvement within 4 components…reporting, just culture, teamwork, learning
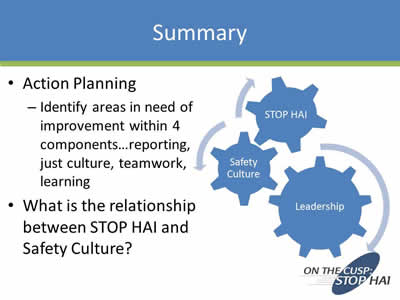
- What is the relationship between STOP HAI and Safety Culture?
Image: Graphic that depicts the interrelationship between safety culture and stopping HAI; and the fact that leadership drives both.
Slide 43
Leaders Engineer Culture
“…it is the unique function of leadership to perceive the functional and dysfunctional elements and to manage cultural evolution and change.”
Schein, E.H. Organizational Leadership and Culture 4th ed. San Francisco: John Wiley & Sons; 2010.
Slide 44

Thank you!
Questions?
Slide 45
References
- Schein, E.H. Organizational Leadership and Culture 4th ed. San Francisco: John Wiley & Sons; 2010.
- Wiegmann. A synthesis of safety culture and safety climate research; 2002. http://www.humanfactors.uiuc.edu/Reports&PapersPDFs/TechReport/02-03.pdf
- Institute of Medicine. Patient safety: Achieving a new standard of care. Washington, DC: The National Academies Press; 2004.
- Weaver SJ, Lubomski LH, Wilson RF, Pfoh ER, Martinez KA, Dy SM. Promoting a culture of safety as a patient safety strategy: A systematic review. Ann Int Med. 2013;158:369-374.
- Mardon RE, Khanna K, Sorra J, Dyer N, Famolaro T. Exploring relationships between hospital patient safety culture and adverse events. J Patient Saf 2010;6: 226-232.
- Sorra J, Khanna K, Dyer N, Mardon R, Famolaro T. Exploring relationships between patient safety culture and patients’ assessments of hospital care. J Patient Saf 2012;8: 131-139.
- Reason, J. (1997). Managing the Risks of Organizational Accidents. Hampshire, England: Ashgate Publishing Limited.
Slide 46
References
- Battles et al. (2006). Sensemaking of patient safety risks and hazards. HSR, 41(4 Pt 2), 1555-1575.
- Nieva VF, Sorra J. Safety culture assessment: A tool for improving patient safety in healthcare organizations. Qual Saf Health Care 2003; 12(Suppl II): ii17-ii23.
- Jones, Skinner, Xu, Sun, Mueller. (2008). The AHRQ Hospital Survey on Patient Safety Culture: a tool to plan and evaluate patient safety programs. Advances in Patient Safety: New Directions and Alternative Approaches. http://www.ncbi.nlm.nih.gov/books/NBK43699/
- National Quality Forum (NQF). Safe practices for better healthcare--2010 update: A consensus report. Washington, DC: NQF; 2010. Available at: http://www.qualityforum.org/Publications/2010/04/Safe_Practices_for_Better_Healthcare_–_2010_Update.aspx.
- AHRQ. Hospital Survey on Patient Safety Culture. Available at: http://www.ahrq.gov/professionals/quality-patient-safety/patientsafetyculture/hospital/resources/index.html.
- Leape, L.L. (2002) Reporting adverse events. NEJM, 347, 1633-1638 Institute for Healthcare Improvement.
Slide 47
References
- Conduct Safety Briefings. Available at: http://www.ihi.org/knowledge/Pages/Changes/ConductSafetyBriefings.aspx.
- Institute for Healthcare Improvement. Patient Safety Leadership WalkRounds. Available at: http://www.ihi.org/knowledge/pages/tools/patientsafetyleadershipwalkrounds.aspx.
- Singer SJ, Rivard PE, Hayes JE, Shokeen P, Gaba D, Rosen A. Improving patient care through leadership engagement with frontline staff: A Department of Veterans Affairs case study. Joint Commission Journal on Quality and Patient Safety. 2013;39:349-360.
- Marx D. Patient Safety and the “Just Culture”: A Primer for Health Care Executives. New York, NY: Columbia University; 2001. Available at: http://psnet.ahrq.gov/resource.aspx?resourceID=1582.
- Frankel AS, Leonard MW, Denham CR. Fair and just culture, team behavior, and leadership engagement: the tools to achieve high reliability. HSR. 2006;41(4),Part II:1690-1709.
- Wachter RM, Pronovost PJ. Balancing "no blame" with accountability in patient safety. NEJM. 2009;361:1401-1406.
- AHRQ. Patient Safety Primers. Disruptive and Unprofessional Behavior. Available at: http://psnet.ahrq.gov/primer.aspx?primerID=15.
Slide 48
References
- Agency for Healthcare Research and Quality. TeamSTEPPS: Strategies and tools to enhance performance and patient safety. Available at: http://teamstepps.ahrq.gov/.
- Jones KJ, Skinner AM, High R, Reiter-Palmon R. A theory-driven longitudinal evaluation of the impact of team training on safety culture in 24 hospitals. BMJ Qual Saf. 2013;22:394-404.
- US Department of Veterans Affairs. National Center for Patient Safety. Root Cause Analysis Tools. Available at: http://www.patientsafety.gov/CogAids/RCA/index.html#page=page-1.
- Neily et al. Using aggregate root cause analysis to improve patient safety. Jt Comm J Qual Saf 29(8):434-439, 2003.
- US Department of Veterans Affairs. National Center for Patient Safety. Using Healthcare Failure Modes and Effects Analysis. Available at: http://www.patientsafety.gov/SafetyTopics/HFMEA/HFMEA_JQI.html
Slide 49
Funding
Prepared by the Health Research & Educational Trust of the American Hospital Association with contract funding provided by the Agency for Healthcare Research and Quality through the contract, “National Implementation of Comprehensive Unit-based Safety Program (CUSP) to Reduce Catheter-Associated Urinary Tract Infection (CAUTI), project number HHSA290201000025I/HHSA29032001T, Task Order #1.”


