Build a Business Case for Quality Improvement: Slide Presentation
AHRQ Safety Program for Mechanically Ventilated Patients
Slide 1: AHRQ Safety Program for Mechanically Ventilated Patients
Build a Business Case for Quality Improvement
Slide 2: Learning Objectives
After this session, you will be able to—
- Describe how this safety program can affect the hospital’s financial bottom line.
- List the elements of a strong business case.
- Give statistics local meaning to support your initiative.
- Present your initiative in a way meaningful to financial leaders.
Slide 3: Impact of Mechanical Ventilation
- Affects 800,000 hospitalized patients in the U.S. each year.1
- Five to 10 percent of mechanically ventilated patients develop a ventilator-associated event (VAE).2,3
1. Carson SS, Cox CE, Homes GM, et al. The changing epidemiology of mechanical ventilation: a population-based study. J Intensive Care Med 2006; 21(3):173-82. PMID: 16672639.
2. Klompas M, Khan Y, Kleinman K, et al. Multicenter evaluation of a novel surveillance paradigm for complications of mechanical ventilation. PLoS ONE 2011 Mar 22;6(3):e18062. PMID: 21445364.
3. Klein Klouwenberg PM, van Mourik MS, Ong DS, et al. Electronic implementation of a novel surveillance paradigm for ventilator-associated events: feasibility and validation. Am J Respir Crit Care Med 2014 Apr 15;189(8):947-55. PMID: 24498886.
Slide 4: Impact of Mechanical Ventilation
- Historically, ventilator-associated pneumonia (VAP) was considered one of the most lethal healthcare-associated infections.4
- 35% mortality rate for ventilated patients:5
- 24% for patients 15–19 years.
- 60% for patients 85 years and older.
4. Safdar N, Dezfullian C, Collard HR, et al. Clinical and economic consequences of ventilator–associated pneumonia: a systematic review. Crit Care Med 2005; 33(10):2184-93. PMID: 16215368.
5. Wunsch H, Linde-Zwirble WT, Angus DC, et al. The epidemiology of mechanical ventilation use in the United States. Crit Care Med 2010; 38(10):1947-53. PMID: 20639743.
Slide 5: Impact on Mechanical Ventilated Patients
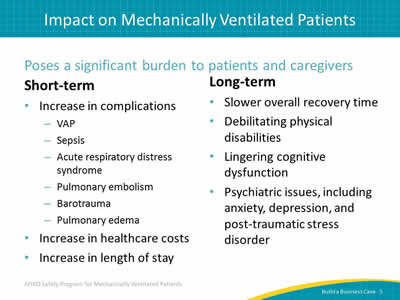
Poses a significant burden to patients and caregivers.
Short-term:
- Increase in complications:
- VAP.
- Sepsis.
- Acute respiratory distress syndrome.
- Pulmonary embolism.
- Barotrauma.
- Pulmonary edema.
- Increase in health care costs.
- Increase in length of stay.
Long-term:
- Slower overall recovery time.
- Debilitating physical disabilities.
- Lingering cognitive dysfunction.
- Psychiatric issues, including anxiety, depression, and post-traumatic stress disorder.
Slide 6: Financial Impact of Mechanical Ventilation
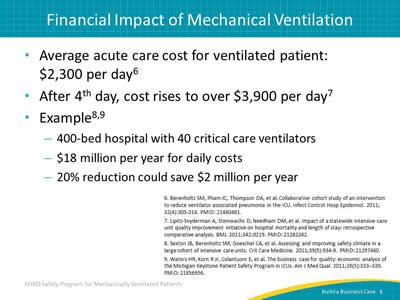
- Average acute care cost for ventilated patient: $2,300 per day.6
- After 4th day, cost rises to over $3,900 per day.7
- Example:8,9
- 400-bed hospital with 40 critical care ventilators.
- $18 million per year for daily costs.
- 20% reduction could save $2 million per year.
6. Berenholtz SM, Pham JC, Thompson DA, et al. Collaborative cohort study of an intervention to reduce ventilator associated pneumonia in the ICU. Infect Control Hosp Epidemiol 2011; 32(4):305-314. PMID: 21460481.
7. Lipitz-Snyderman A, Steinwachs D, Needham DM, et al. Impact of a statewide intensive care unit quality improvement initiative on hospital mortality and length of stay: retrospective comparative analysis. BMJ 2011;342:d219. PMID: 21282262.
8. Sexton JB, Berenholtz SM, Goeschel CA, et al. Assessing and improving safety climate in a large cohort of intensive care units. Crit Care Medicine 2011;39(5):934-9. PMID: 21297460.
9. Waters HR, Korn R Jr, Colantuoni E, et al. The business case for quality: economic analysis of the Michigan Keystone Patient Safety Program in ICUs. Am J Med Qual 2011;26(5):333–339. PMID: 21856956.
Slide 7: Ventilator-Associated Events (VAEs) Attributable Hospital Mortality10-13
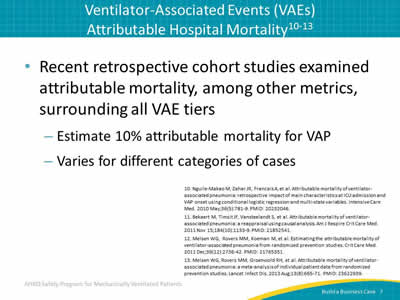
- Recent retrospective cohort studies examined attributable mortality, among other metrics, surrounding all VAE tiers:
- Estimate 10% attributable mortality for VAP.
- Varies for different categories of cases.
10. Nguile-Makao M, Zahar JR, Francais A, et al. Attributable mortality of ventilator-associated pneumonia: retrospective impact of main characteristics at ICU admission and VAP onset using conditional logistic regression and multi-state variables. Intensive Care Med 2010 May;36(5):781-9. PMID: 20232046.
11. Bekaert M, Timsit JF, Vansteelandt S, et al. Attributable mortality of ventilator-associated pneumonia: a reappraisal using causal analysis. Am J Respire Crit Care Med 2011 Nov 15;184(10):1133-9. PMID: 21852541.
12. Melsen WG, Rovers MM, Koeman M, et al. Estimating the attributable mortality of ventilator-associated pneumonia from randomized prevention studies. Crit Care Med 2011 Dec;39(12):2736-42. PMID: 21765351.
13. Melsen WG, Rovers MM, Groenwold RH, et al. Attributable mortality of ventilator-associated pneumonia: a meta-analysis of individual patient data from randomized prevention studies. Lancet Infect Dis 2013 Aug;13(8):665-71. PMID: 23622939.
Slide 8: VAPs Among Most Expensive HACs14
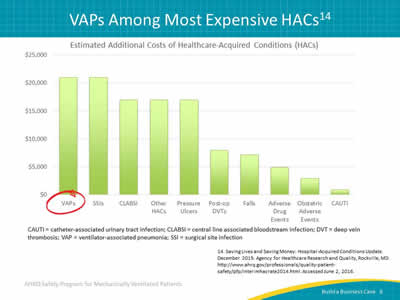
Image: Bar graph demonstrating the significant additional costs of VAPs among other HACs. CAUTI = catheter-associated urinary tract infection; CLABSI = central line associated bloodstream infection; DVT = deep vein thrombosis; VAP = ventilator-associated pneumonia; SSI = surgical site infection.
14. Saving Lives and Saving Money: Hospital-Acquired Conditions Update. December 2015. Agency for Healthcare Research and Quality, Rockville, MD. https://www.ahrq.gov/professionals/quality-patient-safety/pfp/interimhacrate2014.html. Accessed June 2, 2016.
Slide 9: What Do We Need To Do?
- Improve patient and family experience.
- Reduce complications.
- Get patients off the ventilator.
- Get patients ready to leave the intensive care unit (ICU) and hospital faster.
- Improve efficiency while reducing costs.
Slide 10: AHRQ Safety Program Goals
- To reduce risk of patient harms associated with mechanical ventilation:
- Reduce VAEs, including VAP.
- Reduce the duration of mechanical ventilation, length of stay (LOS), and mortality.
- To achieve significant improvements in teamwork and safety culture in ICUs.
Slide 11: Ventilator-Associated Events Successes
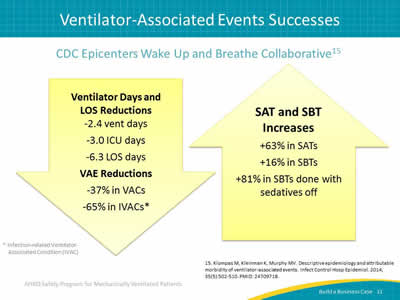
CDC Epicenters Wake Up and Breathe Collaborative15
Ventilator Days and LOS Reductions:
- -2.4 vent days.
- -3.0 ICU days.
- -6.3 LOS days.
VAE Reductions:
- -37% in VACs.
- -65% in IVACs.*
SAT and SBT Increases:
- +63% in SATs.
- +16% in SBTs.
- +81% in SBTs done with sedatives off.
Images: Arrow pointing down covering ventilator days and LOS reductions and VAE reductions. Arrow pointing up covering SAT and SBT increases.
* Infection-related Ventilator-Associated Condition (IVAC).
15. Klompas M, Kleinman K, Murphy MV. Descriptive epidemiology and attributable morbidity of ventilator-associated events. Infect Control Hosp Epidemiol 2014; 35(5):502-510. PMID: 24709718.
Slide 12: Why Build a Business Case?
Before agreeing to move forward with quality improvement efforts, your stakeholders may question your proposal by asking the following:
- Where will we get the money to pay for this?
- Why should we devote our scarce resources to this program?
- Can we afford these expense increases now?
Build a business case to prepare for these questions.
Slide 13: The Basic Business Model
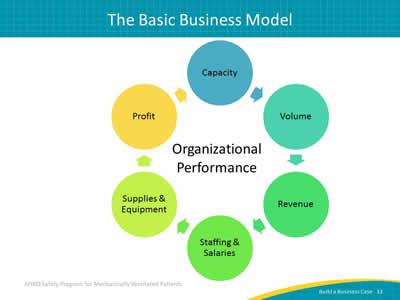
Image: Components of organizational performance displayed as a circular path: capacity, volume, revenue, staffing and salaries, supplies and equipment, profit.
Slide 14: Focus for Business Case
What do financial stakeholders focus on?
- Cost efficiency.
- Real cost reduction.
- Revenue enhancement.
- Balance sheet improvements.
- Intangible improvements.
Slide 15: Cost Efficiency
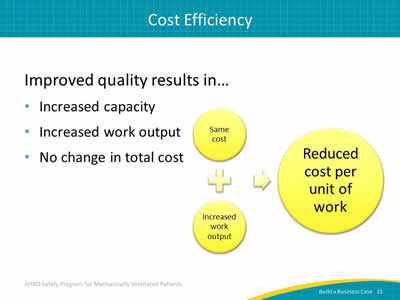
Improved quality results in…
- Increased capacity.
- Increased work output.
- No change in total cost.
Image: Same cost plus increased work output yields reduced cost per unit of work.
Slide 16: Real Cost Reduction
Improved quality results in…
- Increased capacity.
- No change in work output.
- Reduction in staffing levels.
Slide 17: Revenue Enhancement15
How does this quality improvement impact revenue?
- Reduces time on ventilator by 2.4 days.
- Reduces ICU length of stay by 3.0 days.
- Reduces hospital length of stay by 6.3 days.
- Increases capacity to care for new patients.
- Reduces VACs by 37%.
- Reduces IVACs by 65%.
- Reduces financial toll of complications.
15. Klompas M, Kleinman K, Murphy MV. Descriptive epidemiology and attributable morbidity of ventilator-associated events. Infect Control Hosp Epidemiol 2014; 35(5):502-510. PMID: 24709718.
Slide 18: Balance Sheet Improvements
How does quality improvement impact balance sheets?
- Maximizes brick and mortar investment.
- Increases funds available for capital purchases and other investments.
- Reduces the need for borrowing to increase capacity or invest in new programs.
Slide 19: Intangible Improvements
What are the intangible effects of quality improvement?
- Improved patient outcomes including reduction of long-term complications.
- Higher satisfaction scores from patients and families.
- Higher engagement and fulfilment among staff.
- Improved reputation of your institution.
- Reduced malpractice claims.
- Better market position in your community.
Slide 20: Return on Investment
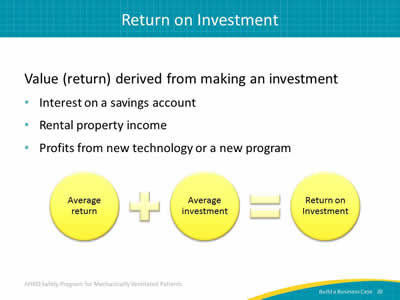
Value (return) derived from making an investment:
- Interest on a savings account.
- Rental property income.
- Profits from new technology or a new program.
Image: Average return plus average investment yields return on investment.
Slide 21: Understanding Your Target Audience
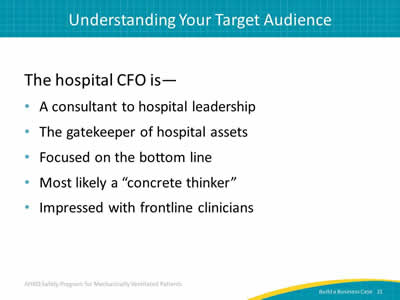
The hospital CFO is—
- A consultant to hospital leadership.
- The gatekeeper of hospital assets.
- Focused on the bottom line.
- Most likely a "concrete thinker."
- Impressed with frontline clinicians.
Slide 22: Giving Statistics Local Meaning
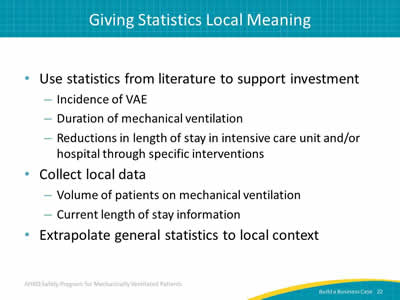
- Use statistics from literature to support investment:
- Incidence of VAE.
- Duration of mechanical ventilation.
- Reductions in length of stay in intensive care unit and/or hospital through specific interventions.
- Collect local data:
- Volume of patients on mechanical ventilation.
- Current length of stay information.
- Extrapolate general statistics to local context.
Slide 23: Giving Statistics Local Meaning
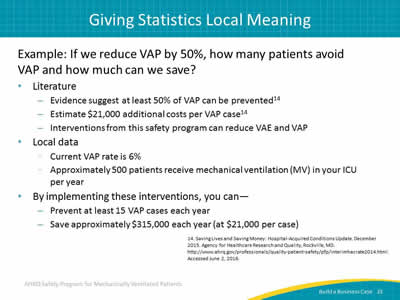
Example: If we reduce VAP by 50%, how many patients avoid VAP and how much can we save?
- Literature:
- Evidence suggest at least 50% of VAP can be prevented.14
- Estimate $21,000 additional costs per VAP case.14
- Interventions from this safety program can reduce VAE and VAP.
- Local data:
- Current VAP rate is 6%.
- Approximately 500 patients receive mechanical ventilation (MV) in your ICU per year.
- By implementing these interventions, you can—
- Prevent at least 15 VAP cases each year.
- Save approximately $315,000 each year (at $21,000 per case.
14. Saving Lives and Saving Money: Hospital-Acquired Conditions Update. December 2015. Agency for Healthcare Research and Quality, Rockville, MD. https://www.ahrq.gov/professionals/quality-patient-safety/pfp/interimhacrate2014.html. Accessed June 2, 2016.
Slide 24: Giving Statistics Local Meaning
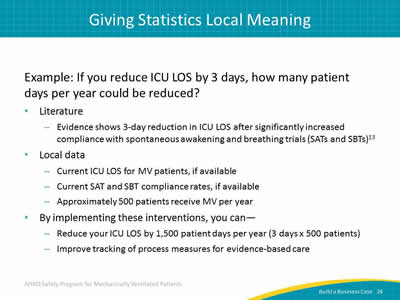
Example: If you reduce ICU LOS by 3 days, how many patient days per year could be reduced?
- Literature:
- Evidence shows 3-day reduction in ICU LOS after significantly increased compliance with spontaneous awakening and breathing trials (SATs and SBTs).13
- Local data:
- Current ICU LOS for MV patients, if available.
- Current SAT and SBT compliance rates, if available.
- Approximately 500 patients receive MV per year.
- By implementing these interventions, you can—
- Reduce your ICU LOS by 1,500 patient days per year (3 days x 500 patients).
- Improve tracking of process measures for evidence-based care.
Slide 25: Questions To Ask Your Leaders

Ask your leaders the following:
- Where will we get the money to pay for the associated costs for patients with preventable healthcare-acquired infections?
- How can we realize these savings and patient improvements?
- Can we afford to ignore these patient and financial costs?
- Would you want your loved one treated in a unit not practicing evidence-based care?
Slide 26: Making the Pitch
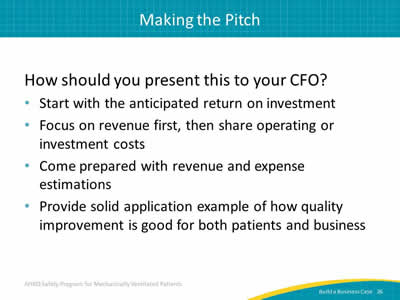
How should you present this to your CFO?
- Start with the anticipated return on investment.
- Focus on revenue first, then share operating or investment costs.
- Come prepared with revenue and expense estimations.
- Provide solid application example of how quality improvement is good for both patients and business.
Slide 27: Questions?

Image: Picture of multicolored hanging tags with question marks on them.
Slide 28: References
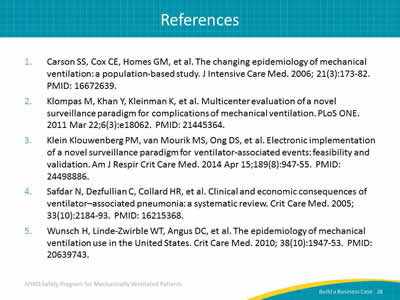
1. Carson SS, Cox CE, Homes GM, et al. The changing epidemiology of mechanical ventilation: a population-based study. J Intensive Care Med 2006; 21(3):173-82. PMID: 16672639.
2. Klompas M, Khan Y, Kleinman K, et al. Multicenter evaluation of a novel surveillance paradigm for complications of mechanical ventilation. PLoS ONE 2011 Mar 22;6(3):e18062. PMID: 21445364.
3. Klein Klouwenberg PM, van Mourik MS, Ong DS, et al. Electronic implementation of a novel surveillance paradigm for ventilator-associated events: feasibility and validation. Am J Respir Crit Care Med 2014 Apr 15;189(8):947-55. PMID: 24498886.
4. Safdar N, Dezfullian C, Collard HR, et al. Clinical and economic consequences of ventilator–associated pneumonia: a systematic review. Crit Care Med 2005; 33(10):2184-93. PMID: 16215368.
5. Wunsch H, Linde-Zwirble WT, Angus DC, et al. The epidemiology of mechanical ventilation use in the United States. Crit Care Med 2010; 38(10):1947-53. PMID: 20639743.
Slide 29: References
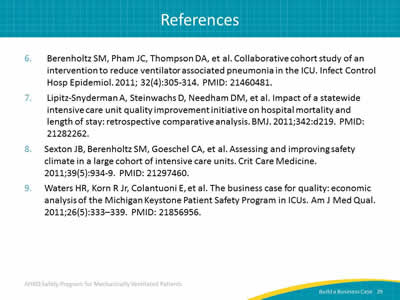
6. Berenholtz SM, Pham JC, Thompson DA, et al. Collaborative cohort study of an intervention to reduce ventilator associated pneumonia in the ICU. Infect Control Hosp Epidemiol 2011; 32(4):305-314. PMID: 21460481.
7. Lipitz-Snyderman A, Steinwachs D, Needham DM, et al. Impact of a statewide intensive care unit quality improvement initiative on hospital mortality and length of stay: retrospective comparative analysis. BMJ 2011;342:d219. PMID: 21282262.
8. Sexton JB, Berenholtz SM, Goeschel CA, et al. Assessing and improving safety climate in a large cohort of intensive care units. Crit Care Medicine 2011;39(5):934-9. PMID: 21297460.
9. Waters HR, Korn R Jr, Colantuoni E, et al. The business case for quality: economic analysis of the Michigan Keystone Patient Safety Program in ICUs. Am J Med Qual 2011;26(5):333–339. PMID: 21856956.
Slide 30: References
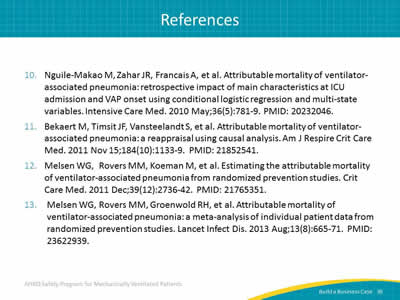
10. Nguile-Makao M, Zahar JR, Francais A, et al. Attributable mortality of ventilator-associated pneumonia: retrospective impact of main characteristics at ICU admission and VAP onset using conditional logistic regression and multi-state variables. Intensive Care Med 2010 May;36(5):781-9. PMID: 20232046.
11. Bekaert M, Timsit JF, Vansteelandt S, et al. Attributable mortality of ventilator-associated pneumonia: a reappraisal using causal analysis. Am J Respire Crit Care Med 2011 Nov 15;184(10):1133-9. PMID: 21852541.
12. Melsen WG, Rovers MM, Koeman M, et al. Estimating the attributable mortality of ventilator-associated pneumonia from randomized prevention studies. Crit Care Med 2011 Dec;39(12):2736-42. PMID: 21765351.
13. Melsen WG, Rovers MM, Groenwold RH, et al. Attributable mortality of ventilator-associated pneumonia: a meta-analysis of individual patient data from randomized prevention studies. Lancet Infect Dis 2013 Aug;13(8):665-71. PMID: 23622939.
Slide 31: References
14. Saving Lives and Saving Money: Hospital-Acquired Conditions Update. December 2015. Agency for Healthcare Research and Quality, Rockville, MD. https://www.ahrq.gov/professionals/quality-patient-safety/pfp/interimhacrate2014.html. Accessed June 2, 2016.
15. Klompas M, Kleinman K, Murphy MV. Descriptive epidemiology and attributable morbidity of ventilator-associated events. Infect Control Hosp Epidemiol 2014; 35(5):502-510. PMID: 24709718.


