Learn From Defects in Care of Mechanically Ventilated Patients: Slide Presentation
AHRQ Safety Program for Mechanically Ventilated Patients
Slide 1: AHRQ Safety Program for Mechanically Ventilated Patients
Learn From Defects in Care of Mechanically Ventilated Patients
Slide 2: Learning Objectives
After this session, you will be able to—
- Describe difference between first-order and second-order problem solving.
- List contributing factors that make defects in care more likely to occur.
- Use the Learning from Defects (LFD) tool to perform second-order problem solving.
- Evaluate the effectiveness of your intervention by measuring baseline and post-intervention performance.
- Present your findings to department leadership.
Slide 3: What Is a Defect?
A defect is any clinical or operational event or situation that you would not want to happen again.
These could include incidents that you believe caused patient harm or put patients at risk for significant harm.1
Image: Man wearing jeans and orange/black striped T-shirt sitting with hands raised to chin height with fingers outstretched in a questioning manner.
1. Pronovost PJ, Holzmueller CG, et al. A practical tool to learn from defects in patient care. Jt Comm J Qual Patient Saf 2006 Feb;32(2):102-8. PMID: 16568924.
Slide 4: Comprehensive Unit-based Safety Program (CUSP)
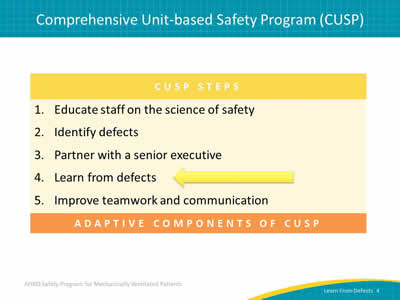
Image: Chart showing CUSP Steps:
- Educate staff on the science of safety.
- Identify defects.
- Partner with a senior executive.
- Learn from defects.
- Improve teamwork and communication.
An arrow points at "Learn from defects."
Slide 5: Principles of Safe Design
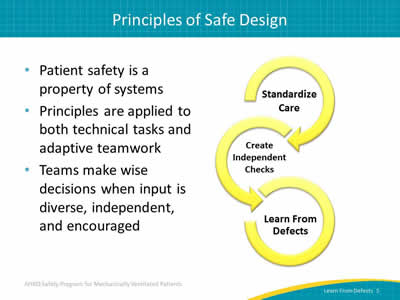
- Patient safety is a property of systems.
- Principles are applied to both technical tasks and adaptive teamwork.
- Teams make wise decisions when input is diverse, independent, and encouraged.
Image: Three curving yellow arrows represent the Elements of the Science of Safety:
- Standardize care.
- Create independent checks.
- Learn from defects.
Slide 6: Problem-Solving Hierarchy
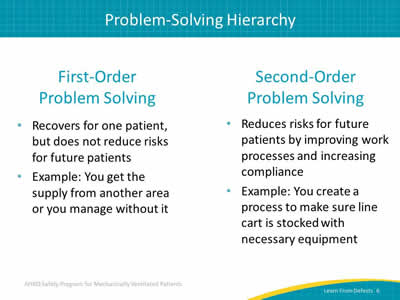
First-Order Problem Solving
- Recovers for one patient, but does not reduce risks for future patients.
- Example: You get the supply from another area or you manage without it.
Second-Order Problem Solving
- Reduces risks for future patients by improving work processes and increasing compliance.
- Example: You create a process to make sure line cart is stocked with necessary equipment.
Slide 7: Problem-Solving Goal
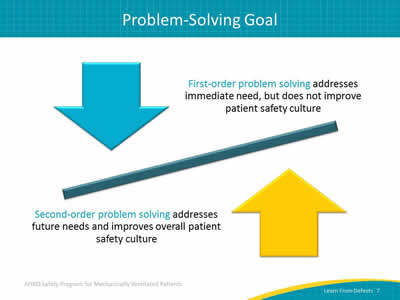
First-order problem solving addresses immediate need, but does not improve patient safety culture.
Second-order problem solving addresses future needs and improves overall patient safety culture.
Image: Counterbalanced arrows illustrate first-order problem solving versus second-order problem solving.
Slide 8: Where To Find Defects
- Adverse event reporting systems.
- Sentinel events.
- Claims data.
- Infection rates.
- Complications.
- Staff Safety Assessments (SSA):
- How will the next patient be harmed?
- What can you do to prevent or minimize this harm?
Tip: The SSA, the LFD tool, and other CUSP tools can be found at http://www.ahrq.gov/professionals/education/curriculum-tools/cusptoolkit/index.html.
Slide 9: Learning From Defects
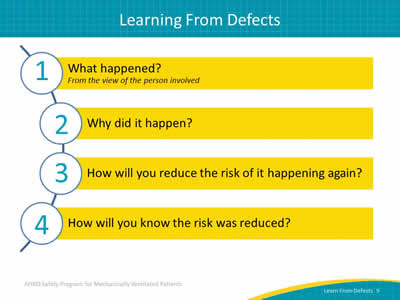
Image: Semi-circle shows the four questions that comprise the learning from defects process:
- What happened? From the view of the person involved.
- Why did it happen?
- How will you reduce the risk of it happening again?
- How will you know the risk was reduced?
Slide 10: Who Should Be Using the LFD Tool?
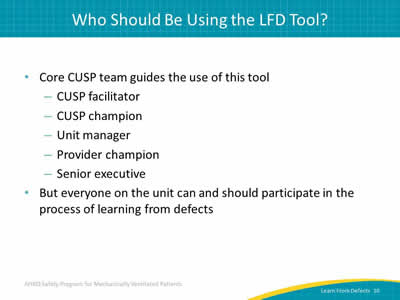
- Core CUSP team guides the use of this tool:
- CUSP facilitator.
- CUSP champion.
- Unit manager.
- Provider champion.
- Senior executive.
- But everyone on the unit can and should participate in the process of learning from defects.
Slide 11: Checking Your Assumptions
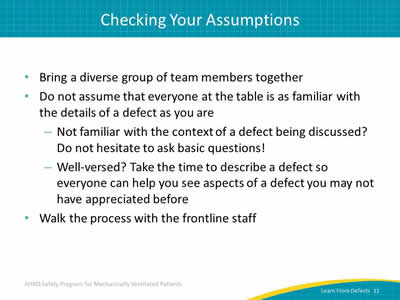
- Bring a diverse group of team members together.
- Do not assume that everyone at the table is as familiar with the details of a defect as you are:
- Not familiar with the context of a defect being discussed? Do not hesitate to ask basic questions!
- Well-versed? Take the time to describe a defect so everyone can help you see aspects of a defect you may not have appreciated before.
- Walk the process with the frontline staff.
Slide 12: What Happened?
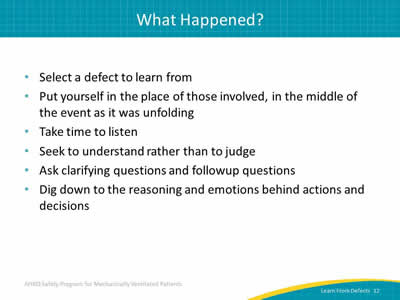
- Select a defect to learn from.
- Put yourself in the place of those involved, in the middle of the event as it was unfolding.
- Take time to listen.
- Seek to understand rather than to judge.
- Ask clarifying questions and followup questions.
- Dig down to the reasoning and emotions behind actions and decisions.
Slide 13: What Happened?
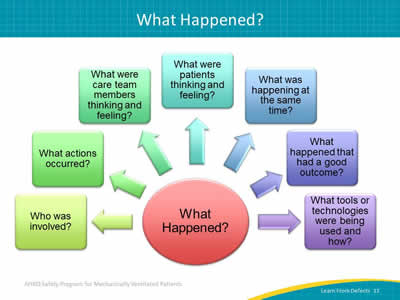
Image: Chart depicting questions to ask to determine What Happened?: Who was involved, what actions occurred, what were care team members thinking and feeling, what were patients thinking and feeling, what was happening at the same time, what happened that had a good outcome, and what tools or technologies were being used and how.
Slide 14: What Happened?
- Reconstruct the timeline and explain what happened.
- Consider recreating to make defect real:
- Visualization tools.
- Process mapping.
- Diagrams or sketches.
- Role playing.
- Remember the "people side" of a defect—including the values, attitudes, and beliefs—in order to create a lasting change.
Slide 15: Why Did It Happen?
- Contributing factors from all levels of your health care system impact care delivery and, ultimately, patient outcomes.
- Develop a "system perspective" to see the hidden factors that led to the event.
- List all contributing factors and identify whether they harmed or protected the patient.
- Isolate how the providers were put into the position to make the mistake in the first place.
- Avoid assigning personal blame.
This process is instrumental in building second-order problem solving skills necessary to learn from defects.
Slide 16: System Factors Impact Safety2
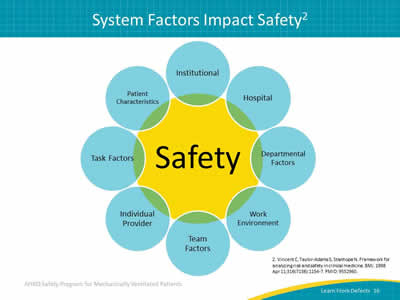
Image: Many system factors impact safety. The slide has "Safety" in a circle in the center, with smaller circles around it listing these factors: institutional, hospital, departmental factors, work environment, team factors, individual provider, task factors, and patient characteristics.
2. Vincent C, Taylor-Adams S, Stanhope N. Framework for analyzing risk and safety in clinical medicine. BMJ 1998 Apr 11;316(7138):1154-7. PMID: 9552960.
Slide 17: LFD Tool Contributing Factors
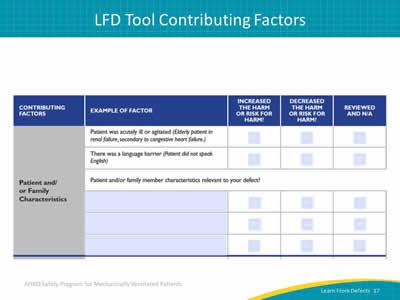
Image: Screen capture of LFD tool highlighting patient and/or family characteristics as contributing factors. The tool user provides relevant family member factors and checks boxes indicating whether each increased harm or risk of harm, decreased it, or was not applicable.
Slide 18: LFD Tool Contributing Factors
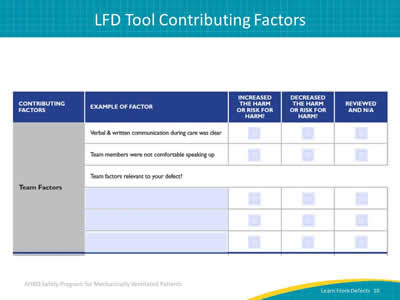
Image: Screen capture of LFD tool highlighting team factors. The tool user provides relevant team factors and checks boxes indicating whether each increased harm or risk of harm, decreased it, or was not applicable.
Slide 19: LFD Tool Contributing Factors
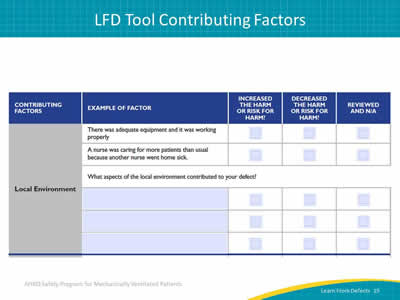
Image: Screen capture of LFD tool highlighting the local environment as contributing factors. The tool user provides relevant environment factors and checks boxes indicating whether each increased harm or risk of harm, decreased it, or was not applicable.
Slide 20: Why Did It Happen?
- Try to go deeper as you identify contributing factors.
- Use the “5 Whys” technique.
- Why 1—Why did this contributing factor occur?
- Why 2—Why did “Why 1” occur?
- Why 3—Why did “Why 2” occur?
- Why 4—Why did “Why 3” occur?
- Why 5—Why did “Why 4” occur?
- Consider having more than one meeting or additional fact-finding to find all contributing factors.
Slide 21: Why Did It Happen?
- Refer back to any drawings your team used to illustrate what happened.
- Look for weaknesses in the processes:
- Are there redundant steps?
- Are there variables that make care inconsistent among providers?
- Evaluate the way your workspaces are designed:
- Is the workflow reasonable?
- Is the workflow efficient?
Slide 22: Why Did It Happen?
- What about the people side of the defect?
- Can you identify where the main points are?
- Are there aspects of your patient safety culture that promote doing the wrong thing or engaging in a risky workaround?
- What might your team do to build a stronger safety culture?
Slide 23: How Will You Reduce Risk Reoccurring?
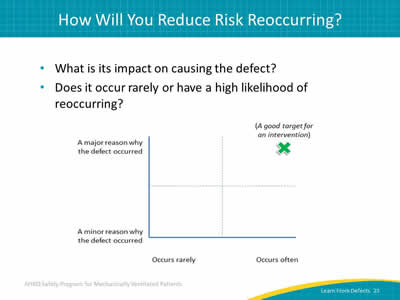
- What is its impact on causing the defect?
- Does it occur rarely or have a high likelihood of reoccurring?
Image: A good target for an intervention is a defect that occurs often and has a major reason for occurring. This point is illustrated by a chart in which the X axis represents how often the defect occurs and the Y axis represents the significance of the reason the defect occurred. The point indicating a good target for an intervention is on the far northeast corner, at the meeting of often occurring and for a major reason.
Slide 24: How Will You Reduce Risk Reoccurring?
Create choices by brainstorming possible interventions
- Involve the entire team with flipcharts and Post-it notes.
- Prioritize most important contributing factors and most beneficial interventions.
- Take advantage of your diverse team!
- Senior executive’s big-picture view of the organization and knowledge of resources.
- Team members’ connections throughout organization.
- Frontline staff with particular insight into the defect.
Slide 25: How Will You Reduce Risk of Reoccurrence?
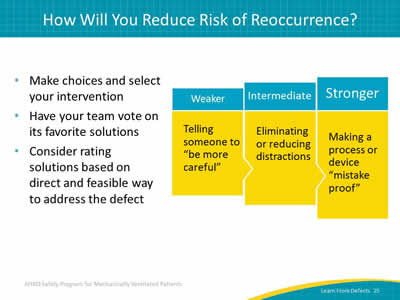
- Make choices and select your intervention.
- Have your team vote on its favorite solutions.
- Consider rating solutions based on direct and feasible way to address the defect.
Image: Rate solutions based on frequency and expected impact from weaker to intermediate to stronger. The chart shows a progression from weaker (telling someone to be more careful) to intermediate (eliminating or reducing distractions) to stronger (making a process or device mistakeproof).
Slide 26: How Will You Reduce Risk of Reoccurrence?
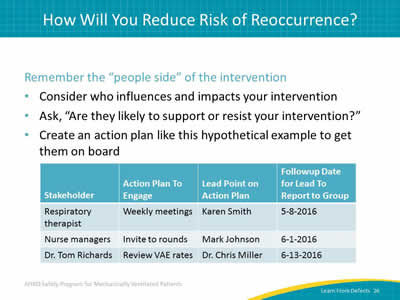
Remember the “people side” of the intervention:
- Consider who influences and impacts your intervention.
- Ask, "Are they likely to support or resist your intervention?"
- Create an action plan like this hypothetical example to get them on board.
Image: Sample action plan to get buy-in for an intervention. The plan lists stakeholders, what action to take to engage that person, the point person on that action, and a followup date for that person to report to the group.
Slide 27: How Will You Reduce Risk of Reoccurrence?
- Remember that engagement is hard!
- Use the wisdom of your diverse team to overcome barriers and solve problems.
- Make sure the intervention details are spelled out and understood by everyone.
- Ensure the intervention is carried out consistently.
Slide 28: How Will You Know Risks Were Reduced?
- Ask:
- Do staff know about the interventions?
- Are staff using the interventions as intended?
- Do staff believe risks were reduced?
- Make data-driven metrics the goal whenever possible.
- Incorporate subjective evaluations for valuable supplementary information.
Slide 29: How Will You Know Risks Were Reduced?
- Identify how you will measure success.
- Put an audit plan in place to track that measure.
- Include a way to feed data back to your group.
- Review your audits and adjust your intervention as needed.
- Revisit learning from defects process.
Tip: Learning from defects is a continuous process as is the need to engage frontline staff.
Slide 30: How Will You Know Risks Were Reduced?
- Evaluate the effectiveness of your intervention by measuring baseline and post-intervention performance.
- Present your findings to leadership and your frontline providers.
Slide 31: Evaluating the Intervention
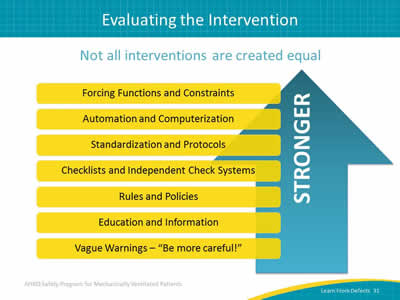
Not all interventions are created equal.
Image: List of interventions from weaker, such as vague warnings, to stronger, such as forcing functions and constraints.
Slide 32: Not All Education Is Created Equal
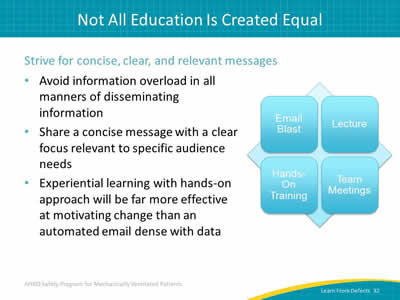
Strive for concise, clear, and relevant messages:
- Avoid information overload in all manners of disseminating information.
- Share a concise message with a clear focus relevant to specific audience needs.
- Experiential learning with hands-on approach will be far more effective at motivating change than an automated email dense with data.
Image: Some ways to convey message are through email blast, lecture, hands-on training, and team meetings.
Slide 33: Action Plan
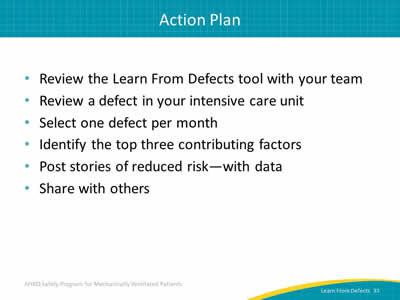
- Review the Learn From Defects tool with your team.
- Review a defect in your intensive care unit.
- Select one defect per month.
- Identify the top three contributing factors.
- Post stories of reduced risk—with data.
- Share with others.
Slide 34: Questions

Image: Picture of hanging colored tags with question marks on them.
Slide 35: References
1. Pronovost PJ, Holzmueller CG, et al. A practical tool to learn from defects in patient care. Jt Comm J Qual Patient Saf 2006 Feb;32(2):102-8. PMID: 16568924.
2. Vincent C, Taylor-Adams S, Stanhope N. Framework for analyzing risk and safety in clinical medicine. BMJ 1998 Apr 11;316(7138):1154-7. PMID: 9552960.


