Communication Strategies for Sustainability: Slide Presentation
AHRQ Safety Program for Mechanically Ventilated Patients
Slide 1: AHRQ Safety Program for Mechanically Ventilated Patients
Communication Strategies for Sustainability
Slide 2: Learning Objectives
After reviewing this module, you will be able to–
- Identify your target audience.
- Overcome the curse of knowledge.
- Articulate the goal of your message.
- Apply practical strategies to improve the effectiveness of team communications.
Slide 3: AHRQ Safety Program For Mechanically Ventilated Patients
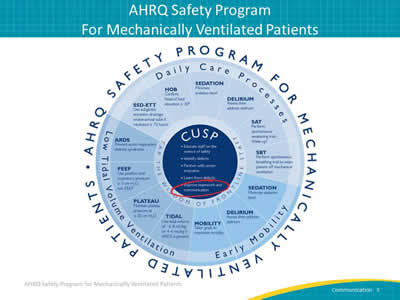
Image: A wheel (Labeled on outside "AHRQ Safety Program for Mechanically Ventilated Patients") illustrates the following:
In the center circle: CUSP, (surrounded by "Tap the wisdom of frontline staff") with list:
- Educate staff on the science of safety.
- Identify defects.
- Partner with senior executive.
- Learn from defects.
- Improve teamwork and communication.
Outside circle:
Daily Care Processes—
- SSD-ETT: Use subglottic secretion drainage endotracheal tubes if intubated ≥ 72 hours.
- HOB: Confirm head of bead elevation ≥ 30°.
- SEDATION: Minimize sedation level.
- DELIRIUM: Assess then address delirium.
- SAT: Perform spontaneous awakening trial—Wake up!.
- SBT: Perform spontaneous breathing trial to wean patient off mechanical ventilation.
Early Mobility—
- SEDATION: Minimize sedation level.
- DELIRIUM: Assess then address delirium.
- MOBILITY: Tailor goals to maximize mobility.
Low Tidal Volume Ventilation—
- ARDS: Prevent acute respiratory distress syndrome.
- PEEP: Use positive end-expiratory pressure of ≥ 5 cm H2O.
- PLATEAU: Maintain plateau pressure at ≤ 30 cm H2O.
- TIDAL: Use tidal volume of 6–8 mL/kg and 4–6 if ARDS present.
Slide 4: Using Communication Strategies
Address barriers to sustainability:
- Competing priorities.
- Staff buy-in of initial intervention.
- Staff engagement.
- Consistency of implementation.
Slide 5: Sustaining Your Efforts
- CUSP fosters–
- Communication within multidisciplinary teams.
- Frontline engagement.
- Communication is a two-way street:
- Staff must have a voice.
- Voice must be heard by organization.
- Use communication strategies to sustain your implementation efforts.
Slide 6: Your Target Audience
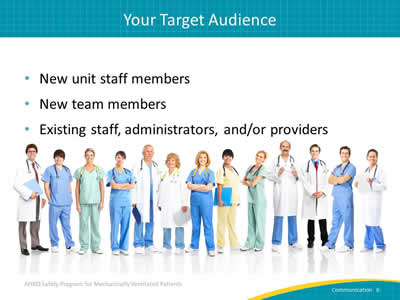
- New unit staff members.
- New team members.
- Existing staff, administrators, and/or providers.
Image: Diverse group of health care providers in scrubs or white coats.
Slide 7: Your Target Audience
What does your audience–
- Want to know?
- Need to know?
- Need to do?
What do you want to accomplish?
- Change behavior.
- Garner buy-in.
- Provide status update.
- Ask for resources.
Slide 8: What Does Your Audience Know?
Image: Dog with head tilted to the viewer’s right. Inquisitive pose.
Slide 9: Curse of Knowledge
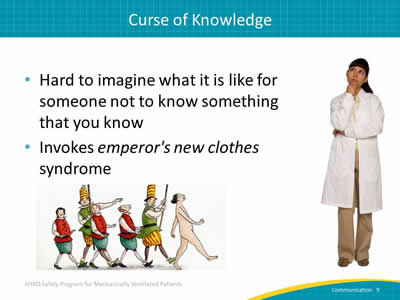
- Hard to imagine what it is like for someone not to know something that you know.
- Invokes emperor's new clothes syndrome.
Images: Animated image of naked emperor followed by court men. Young female physician standing with her left arm crossing her body and her right fist under her chin, looking up in a questioning manner.
Slide 10: Curse of Knowledge
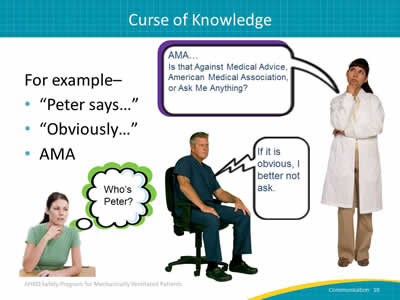
For example–
- "Peter says…"
- "Obviously…"
- AMA.
Images: Seated woman with speech bubble that reads, "Who's Peter?" Man seated in rolling office chair with speech bubble that reads, "If it is obvious, I better not ask." Questioning physician with speech bubble that reads, "AMA...Is that against medical advice, American Medical Association, or Ask Me Anything?"
Slide 11: Overcoming the Curse of Knowledge
- Find out what they know and what they need to know.
- Close the loop:
- Get feedback from member of target audience.
- Share draft.
- Ask them!
- Make it easy for your audience to understand your message.
Slide 12: Overcoming the Curse of Knowledge
- Use concrete language.
- Tell a story.
- Spell out logic.
- Explain acronyms and jargon.
- Supply any necessary details.
- Include background or context.
Slide 13: Communicating With Your Team
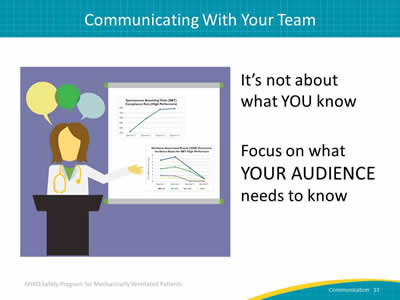
It’s not about what YOU know.
Focus on what YOUR AUDIENCE needs to know.
Image: Illustrated female physician with screen displaying data graphs.
Slide 14: What Do You Want To Accomplish?
Change Behavior:
- Information can motivate change but emotion helps propel it.
- Show, don’t tell:
- Share stories or photos.
- Direct attention to the destination.
- Cultivate a sense of identity around change.
- Encourage habits and make new behavior contagious.
- Share your data.
Slide 15: What Do You Want To Accomplish?
Garner Buy-In:
- Prepare multipronged approach for approval.
- Target individual stakeholders:
- Identify respected members of team.
- Solicit feedback early.
- Address the wisdom of naysayers:
- Find the kernel of truth in their doubts.
- Take that truth seriously.
- Advocate for grassroots approach rather than lightning bolt approach.
- Share your data.
Slide 16: What Do You Want To Accomplish?
Provide Status Update:
- Frame background information.
- Tailor update to audience:
- Adapt for unit, interdepartmental, management, hospitalwide, or external audiences.
- Be mindful of different goals and knowledge base.
- Identify key actions or upcoming decisions.
- Link to organizational goals.
- Share your data.
Slide 17: What Do You Want To Accomplish?
Ask for Resources:
- Be specific and clear with your requests.
- Be prepared with evidence to support requests.
- Share your data.
- Anticipate obstacles and solutions.
- Provide alternatives, where possible.
- Offer a reasonable timeframe to address concerns.
Find evidence to support interventions on the program Web site at http://www.ahrq.gov/HAImvp.
Slide 18: If I had more time...
If I had more time, I would have written a shorter letter.
And added my data.
Slide 19: Practical Tips
- Identify your audience:
- What do they want to know?
- What do they need to know?
- What do they need to do?
- Determine what you want to accomplish.
- Overcome the curse of knowledge.
- Focus on the audience–it’s not about you.
- Be concise and be clear.
- Share your data.
Slide 20: Sample Generated Report
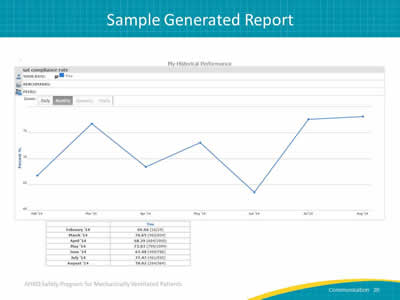
Image: Graph labeled "My Historical Performance" with a subtitle of "SAT compliance rate." Written below are: Your rate, Benchmark and Peers. X axis shows dates from Feb ’14 to Aug ’14 and y axis shows percentages. Chart below the graph consists of 2 columns. Column on the left has a list of dates ranging from February ’14 to August ’14 and the column on right has heading of "You" with a list of percentages below.
Slide 21: Monthly SAT Compliance Rate
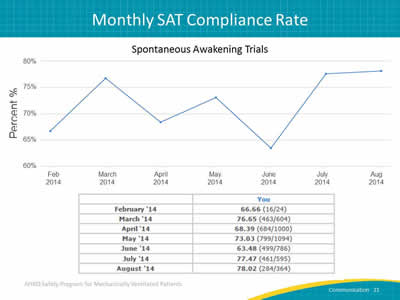
Image: Graph depicting percentages of spontaneous awakening trials from Feb 2014 to August 2014. X axis shows dates from Feb ’14 to Aug ’14 and y axis shows percentages from 60% to 80%. 2 column chart below the graph. Column on the left has a list of dates ranging from February ’14 to August ’14 and the column on right has heading of "You" with a list of percentages below.
Slide 22: Monthly SAT Compliance Rate
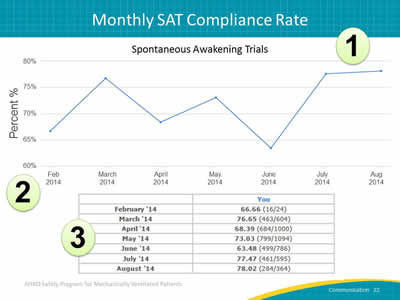
Image: Graph at top labeled "Spontaneous Awakening Trials" has a bold circled number 1 in the top right hand quadrant, a bold circled number 2 in the bottom left corner and a bold circled number 3 in the 2 column chart below the graph. X axis shows dates from Feb ’14 to Aug ’14 and y axis shows percentages from 60% to 80%. The 2 column chart has a list of dates ranging from February ’14 to August ’14 and the column on right has heading of "You" with a list of percentages below.
Slide 23: As SBT Compliance Rises, VAE Rates Plummet
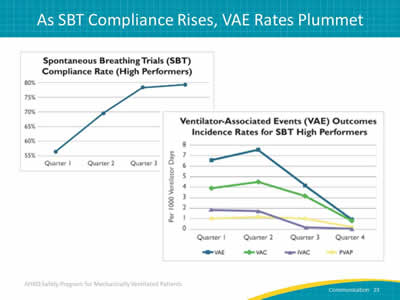
Images: Two graphs are shown. The top graph is titled "Spontaneous Breathing Trials (SBT) Compliance Rate (High Performers)". The x axis has Quarter 1, Quarter 2 and Quarter 3. The y axis has percentages from 55% at the bottom to 80% at the top. The bottom graph is titled "Ventilator-Associated Events (VAE) Outcomes Incidence Rates for SBT High Performers" shows Quarter 1,2,3 and 4 on the x axis. The y axis is labeled 1,000 Ventilator Days with days ranging from 0 to 8.
Slide 24: Questions?
Image: A series of colored hanging tags with question marks on them.


