Learning From Defects Through Sensemaking: Slide Presentation
AHRQ Safety Program for Surgery
Slide 1: AHRQ Safety Program for Surgery—Implementation
Learning From Defects through Sensemaking
Slide 2: Learning Objectives
- Describe difference between first-order and second-order problem-solving.
- List contributing factors that make defects in care more likely to occur.
- Use the Learning From Defects (LFD) tool to perform second-order problem-solving.
Slide 3: Principles of Safe Design
- Patient safety is a property of systems.
- Apply principles to both technical tasks and adaptive teamwork.
- Teams make wise decisions when input is diverse, independent, and encouraged.
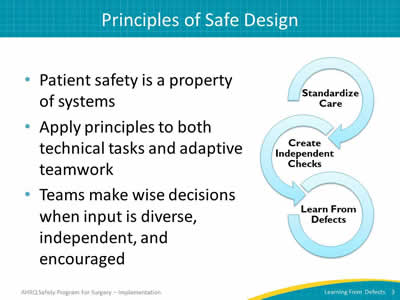
Image: The Science of Safety. Interlocking circles labeled with the three steps of the science of safety
- Standardize care.
- Create independent checks.
- Learn from defects.
Slide 4: Problem-Solving Hierarchy
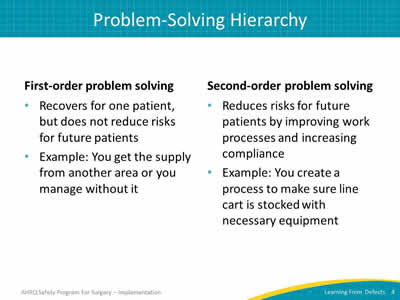
First-order problem solving
- Recovers for one patient, but does not reduce risks for future patients.
- Example: You get the supply from another area or you manage without it.
Second-order problem solving
- Reduces risks for future patients by improving work processes and increasing compliance.
- Example: You create a process to make sure the line cart is stocked with necessary equipment.
Slide 5: Problem-Solving Goal
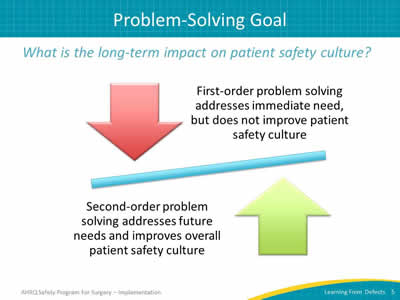
What is the long-term impact on patient safety culture?
Image: See-saw presentation of arrows pointing towards the balancing line. Red arrow pointing down is captioned "First-order problem-solving addresses immediate need, but does not improve patient safety culture." Green arrow pointing up is captioned "Second-order problem-solving addresses future needs and improves overall patient safety culture."
Slide 6: What Is a Defect?

Anything you do not want to happen again.
Image: Man wearing jeans and orange/black striped t-shirt sitting with hands raised to chin height with fingers outstretched in a questioning manner.
Slide 7: Individual Mistake or System Failing?
“Rather than being the main instigators of an accident, operators tend to be the inheritors of SYSTEM defects. . . . Their part is that of adding the final garnish to a lethal brew that has been long in the cooking.”
—James Reason, Human Error, 19901
Slide 8: Source of Defects
- Adverse event reporting systems.
- Sentinel events.
- Claims data.
- Infection rates.
- Complications.
- Perioperative Staff Safety Assessments:
- How will the next patient be harmed?
- What can you do to prevent or minimize this harm?
Slide 9: Learning From Defects
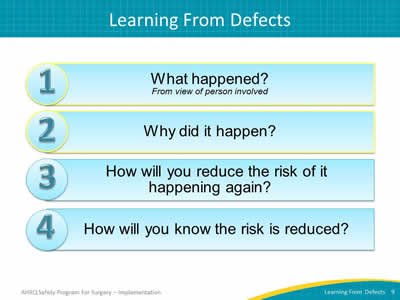
Image: Four numbered blue boxes list the Learning From Defects questions:
- What happened? (From view of person involved)
- Why did it happen?
- How will you reduce the risk of it happening again?
- How will you know the risk is reduced?
Questions 1 & 2 are highlighted.
Slide 10: Who Should Use the LFD Tool?
- Core CUSP team guides the process with LFD tool:
- CUSP Facilitator.
- CUSP Champion.
- Unit Manager.
- Provider Champion.
- Senior Executive.
- But everyone on the unit can and should participate in the process of learning from defects.
Slide 11: Check Your Assumptions
- CUSP brings a diverse group of team members together.
- Don’t assume that everyone at the table is as familiar with the details of defect as you are:
- Not familiar with the context of a defect being discussed? Don’t hesitate to ask basic questions!
- Well-versed? Take the time to describe the defect so everyone can help you see aspects of the defect you may not have appreciated before.
- Walk the process with the frontline staff.
Slide 12: What Happened?
- Select a defect to explore.
- Put yourself in the place of those involved, in the middle of the event as it was unfolding.
- Take time to listen.
- Seek to understand rather than to judge.
- Ask clarifying and followup questions.
- Dig down to the reasoning and emotions behind actions and decisions.
Slide 13: What Happened?
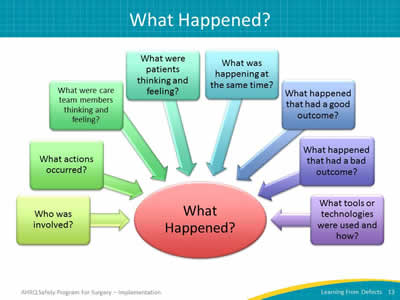
Image: Questions to ask to learn what happened. Questions are in color boxes with arrows pointing to a large circle in the center that reads, "What Happened?"
- Who was involved?
- What actions occurred?
- What were care team members thinking and feeling?
- What were patients thinking and feeling?
- What was happening at the same time?
- What happened that had a good outcome?
- What happened that had a bad outcome?
- What tools or technologies were used and how?
Slide 14: What Happened?
- Reconstruct the timeline and explain what happened.
- Consider recreating to make defect real:
- Visualization tools.
- Process mapping.
- Role playing.
- Diagrams or sketches.
- To create a lasting change, remember the “people side” of a defect, including the values, attitudes, and beliefs.
Slide 15: Why Did It Happen?
- Contributing factors from all levels of your health care system impact care delivery and, ultimately, patient outcomes.
- Develop a “system perspective” to see the hidden factors that led to the event.
- List all contributing factors and identify whether they harmed or protected the patient.
- This process is instrumental in building second-order problem-solving skills necessary to learn from defects.
Slide 16: Why Did It Happen?
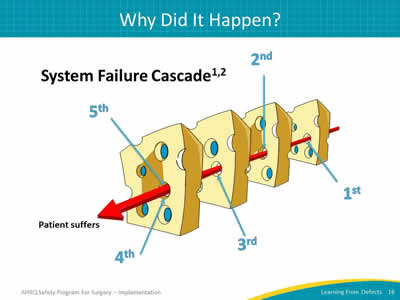
System Failure Cascade1,2
Image: Four slices of Swiss cheese presented with a red arrow lining up through a hole in each slice. Each hole represents a system failure; together the holes ultimately allow a patient to suffer.
Adapted from Reason J. Human Error. Cambridge, England: Cambridge University Press, 2000. and Pronovost PJ, Wu Aw, Sexton JB. Acute decompensation after removing a central line: practical approaches to increasing safety in the intensive care unit. Ann Intern Med 2004; 140(12):1025-33. PMID: 15197020.
Slide 17: System Factors Impact Safety3
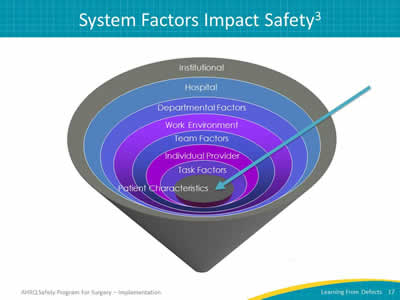
Image: Funnel of factors that impact patient safety:
- Institutional.
- Hospital.
- Departmental factors.
- Work environment.
- Team factors.
- Individual provider.
- Task factors.
- Patient characteristics.
Adapted from Vincent C, Taylor-Adams S, Stanhope N. Framework for Analyzing Risk and Safety in Clinical Medicine. BMJ 1998; 316:1154-7. PMID: 9552960.
Slide 18: LFD Tool Contributing Factors
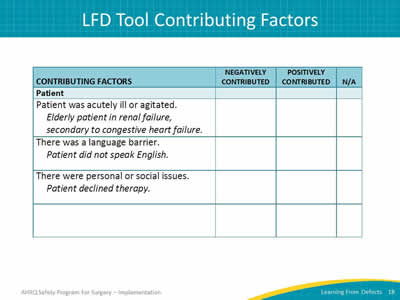
Image: Table lists Questions for the Patient and Family Characteristics contributing factor of the LFD tool. Examples: patient acutely ill, agitated, or impacted by language barrier. Opportunity to identify if factor increased or decreased the harm or risk for harm, as well as if factor was reviewed.
Slide 19: LFD Tool Contributing Factors
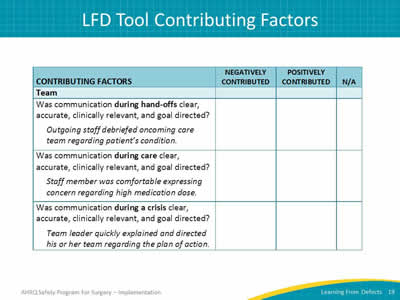
Image: Table lists Questions for the Team contributing factor of the LFD tool. Examples: verbal and written instructions clear, team members comfortable speaking up. Opportunity to identify if factor increased or decreased the harm or risk for harm, as well as if factor was reviewed.
Slide 20: LFD Tool Contributing Factors
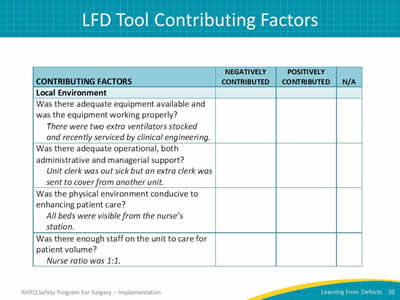
Image: Table lists Questions for the Local Environment contributing factor of the LFD tool. Examples: adequate equipment in good working order, nurse patient load due to staffing shortage. Opportunity to identify if factor increased or decreased the harm or risk for harm, as well as if factor was reviewed.
Slide 21: Why Did It Happen?
- As you identify contributing factors, try to go deeper.
- The “5 Why’s” technique can help:
- Why 1: Why did this contributing factor occur?
- Why 2: Why did the answer to “Why 1” occur?
- Why 3: Why did the answer to “Why 2” occur?
- Why 4: Why did the answer to “Why 3” occur?
- Why 5: Why did the answer to “Why 4” occur?
- It may take more than one meeting and additional fact-finding to find all contributing factors.
Slide 22: Why Did It Happen?
- If your team used a drawing to illustrate what happened, consider revisiting it.
- Look for weaknesses in the processes:
- Are there redundant steps?
- Are there variables that make care inconsistent among providers?
- Evaluate the way your workspaces are designed:
- Is the workflow reasonable?
- Is the workflow efficient?
Slide 23: Why Did It Happen?
- What about the people side of the defect?
- Can you identify where the pain points are?
- Are there aspects of your patient safety culture that promote doing the wrong thing or engaging in a risky workaround?
- What might your team do to build a stronger safety culture?
Slide 24: AHRQ Safety Program for Surgery—Implementation
Communicating for Patient Safety
Case Study: Renal Transplant
Slide 25: Case Study: Renal Transplant
Setting the stage
- Who: An ICU patient bleeding after renal transplant.
- What: Needs emergency surgery to correct.
- When: Early morning 0530.
- Where: Taken to operating room (OR) by anesthesiology team.
- And: Nurse hands over chart with Kardex stamp plate as patient leaves intensive care unit (ICU).
What happened next?
- In OR: Patient unstable on arrival to OR at 0600, necessitating additional lines.
- In OR: Patient stabilized and surgery begins.
Slide 26: Case Study: Renal Transplant
- Attending anesthesiologist called to an emergent neurosurgical case for craniotomy.
- Attending leaves renal transplant case, returns at 0730.
- Meanwhile, nursing and OR tech staff turns over at 0700.
- Anesthesiology resident who started the case has already signed out to the day shift resident who has taken over.
- Attending notes that a transfusion has started, and that the unit of blood has the wrong patient’s name.
- Attending immediately stops the transfusion, reporting error to the OR staff and blood bank.
Slide 27: Case Study: Renal Transplant
- Resident used the stamp plate to order and then check the blood.
- However, the wrong chart was sent with the patient from the ICU.
- Chart was never checked against the wrist band.
- All of the OR documents stamped with the name from the incorrect chart.
- Ultimately, the patient dies, though transfusion not the cause as the donor blood was type O.
Slide 28: Case Study: Renal Transplant
- What happened?
- Why did it happen?
- How will you reduce the risk of the defect happening again?
- How will you know the risk is reduced?
Slide 29: Case Study: Renal Transplant
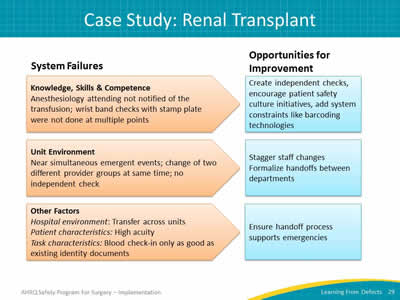
Image: Renal Transplant Case: System Failures and Opportunities for Improvement. System failures are listed in orange shapes that point toward blue boxes of opportunities for improvement.
Knowledge, Skills & Competence
Anesthesiology attending not notified of the transfusion; wrist band checks with stamp plate were not done at multiple points.
Opportunities for improvement: Create independent checks, encourage patient safety culture initiatives, add system constraints like barcoding technologies.
Unit Environment
Near simultaneous emergent events; change of two different provider groups at same time; no independent check.
Opportunities for improvement: Stagger staff changes, formalize hand-offs between departments.
Other Factors
Hospital environment: Transfer across units.
Patient characteristics: High acuity.
Task characteristics: Blood check-in only as good as existing identity documents.
Opportunities for improvement: Ensure hand-off process supports emergencies.
Slide 30: Action Plan
- Review the Learning From Defects tool with your team.
- Review the defects in your operating rooms.
- Select a defect.
- Identify the top three contributing factors.
- Share those factors with your staff.
Slide 31: AHRQ Safety Program for Surgery—Implementation
Learning From Defects Through Sensemaking II
Slide 32: Learning Objectives
- Use the LFD tool to perform second-order problem-solving.
- Create an action plan to address prioritized contributing factors.
- Evaluate the effectiveness of your intervention by measuring baseline and post-intervention performance.
- Present your findings to surgical department leadership.
Slide 33: Learning From Defects
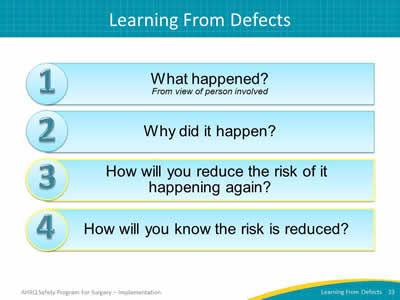
Image: Four numbered blue boxes list the Learning From Defects questions:
- What happened? (From view of person involved)
- Why did it happen?
- How will you reduce the risk of it happening again?
- How will you know the risk is reduced?
Questions 3 & 4 are highlighted.
Slide 34: Case Study: Renal Transplant
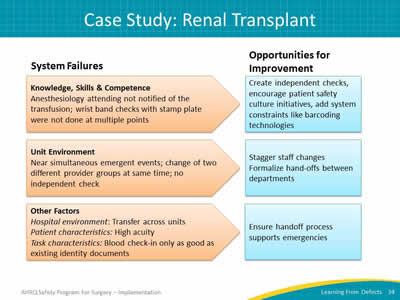
Image: Renal Transplant Case: System Failures and Opportunities for Improvement. System failures are listed in orange shapes that point toward blue boxes of opportunities for improvement.
Knowledge, Skills & Competence
Anesthesiology attending not notified of the transfusion; wrist band checks with stamp plate were not done at multiple points.
Opportunities for improvement: Create independent checks, encourage patient safety culture initiatives, add system constraints like barcoding technologies.
Unit Environment
Near simultaneous emergent events; change of two different provider groups at same time; no independent check.
Opportunities for improvement: Stagger staff changes, formalize hand-offs between departments.
Other Factors
Hospital environment: Transfer across units.
Patient characteristics: High acuity.
Task characteristics: Blood check-in only as good as existing identity documents.
Opportunities for improvement: Ensure hand-off process supports emergencies.
Slide 35: How Will You Reduce Risk of It Happening Again?
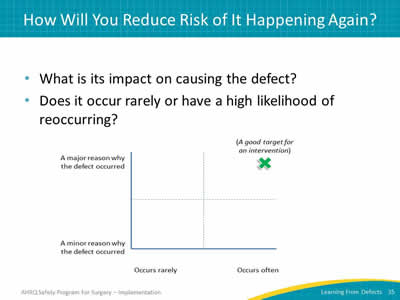
- What is its impact on causing the defect?
- Does it occur rarely or have a high likelihood of reoccurring?
Image: Grid broken into four sections on an x- and y-axis. X-axis begins with "occurs rarely" and moves to "occurs often." Y-axis begins with "minor reason why defect occurred" and moves to "major reason why defect occurred." Good target for intervention is marked in the far upper quadrant ("occurs often" and "major reason why defect occurs").
Slide 36: How Will You Reduce Risk of It Happening Again?
- Involve the entire team with flipcharts and sticky notes.
- Prioritize most important contributing factors and most beneficial interventions.
- Take advantage of your diverse team!
- Senior executive’s big-picture view of the organization and knowledge of resources.
- Team members’ connections throughout organization.
- Frontline staff with particular insight into the defect.
Slide 37: How Will You Reduce Risk of It Happening Again?
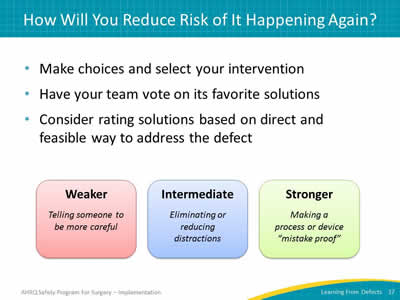
- Make choices and select your intervention.
- Have your team vote on its favorite solutions.
- Consider rating solutions based on direct and feasible way to address the defect.
Image: Three boxes containing text (from left to right):
- Weaker (in red box): Telling someone to be more careful.
- Intermediate (in blue box): Eliminating or reducing distractions.
- Stronger (in green box): Making a process or device "mistake proof."
Slide 38: Building Resiliency Into Interventions
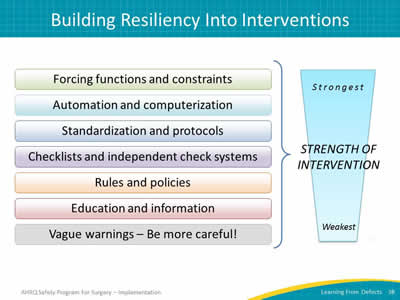
Image: Chart captioned "Strength of Interventions" showing ranked list of interventions with the strongest options at the top and the weakest interventions at the bottom:
- Forcing functions and constraints.
- Automation and computerization.
- Standardization and protocols.
- Checklists and independent check systems.
- Rules and policies.
- Education and information.
- Vague warnings—Be more careful!
Slide 39: Not All Education Is Created Equal
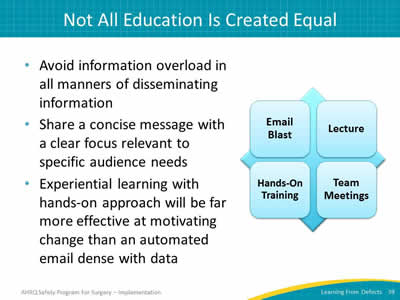
- Avoid information overload in all manners of disseminating information.
- Share a concise message with a clear focus relevant to specific audience needs.
- Experiential learning with hands-on approach will be far more effective at motivating change than an automated email dense with data.
Image: Grid showing four education examples:
- Email blast.
- Lecture.
- Hands-on training.
- Team meetings.
Slide 40: How Will You Reduce Risk of It Happening Again?
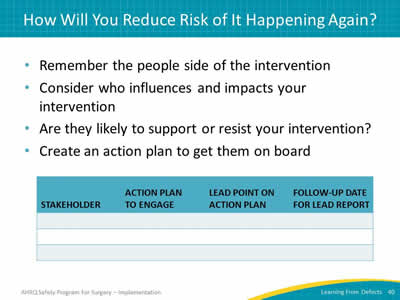
- Remember the people side of the intervention.
- Consider who influences and impacts your intervention.
- Are they likely to support or resist your intervention?
- Create an action plan to get them on board.
Image: LFD Tool Step 3. Table with lines to record:
- Stakeholder.
- Action plan to engage.
- Lead point on action plan.
- Follow-up date.
Slide 41: How Will You Reduce Risk of It Happening Again?
- Engagement is hard!
- Use the wisdom of your diverse team to overcome barriers and solve problems.
- Make sure the intervention details are spelled out and understood by everyone.
- Ensure the intervention is carried out consistently.
Slide 42: How Will You Reduce Risk of It Happening Again?
- Do staff members know about the interventions?
- Are staff members using the interventions as intended?
- Do staff members believe risks were reduced?
- Subjective evaluations can provide valuable information.
- Data-driven metrics should be the goal whenever possible.
Slide 43: How Will You Know Risks Were Reduced?
- Identify how you will measure success.
- Put an audit plan in place to track that measure.
- Include a way to feed data back to your group.
- Review your audits and adjust your intervention as needed.
- Revisit Learning From Defects process as needed.
Tip: Learning from defects is a continuous process, as is the need to engage frontline staff.
Slide 44: How Will You Know Risks Were Reduced?
- Evaluate the effectiveness of your intervention by measuring baseline and post-intervention performance.
- Present your findings to surgical department leadership.
Slide 45: How Will You Know Risks Were Reduced?
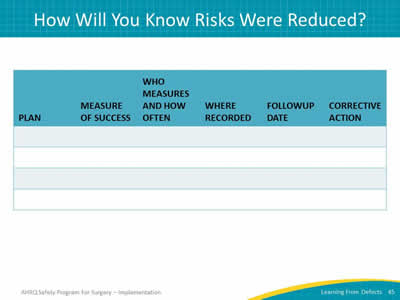
Image. LFD Tool Step 4. Table with lines to record the following details:
- Plan.
- Measure of success.
- Who measures and how often.
- Where recorded.
- Follow-up date.
- Corrective action.
Slide 46: Ongoing Key Questions
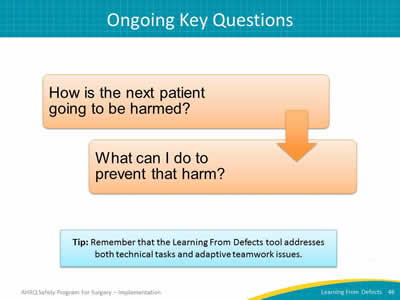
Image: Two orange boxes read: "How is the next patient going to be harmed?" Arrow points down to the next box: "What can I do to prevent that harm?"
Tip: Remember that the Learning From Defects tool addresses both technical tasks and adaptive teamwork issues.
Slide 47: Action Plan
- Review the Learning From Defects tool with your team.
- Review one defect in your operating rooms.
- Select a defect each month or quarter.
- Consider using in surgical morbidity and mortality conferences.
- Post the stories of reduced risks (with data!).
- Share with others.
Slide 48: References
- Reason, James. Human error. Cambridge university press, 1990.
- Pronovost PJ, Wu Aw, Sexton JB. Acute decompensation after removing a central line: practical approaches to increasing safety in the intensive care unit. Ann Intern Med 2004;140(12):1025-33. PMID: 15197020.
- Vincent C, Taylor-Adams S, Stanhope N. Framework for Analyzing Risk and Safety in Clinical Medicine. BMJ 1998;316:1154-7. PMID: 9552960.
Slide 49: Additional References
Bagian JP, Lee C, Gosbee J, et al. Developing and deploying a patient safety program in a large health care delivery system: you can't fix what you don't know about. Jt Comm J Qual Improv 2001;27:522-32. PMID: 11593886.
Pronovost PJ, Holzmueller CG, Martinez E, et al. A practical tool to learn from defects in patient care. Jt Comm J Qual Patient Saf 2006;32(2):102-108. PMID: 16568924.
Wu AW, Lipshutz AK, Pronovost PJ. The effectiveness and efficiency of root cause analysis. JAMA 2008;299:685-87. PMID: 18270357.


