Background
This Chartbook on Access to Health Care is part of a family of documents and tools that support the National Healthcare Quality and Disparities Report (QDR). The QDR includes annual reports to Congress mandated in the Healthcare Research and Quality Act of 1999 (P.L. 106-129). These reports provide a comprehensive overview of the quality of health care received by the general U.S. population and disparities in care experienced by different racial, ethnic, and socioeconomic groups. The purpose of the reports is to assess the performance of our health system and to identify areas of strengths and weaknesses in the health care system along three main axes: access to health care, quality of health care, and priorities of the National Quality Strategy.
The reports are based on more than 250 measures of quality and disparities covering a broad array of health care services and settings. Data are generally available through 2013, although rates of uninsurance have been tracked through the September 2015. The reports are produced with the help of an Interagency Work Group led by the Agency for Healthcare Research and Quality (AHRQ) and submitted on behalf of the Secretary of Health and Human Services (HHS).
Chartbook Contents
This chartbook includes:
- Summary of disparities across measures of access to health care from the QDR.
- Figures illustrating select measures of access.
Introduction and Methods contains information about methods used in the chartbook. A Data Query tool (http://nhqrnet.ahrq.gov/inhqrdr/data/query) provides access to all data tables.
Disparities in Access to Care
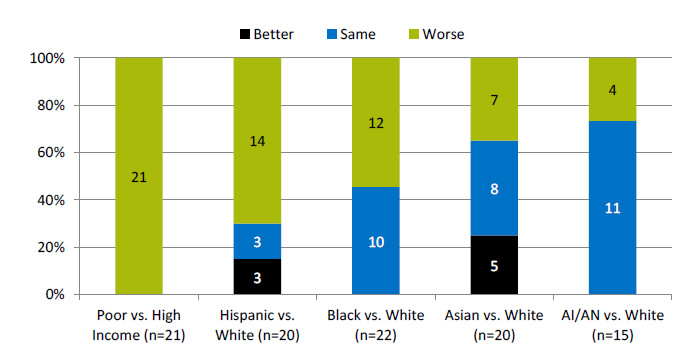
Number and percentage of access measures for which members of selected groups experienced better, same, or worse access to care compared with reference group

| Poor vs. High Income (n=21) |
Hispanic vs. White (n=20) |
Black vs. White (n=22) |
Asian vs. White (n=20) |
AI/AN vs. White (n=15) |
|
|---|---|---|---|---|---|
| Better | 3 | 5 | |||
| Same | 0 | 3 | 10 | 8 | 11 |
| Worse | 21 | 14 | 12 | 7 | 4 |
Key: AI/AN = American Indian or Alaska Native; n = number of measures.
Note: Poor indicates family income less than the Federal poverty level; High Income indicates family income four times the Federal poverty level or greater. Numbers of measures differ across groups because of sample size limitations. For most measures, data from 2013 are shown. The relative difference between a selected group and its reference group is used to assess disparities.
- Better = Selected group had better access to care than reference group. Differences are statistically significant, are equal to or larger than 10%, and favor the selected group.
- Same = Selected group and reference group had about the same access to care. Differences are not statistically significant or are smaller than 10%.
- Worse = Selected group had worse access to care than reference group. Differences are statistically significant, are equal to or larger than 10%, and favor the reference group.
- Groups With Disparities:
- People in poor households had worse access to care than people in high-income households on all access measures (green).
- Hispanics had worse access to care than Whites for more than two-thirds of access measures.
- Blacks had worse access to care than Whites for about half of access measures.
- Asians had worse access to care than Whites for about one-third of access measures, and American Indians and Alaska Natives had worse access to care than Whites for about one-quarter of access measures.


