Timeliness
- Timeliness in health care is the system’s capacity to provide care quickly after a need is recognized. (Healthy People 2020).
- Timely delivery of appropriate care can help reduce mortality and morbidity for chronic conditions, such as kidney disease (Smart & Titus, 2011).
Measures of Timeliness
- Adults who needed care right away for an illness, injury, or condition in the last 12 months who sometimes or never got care as soon as wanted
- Children who needed care right away for an illness, injury, or condition in the last 12 months who sometimes or never got care as soon as wanted
Adults’ Ability To Get Care As Soon As Wanted
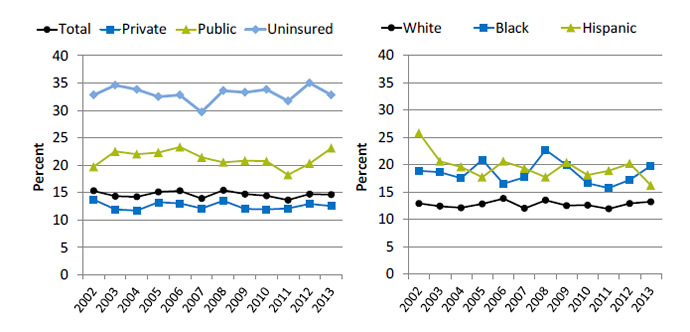
Adults who needed care right away for an illness, injury, or condition in the last 12 months who sometimes or never got care as soon as wanted, by insurance (ages 18-64) and race/ethnicity, 2002-2013

Left Chart:
| Insurance | 2002 | 2003 | 2004 | 2005 | 2006 | 2007 | 2008 | 2009 | 2010 | 2011 | 2012 | 2013 |
|---|---|---|---|---|---|---|---|---|---|---|---|---|
| Total | 15.3 | 14.3 | 14.2 | 15.1 | 15.3 | 13.9 | 15.4 | 14.7 | 14.4 | 13.6 | 14.7 | 14.6 |
| Private | 13.7 | 11.9 | 11.7 | 13.2 | 13 | 12.1 | 13.5 | 12 | 11.9 | 12.1 | 12.9 | 12.5 |
| Public | 19.7 | 22.5 | 22 | 22.3 | 23.3 | 21.4 | 20.5 | 20.8 | 20.7 | 18.2 | 20.3 | 23.1 |
| Uninsured | 32.8 | 34.6 | 33.8 | 32.5 | 32.8 | 29.7 | 33.6 | 33.3 | 33.8 | 31.7 | 35 | 32.8 |
Right Chart:
| Race/Ethnicity | 2002 | 2003 | 2004 | 2005 | 2006 | 2007 | 2008 | 2009 | 2010 | 2011 | 2012 | 2013 |
|---|---|---|---|---|---|---|---|---|---|---|---|---|
| White | 12.9 | 12.4 | 12.1 | 12.8 | 13.8 | 12 | 13.5 | 12.5 | 12.6 | 11.9 | 12.9 | 13.2 |
| Black | 18.9 | 18.6 | 17.5 | 20.9 | 16.5 | 17.7 | 22.7 | 19.9 | 16.6 | 15.7 | 17.2 | 19.8 |
| Hispanic | 25.8 | 20.6 | 19.6 | 17.7 | 20.6 | 19.3 | 17.7 | 20.4 | 18.1 | 18.9 | 20.2 | 16.2 |
Source: Agency for Healthcare Research and Quality, Medical Expenditure Panel Survey, 2002-2013.
Note: For this measure, lower rates are better. White and Black are non-Hispanic. Hispanic includes all races.
- Overall Rate: In 2013, the overall percentage of adults who needed care right away who sometimes or never got care as soon as wanted was 14.6%.
- Trends:
- From 2002 to 2013, there were no statistically significant changes by insurance in the percentage of adults who needed care right away who sometimes or never got care as soon as wanted. In 2013, the percentages were 32.8% for uninsured people, 23.1% for those with public insurance, and 12.5% for those with private insurance.
- From 2002 to 2013, there were no statistically significant changes among Whites or Blacks in the percentage of adults who needed care right away who sometimes or never got care as soon as wanted. In 2013, the percentage was 19.8% for Blacks and 13.2% for Whites.
- From 2002 to 2013, the percentage of adults who needed care right away who sometimes or never got care as soon as wanted was improving for Hispanic people (from 25.8% to 16.2%).
- Groups With Disparities:
- In most years, the percentage of adults who needed care right away who sometimes or never got care as soon as wanted was higher for adults who had public insurance compared with adults with private insurance.
- In all years, uninsured adults were less likely than adults with private insurance to receive needed care right away for an illness, injury, or condition.
- Although there were no statistically significant changes from 2010 to 2013, by the end of that period, Hispanics were more likely than Whites to receive care as soon as wanted.
Children’s Ability To Get Care As Soon As Wanted
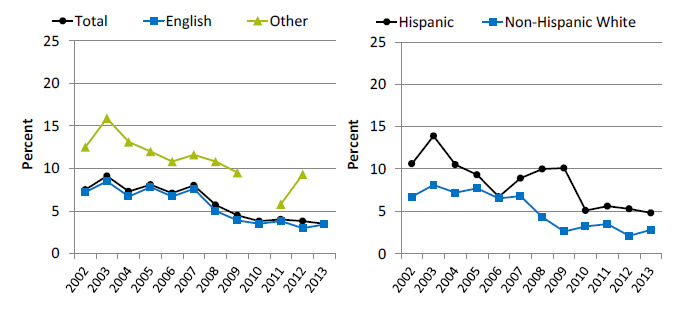
Children who needed care right away for an illness, injury, or condition in the last 12 months who sometimes or never got care as soon as wanted, by preferred language and ethnicity, 2002-2013

Left Chart:
| Year | Total | English | Other |
|---|---|---|---|
| 2002 | 7.5 | 7.2 | 12.5 |
| 2003 | 9.1 | 8.5 | 15.9 |
| 2004 | 7.3 | 6.7 | 13.1 |
| 2005 | 8.1 | 7.8 | 12 |
| 2006 | 7.1 | 6.7 | 10.8 |
| 2007 | 8 | 7.6 | 11.6 |
| 2008 | 5.7 | 5 | 10.8 |
| 2009 | 4.5 | 3.9 | 9.5 |
| 2010 | 3.8 | 3.5 | |
| 2011 | 4 | 3.8 | 5.8 |
| 2012 | 3.8 | 3 | 9.3 |
| 2013 | 3.5 | 3.4 |
Right Chart:
| Year | Hispanic | Non-Hispanic White |
|---|---|---|
| 2002 | 10.6 | 6.7 |
| 2003 | 13.9 | 8.1 |
| 2004 | 10.5 | 7.2 |
| 2005 | 9.3 | 7.7 |
| 2006 | 6.7 | 6.5 |
| 2007 | 8.9 | 6.8 |
| 2008 | 10.0 | 4.3 |
| 2009 | 10.1 | 2.6 |
| 2010 | 5.1 | 3.2 |
| 2011 | 5.6 | 3.5 |
| 2012 | 5.3 | 2.1 |
| 2013 | 4.8 | 2.8 |
Source: Agency for Healthcare Research and Quality, Medical Expenditure Panel Survey, 2002-2013.
Note: For this measure, lower rates are better. For 2010 and 2013, data for children who spoke a language other than English did not meet the criteria for statistical reliability, data quality, or confidentiality.
- Overall Rate: In 2013, the overall percentage of children who needed care right away who sometimes or never got care as soon as wanted was 3.5%.
- Trends:
- From 2002 to 2013, there no statistically significant changes in the percentage of English-speaking children and children speaking other languages who needed care right away who sometimes or never got care as soon as wanted.
- From 2010 to 2013, there were no statistically significant changes in the percentage of Hispanic and non-Hispanic White children who needed care right away who sometimes or never got care as soon as wanted.
- Groups With Disparities:
- From 2002 to 2013, Hispanic children were more likely than non-Hispanic White children to sometimes or never get care as soon as wanted.


