Services
- People with a usual source of care have better health outcomes, fewer disparities, and lower costs (Healthy People 2020).
- People with a usual place of care and a usual provider are more likely to receive preventive services and recommended screenings than people with no usual source of care (Blewett, et al., 2008).
Measures of Services
- Age-sex adjusted percentage of people of all ages with a usual place to go for medical care
- People who were unable to get or delayed in getting needed medical care, dental care, or prescription medicines in the last 12 months
- People who were unable to get or delayed in getting needed medical care, dental care, or prescription medicines in the last 12 months
Usual Source of Care
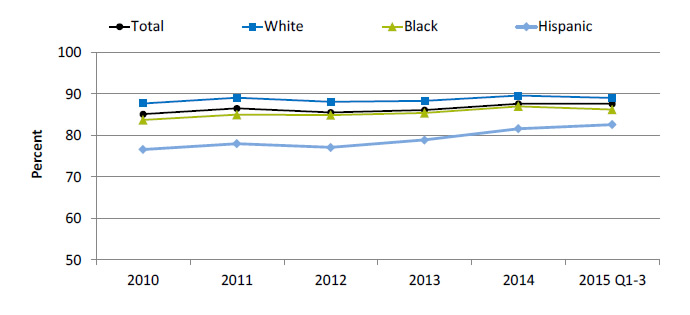
Age-sex adjusted percentage of people of all ages with a usual place to go for medical care, by race/ethnicity, 2010-2015 Q3

| Race/Ethnicity | 2010 | 2011 | 2012 | 2013 | 2014 | 2015 Q1-3 |
|---|---|---|---|---|---|---|
| Total | 85.1 | 86.5 | 85.5 | 86.1 | 87.6 | 87.6 |
| White | 87.7 | 89.1 | 88.1 | 88.3 | 89.6 | 89 |
| Black | 83.7 | 85 | 84.9 | 85.4 | 87 | 86.2 |
| Hispanic | 76.6 | 78 | 77.1 | 78.9 | 81.6 | 82.6 |
Source: National Center for Health Statistics, National Health Interview Survey, January 2010-September 2015.
Note: Total is only age adjusted. For this measure, lower rates are better. Data available for 2015 quarters 1-3 only. An emergency department is not considered a usual place to go for medical care.
- Trends: From January 2010 to September 2015, the percentage of people with a usual place to go for medical care increased overall, for Blacks, and for Hispanics. There were no statistically significant changes for Whites.
- Groups With Disparities:
- In all years, Blacks and Hispanics were less likely than Whites to have a usual place to go for medical care.
- Gaps related to race/ethnicity were getting smaller over time.
Difficulty Getting Care, by Insurance and Age
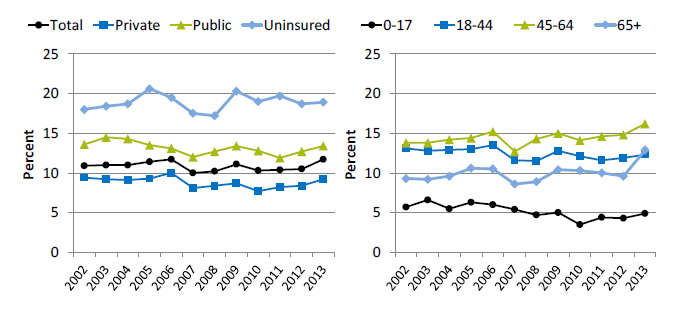
People who were unable to get or delayed in getting needed medical care, dental care, or prescription medicines in the last 12 months, by insurance (under age 65) and age, 2002-2013

Left Chart:
| Year | Total | Private | Public | Uninsured |
|---|---|---|---|---|
| 2002 | 10.9 | 9.4 | 13.6 | 18 |
| 2003 | 11 | 9.2 | 14.5 | 18.4 |
| 2004 | 11 | 9.1 | 14.3 | 18.7 |
| 2005 | 11.4 | 9.3 | 13.5 | 20.6 |
| 2006 | 11.7 | 10 | 13.1 | 19.5 |
| 2007 | 10 | 8.1 | 12 | 17.5 |
| 2008 | 10.2 | 8.4 | 12.7 | 17.2 |
| 2009 | 11.1 | 8.7 | 13.4 | 20.3 |
| 2010 | 10.3 | 7.7 | 12.8 | 19 |
| 2011 | 10.4 | 8.2 | 11.9 | 19.7 |
| 2012 | 10.5 | 8.4 | 12.7 | 18.7 |
| 2013 | 11.7 | 9.2 | 13.4 | 18.9 |
Right Chart:
| Year | 0-17 | 18-44 | 45-64 | 65+ |
|---|---|---|---|---|
| 2002 | 5.7 | 13.1 | 13.8 | 9.3 |
| 2003 | 6.6 | 12.8 | 13.8 | 9.2 |
| 2004 | 5.5 | 12.9 | 14.2 | 9.6 |
| 2005 | 6.3 | 13 | 14.4 | 10.6 |
| 2006 | 6 | 13.5 | 15.2 | 10.5 |
| 2007 | 5.4 | 11.6 | 12.7 | 8.6 |
| 2008 | 4.7 | 11.5 | 14.3 | 8.9 |
| 2009 | 5 | 12.8 | 15 | 10.4 |
| 2010 | 3.5 | 12.1 | 14.1 | 10.3 |
| 2011 | 4.4 | 11.6 | 14.6 | 10 |
| 2012 | 4.3 | 11.9 | 14.8 | 9.6 |
| 2013 | 4.9 | 12.3 | 16.2 | 12.9 |
Source: Agency for Healthcare Research and Quality, Medical Expenditure Panel Survey, 2002-2013.
Note: For this measure, lower rates are better.
- Overall Rate: In 2013, the overall percentage of people unable to get or delayed in getting needed medical care, dental care, or prescription medicines in the last 12 months was 11.7%.
- Trends: From 2002 to 2013, there were no statistically significant changes in the percentage of people who were unable to get or delayed in getting needed medical care, dental care, or prescription medicines in the last 12 months for any insurance or age group, except people ages 0-17. The percentage for that group decreased.
- Groups With Disparities:
- In all years, among people under age 65, the percentage unable to get or delayed in getting needed medical care, dental care, or prescription medicines was higher for uninsured people and people with public insurance compared with people with private insurance. The gap between uninsured people and people with private insurance was growing larger over time.
- In all years, the percentage of people unable to get or delayed in getting needed medical care, dental care, or prescription medicines was higher for adults ages 18-44 than for children ages 0-17. The gap between adults ages 45-64 and adults ages 18-44 was growing larger over time, as was the gap between adults ages 45-64 and adults age 65 and over.
Difficulty Getting Care, by Health Status and Ethnicity
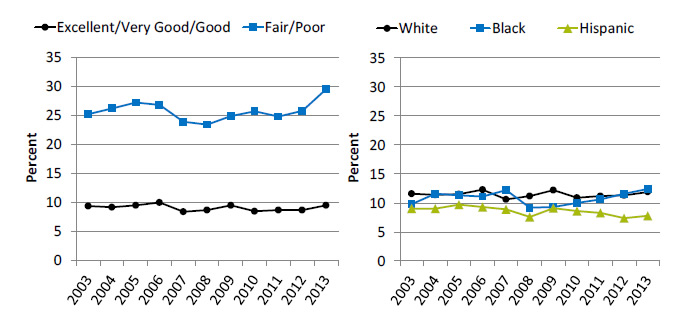
People who were unable to get or delayed in getting needed medical care, dental care, or prescription medicines in the last 12 months, by perceived health status and ethnicity, 2003-20

Left Chart:
| Year | Excellent / Very Good / Good | Fair / Poor |
|---|---|---|
| 2003 | 9.4 | 25.2 |
| 2004 | 9.2 | 26.2 |
| 2005 | 9.5 | 27.2 |
| 2006 | 10 | 26.8 |
| 2007 | 8.4 | 23.9 |
| 2008 | 8.7 | 23.4 |
| 2009 | 9.5 | 24.9 |
| 2010 | 8.5 | 25.7 |
| 2011 | 8.7 | 24.8 |
| 2012 | 8.7 | 25.8 |
| 2013 | 9.5 | 29.5 |
Right Chart:
| Race/Ethnicity | 2003 | 2004 | 2005 | 2006 | 2007 | 2008 | 2009 | 2010 | 2011 | 2012 | 2013 |
|---|---|---|---|---|---|---|---|---|---|---|---|
| White | 11.6 | 11.4 | 11.5 | 12.3 | 10.6 | 11.2 | 12.2 | 10.9 | 11.2 | 11.3 | 11.9 |
| Black | 9.8 | 11.6 | 11.3 | 11.1 | 12.2 | 9.2 | 9.3 | 10 | 10.6 | 11.6 | 12.4 |
| Hispanic | 9 | 9 | 9.7 | 9.3 | 8.9 | 7.6 | 9.1 | 8.6 | 8.3 | 7.4 | 7.8 |
Source: Agency for Healthcare Research and Quality, Medical Expenditure Panel Survey, 2003-2013.
Note: For this measure, lower rates are better. White and Black are non-Hispanic. Hispanic includes all races.
- Trends:
- From 2002 to 2013, there were no statistically significant changes among people with fair/poor or excellent/very good/good perceived health status in the percentage of people who were unable to get or delayed in getting needed medical care, dental care, or prescription medicines.
- From 2002 to 2013, there were no statistically significant changes among Whites or Blacks in the percentage of people who were unable to get or delayed in getting needed medical care, dental care, or prescription medicines.
- From 2003 to 2013, the percentage of people who were unable to get or delayed in getting needed medical care, dental care, or prescription medicines improved for Hispanics.
- Groups With Disparities:
- In 2013, there was no statistically significant change in the gap between people who perceived their health status to be fair or poor and people who perceived their health status to be excellent, very good, or good.
- In 2013, Hispanics were less likely than Whites to have difficulty getting needed medical care, dental care, or prescription medicines.


