- The Centers for Medicare & Medicaid Services (CMS) defines a transition of care as the movement of a patient from one setting of care to another. Settings of care may include hospitals, ambulatory primary care practices, ambulatory specialty care practices, long-term care facilities, home health, and rehabilitation facilities.
- Transitions increase the risk of adverse events due to the potential for miscommunication as responsibility is given to new parties.
- Hospital discharge is a complex process representing a time of significant vulnerability for patients.
- Safe and effective transfer of responsibility for a patient’s medical care relies on effective provider communication with patient comprehension of discharge instructions (Gallahue, et al., 2015).
Measures of transitions of care include:
- Hospitalized adult patients with heart failure who were given complete written discharge instructions.
- Communication about discharge information.
- Median hospital 30-day risk-standardized readmission rate.
Complete Written Discharge Instructions
- Effective care coordination begins by ensuring that accurate clinical information is available to support medical decisions by patients and providers.
- A common transition of care is hospital discharge.
- A successful transition depends on whether hospitals have adequately educated patients about key elements of care, such as diagnosis and followup plans (Horwitz, et al., 2013).
Patients With Heart Failure Who Received Written Discharge Instructions
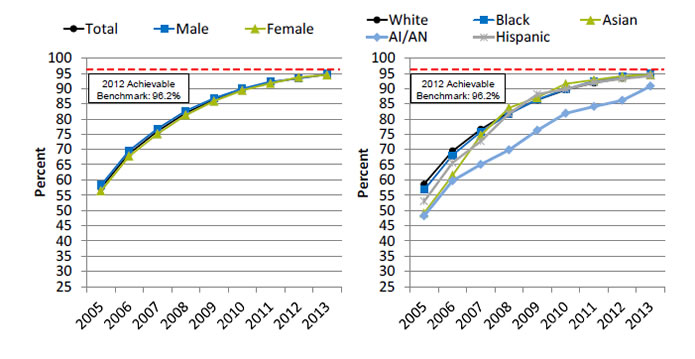
Hospitalized adults with heart failure who were given complete written discharge instructions, by sex and race/ethnicity, 2005-2013
Left Chart:
| Sex | 2005 | 2006 | 2007 | 2008 | 2009 | 2010 | 2011 | 2012 | 2013 |
|---|---|---|---|---|---|---|---|---|---|
| Total | 57.4 | 68.7 | 76.0 | 82.0 | 86.4 | 89.7 | 92.0 | 93.5 | 94.6 |
| Female | 56.4 | 67.8 | 75.1 | 81.3 | 85.9 | 89.4 | 91.7 | 93.7 | 94.5 |
| Male | 58.3 | 69.6 | 76.8 | 82.7 | 86.9 | 90.0 | 92.3 | 93.3 | 94.8 |
Right Chart:
| Race/Ethnicity | 2005 | 2006 | 2007 | 2008 | 2009 | 2010 | 2011 | 2012 | 2013 |
|---|---|---|---|---|---|---|---|---|---|
| White | 58.6 | 69.5 | 76.6 | 82.2 | 86.3 | 89.6 | 91.9 | 93.4 | 94.7 |
| Black | 56.7 | 68.1 | 75.8 | 81.7 | 86.4 | 89.8 | 92.4 | 93.9 | 94.8 |
| Hispanic | 53.0 | 65.6 | 72.6 | 81.8 | 88.2 | 89.8 | 92.0 | 93.2 | 94.2 |
| AI/AN | 48.2 | 59.7 | 65.0 | 69.8 | 76.3 | 81.9 | 84.1 | 86.1 | 90.8 |
| Asian | 49.1 | 61.5 | 74.6 | 83.7 | 87.1 | 91.6 | 92.9 | 94.1 | 94.6 |
2012 Achievable Benchmark: 96.2%.
Key: AI/AN = American Indian or Alaska Native.
Source: Centers for Medicare & Medicaid Services, Medicare Quality Improvement Organization Program, 2005-2013.
- Importance: Heart failure is the most frequent hospital discharge diagnosis in the older adults. Annually more than 1 million patients are hospitalized with a primary diagnosis of heart failure accounting for a total Medicare expenditure exceeding $17 billion (Desai, 2012).
- Trends:
- From 2005 to 2013, the percentage of hospitalized adult patients with heart failure who were given complete written discharge instructions improved from 57.4% to 94.6%.
- Improvements were observed among both sexes and all racial/ethnic groups.
- Groups With Disparities:
- In all years, there were no statistically significant differences by sex.
- In all years, the percentage of hospitalized adult patients with heart failure who were given complete written discharge instructions was lower for American Indians and Alaska Natives (AI/ANs) than for Whites.
- Achievable Benchmark:
- The 2012 top 5 State achievable benchmark was 96.2%. The top 5 States that contributed to the achievable benchmark are Illinois, Maine, New Hampshire, New Jersey, and Ohio.
- At the current rates of increase, this benchmark could be attained overall and by both sexes in less than a year. All racial/ethnic groups could attain the benchmark in less than a year except AI/ANs, who could achieve the benchmark in about 1 year.
Hospital Patients Who Did Not Receive Good Discharge Information
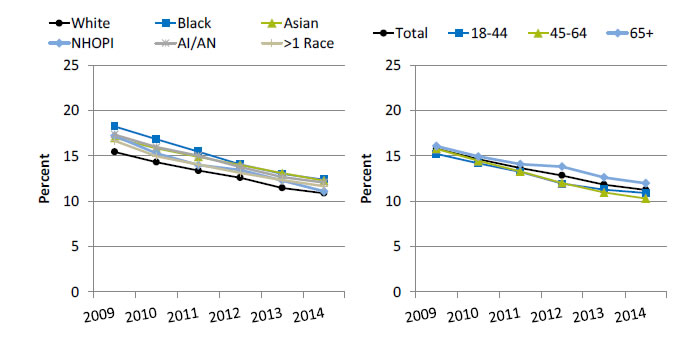
Adult hospital patients who did not receive good communication about discharge information, by race and age, 2009-2014
Left Chart:
| Year | White | Black | Asian | NHOPI | AI/AN | >1 Race |
|---|---|---|---|---|---|---|
| 2009 | 15.5 | 18.2 | 17.0 | 17.2 | 17.4 | 16.7 |
| 2010 | 14.3 | 16.9 | 15.8 | 15.3 | 16.0 | 15.0 |
| 2011 | 13.4 | 15.5 | 14.9 | 14.0 | 15.0 | 14.1 |
| 2012 | 12.6 | 14.1 | 14.0 | 13.5 | 13.8 | 13.1 |
| 2013 | 11.5 | 13.0 | 13.1 | 12.3 | 12.7 | 12.4 |
| 2014 | 10.9 | 12.4 | 12.3 | 11.1 | 12.1 | 11.7 |
Right Chart:
| Year | Total | 18-44 | 45-64 | 65+ |
|---|---|---|---|---|
| 2009 | 15.8 | 15.2 | 15.8 | 16.1 |
| 2010 | 14.6 | 14.2 | 14.5 | 14.9 |
| 2011 | 13.7 | 13.2 | 13.3 | 14.1 |
| 2012 | 12.9 | 11.9 | 12.0 | 13.8 |
| 2013 | 11.8 | 11.3 | 11.0 | 12.6 |
| 2014 | 11.3 | 10.9 | 10.3 | 12.0 |
Key: NHOPI = Native Hawaiian or Other Pacific Islander; AI/AN = American Indian or Alaska Native.
Source: Centers for Medicare & Medicaid Services, Hospital Consumer Assessment of Healthcare Providers and Systems,.2009-2014.
- Importance: Health care provider–patient communication about prognosis and preferences for care is critical in helping patients adequately prepare for and plan future care, and physicians’ communication style may affect patients’ satisfaction, trust, willingness to cooperate, and health status.
- Trends:
- From 2009 to 2014, the percentage of adult hospital patients who did not receive good communication about discharge information improved from 15.8% to 11.3%.
- From 2009 to 2014, improvements were observed among all racial and age groups.
- Groups With Disparities:
- In all years, Black and Asian patients were less likely than White patients to receive good communication about discharge information.
- In all years except 2012, AI/AN patients were less likely than White patients to receive good communication about discharge information.
Hospital Patients Who Had Difficulty Understanding Postdischarge Care
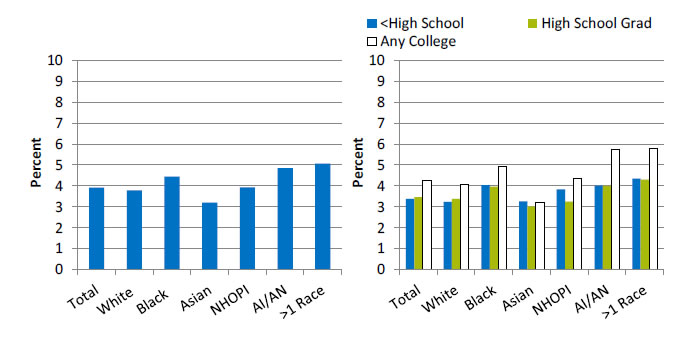
Adult hospital patients who strongly disagreed or disagreed that they understood how to manage their health after discharge, by race, 2014
Left Chart:
- Total - 3.9.
- White - 3.8.
- Black - -4.5.
- Asian - 3.2.
- NHOPI - 3.9.
- AI/AN - 4.9.
- More than 1 Race - 5.1.
Right Chart:
| Race | <High School | High School Grad | Any College |
|---|---|---|---|
| Total | 3.4 | 3.5 | 4.3 |
| White | 3.2 | 3.4 | 4.1 |
| Black | 4.0 | 4.0 | 4.9 |
| Asian | 3.3 | 3.0 | 3.2 |
| NHOPI | 3.8 | 3.3 | 4.4 |
| AI/AN | 4.0 | 4.0 | 5.8 |
| >1 Race | 4.3 | 4.3 | 5.8 |
Key: NHOPI = Native Hawaiian or Other Pacific Islander; AI/AN = American Indian or Alaska Native.
Source: Centers for Medicare & Medicaid Services, Hospital Consumer Assessment of Healthcare Providers and Systems, 2014.
- Importance: Comprehension of and compliance with discharge instructions can reduce emergency department visits and rehospitalizations, improve postdischarge health outcomes, and decrease health care expenditures.
- Overall Rate: In 2014, 3.9% of hospital patients strongly disagreed or disagreed that they understood how to manage their health after discharge.
- Groups With Disparities:
- In 2014, Black, AI/AN, and multiple-race patients were more likely than White patients to strongly disagree or disagree that they understood how to manage their health after discharge.
- In 2014, White, Black, AI/AN, and multiple-race patients with any college education were more likely than patients with no college education to strongly disagree or disagree that they understood how to manage their health after discharge.
Hospital Patients Who Said Staff Took Patient, Family, and Caregiver Preferences Into Account When Deciding on Postdischarge Care
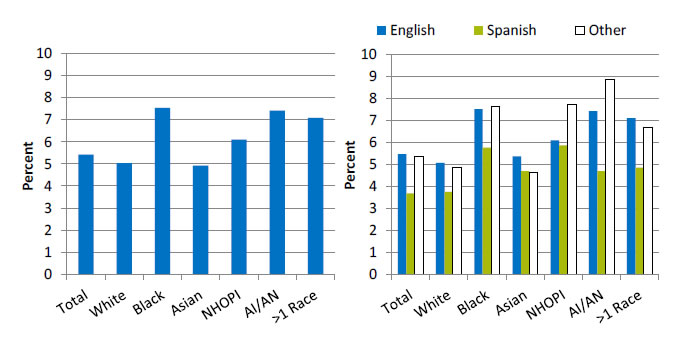
Adult hospital patients who strongly disagreed or disagreed that staff took their preferences and those of their family and caregiver into account when deciding what the patient's discharge health care would be, by race and stratified by language spoken at home, 2014
Left Chart:
- Total - 5.4.
- White - 5.0.
- Black - 7.5.
- Asian - 4.9.
- NHOPI - 6.1.
- AI/AN - 7.4.
- More than 1 Race - 7.1
Right Chart:
| Race | English | Spanish | Other |
|---|---|---|---|
| Total | 5.5 | 3.7 | 5.3 |
| White | 5.1 | 3.8 | 4.9 |
| Black | 7.5 | 5.8 | 7.6 |
| Asian | 5.4 | 4.7 | 4.6 |
| NHOPI | 6.1 | 5.9 | 7.7 |
| AI/AN | 7.4 | 4.7 | 8.8 |
| >1 Race | 7.1 | 4.9 | 6.7 |
Key: NHOPI = Native Hawaiian or Other Pacific Islander; AI/AN = American Indian or Alaska Native.
Source: Centers for Medicare & Medicaid Services, Hospital Consumer Assessment of Healthcare Providers and Systems, 2014.
- Importance: Providing comprehensive, patient-centered discharge planning can help reduce readmission rates.
- Overall Rate: In 2014, 5.4% of hospital patients strongly disagreed or disagreed that staff took their preferences and those of their families and caregiver into account when deciding what the patient’s discharge health care would be.
- Groups With Disparities:
- In 2014, Black, NHOPI, AI/AN, and multiple-race patients were more likely than White patients to strongly disagree or disagree that staff took their preferences and those of their families and caregiver into account when deciding what the patient’s discharge health care would be.
- In 2014, White, Black, AI/AN, and multiple-race patients whose preferred language was Spanish were less likely than patients whose preferred language was English to strongly disagree or disagree that staff took their preferences and those of their families and caregiver into account when deciding what the patient’s discharge health care would be.
Readmissions
- Hospital readmission shortly after discharge is a marker of inpatient quality of care and a significant contributor to rising health care costs (Hasan, 2010).
- In 2013, approximately two-thirds of U.S. hospitals faced financial penalties from CMS because of excessively high 30-day readmission rates for acute myocardial infarction, heart failure, and pneumonia (Rau, 2013).
Median Hospital Readmission Rate
Median hospital 30-day risk-standardized readmission rate for certain conditions, adults age 65 and over, July 2010-June 2013
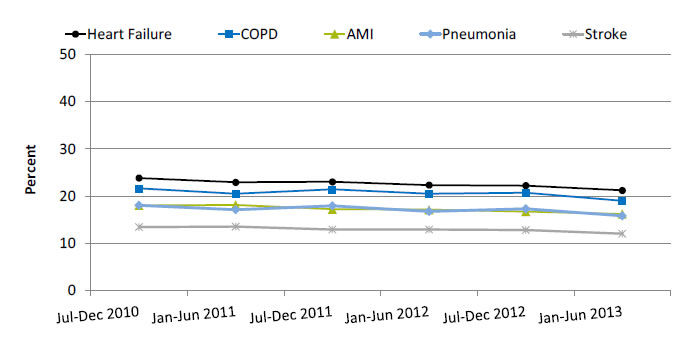
| Date | Heart Failure | COPD | AMI | Pneumonia | Stroke |
|---|---|---|---|---|---|
| Jul-Dec 2010 | 23.8 | 21.6 | 18.0 | 18.0 | 13.4 |
| Jan-Jun 2011 | 22.9 | 20.5 | 18.1 | 17.1 | 13.5 |
| Jul-Dec 2011 | 23.0 | 21.4 | 17.2 | 17.9 | 12.9 |
| Jan-Jun 2012 | 22.3 | 20.5 | 17.1 | 16.7 | 12.9 |
| Jul-Dec 2012 | 22.2 | 20.7 | 16.7 | 17.3 | 12.8 |
| Jan-Jun 2013 | 21.2 | 19.0 | 16.2 | 15.8 | 12.0 |
Key: COPD = chronic obstructive pulmonary disease; AMI = acute myocardial infarction.
Denominator: Expected number of readmissions for Medicare fee-for-service patients age 65 years and over for each disease type given the hospital's case mix.
Source: Centers for Medicare & Medicaid Services, 2014 Medicare Hospital Quality Chartbook.
Note: For this measure, lower rates are better. Readmission refers to an unplanned admission to a hospital for any condition or procedure 30 days after discharge.
- Importance: Although not all hospital readmissions are preventable, readmission rates may show whether a hospital is doing its best to deliver quality care, prevent complications, teach patients at discharge, and ensure that patients make a smooth transition to their home or another setting, such as a nursing home.
- Overall Rate: The median 30-day risk-standardized readmission rate in 2013 was 21.2% among patients with heart failure, 19.0% among patients with chronic obstructive pulmonary disease (COPD), 16.2% among patients with acute myocardial infarction (AMI), 15.8% among patients with pneumonia, and 12.0% among patients who had a stroke.
- Trends: From July-December 2010 to January-June 2013, the median 30-day risk-standardized readmission rate decreased 12% among patients with pneumonia and COPD, 11% among patients with heart failure, 10.5% among patients with stroke, and 10% among patients with AMI.
Median Hospital Readmission Rate, by Percentage of Patients Who Are Black
Median hospital 30-day risk-standardized readmission rate, by percentage of patients who are Black, July 2010-June 2013 (combined)
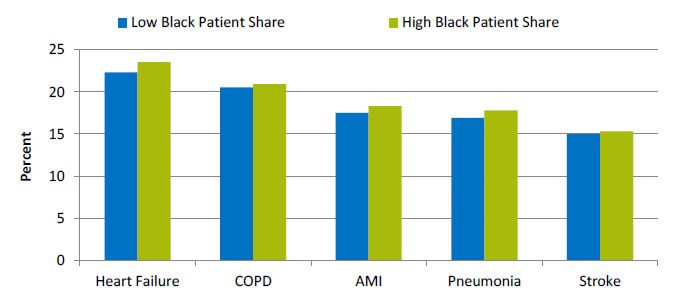
| Heart Failure | COPD | AMI | Pneumonia | Stroke | |
|---|---|---|---|---|---|
| Low Black Patient Share | 22.3 | 20.5 | 17.5 | 16.9 | 15 |
| High Black Patient Share | 23.5 | 20.9 | 18.3 | 17.8 | 15.3 |
Key: AMI = acute myocardial infarction; COPD = chronic obstructive pulmonary disease.
Source: Centers for Medicare & Medicaid Services, CMS Medicare Hospital Quality Chartbook: Performance Report on Outcome Measures, September 2014.
Denominator: Expected number of readmissions for patients age 65 years and over for each disease type given the hospital's case mix.
Note: For this measure, lower rates are better. The risk-standardized readmission rate is calculated as the number of "predicted" readmissions divided by the number of "expected" readmissions, multiplied by the national unadjusted readmission rate. For AMI, low Black patient share is defined as 0% and high as <22%. For the other four conditions, low share is defined as 0% and high as <23%.
- Importance: Although not all hospital readmissions are preventable, readmission rates may show whether a hospital is doing its best to deliver quality care, prevent complications, teach patients at discharge, and ensure that patients make a smooth transition to their home or another setting, such as a nursing home.
- Groups With Disparities:
- The 2010 to 2013 median 30-day risk-standardized readmission rate for hospitals with high shares of Black patients was highest for heart failure (23.5%) and chronic obstructive pulmonary disease (20.9%), lower for acute myocardial infarction (18.3%) and pneumonia (17.8%), and lowest for stroke (15.3%). These rates were similar to those for hospitals with low shares of Black patients.
Median Hospital Readmission Rate, by Percentage of Patients Who Have Medicaid
Median hospital 30-day risk-standardized readmission rate, by percentage of patients who have Medicaid, July 2010-June 2013 (combined)
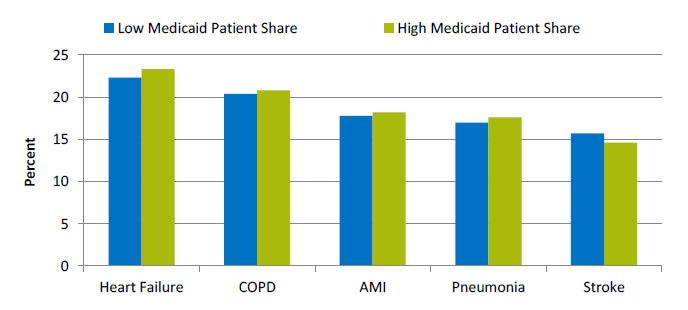
| Heart Failure | COPD | AMI | Pneumonia | Stroke | |
|---|---|---|---|---|---|
| Low Medicaid Patient Share | 22.3 | 20.4 | 17.8 | 17 | 15.7 |
| High Medicaid Patient Share | 23.3 | 20.8 | 18.2 | 17.6 | 14.6 |
Key: AMI = acute myocardial infarction; COPD = chronic obstructive pulmonary disease.
Source: Centers for Medicare & Medicaid Services, CMS Medicare Hospital Quality Chartbook: Performance Report on Outcome Measures, September 2014.
Denominator: Expected number of readmissions for patients age 65 years and over for each disease type given the hospital's case mix.
Note: For this measure, lower rates are better. The risk-standardized readmission rate is calculated as the number of "predicted" readmissions divided by the number of "expected" readmissions, multiplied by the national unadjusted readmission rate. For AMI and stroke, low Medicaid patient share is defined as ≤8% and high as ≥30%. For heart failure and COPD, low share is defined as ≤7% and high as ≥29%. For pneumonia, low share is defined as ≤6% and high as ≥29%.
- Importance: Although not all hospital readmissions are preventable, readmission rates may show whether a hospital is doing its best to deliver quality care, prevent complications, teach patients at discharge, and ensure that patients make a smooth transition to their home or another setting, such as a nursing home.
- Groups With Disparities:
- The 2010 to 2013 median 30-day risk-standardized readmission rate for hospitals with high Medicaid patient share was highest for heart failure (23.3%) and chronic obstructive pulmonary disease (20.8%), lower for acute myocardial infarction (18.2%) and pneumonia (17.6%), and lowest for stroke (14.6%). These rates were similar to those for hospitals with low Medicaid patient share.


