- Electronic health records (EHRs) can improve the quality and safety of health care.
- The adoption and effective use of health information technology can:
- Help reduce medical errors and adverse events.
- Enable better documentation and file organization.
- Provide patients with information that assists their adherence to medication regimens and scheduled appointments.
- Assist doctors in tracking their treatment protocols (IOM, 2010).
Electronic health record measures include:
- Patients who reported that it was very important for them to get their own medical information electronically.
- Patients who reported that it was very important that doctors and other health providers be able to share their medical information with other providers electronically.
- Hospitals with fully implemented electronic medical record system.
- Hospitals with computerized systems that allow electronic clinical documentation.
- Hospitals with computerized systems that allow results viewing.
- Hospitals with computerized systems that allow decision support.
- Hospitals with computerized systems that allow computerized provider order entry (CPOE).
Patients Who Found It Important To Get Their Own Medical Information Electronically
Patients who reported that it was very important for them to get their own medical information electronically, by age and residence location, 2008 and 2012-2014
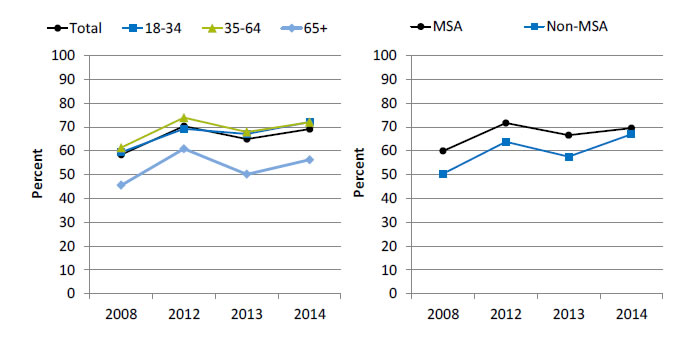
Left Chart:
| Age | 2008 | 2012 | 2013 | 2014 |
|---|---|---|---|---|
| Total | 58.3 | 70.3 | 64.9 | 69.1 |
| 18-34 | 59.4 | 69.2 | 67 | 72.1 |
| 35-64 | 61.3 | 73.9 | 67.9 | 72 |
| 65+ | 45.5 | 60.8 | 50.1 | 56.2 |
Right Chart:
| Location | 2008 | 2012 | 2013 | 2014 |
|---|---|---|---|---|
| MSA | 59.9 | 71.6 | 66.5 | 69.5 |
| Non-MSA | 50.3 | 63.8 | 57.5 | 66.9 |
Key: MSA = metropolitan statistical area.
Source: Health Information National Trends Survey. Iterations included in this chart are HINTS 3, HINTS 4 Cycle 1, and HINTS 4 Cycle 2. Available at http://hints.cancer.gov/.
- Importance: The 2009 U.S. Health Information Technology for Economic and Clinical Health (HITECH) Act called for the creation of a meaningful use incentive program to provide financial support to providers and health systems that adopt electronic health record (EHR) technologies. Stage 2 of the meaningful use incentive program requires the active engagement of patients and their families with patient portal technology in managing their own health information and care coordination (Ford, et al., 2016).
- Trends:
- From 2008 to 2014, the percentage of patients who reported that it was very important for them to get their own medical information electronically increased from 58.3% to 69.1%.
- From 2009 to 2014, the percentage of patients in metropolitan areas who reported that it was very important for them to get their own medical information electronically increased from 59.9% to 69.5%. Among residents of nonmetropolitan areas, the percentage increased from 50.3% to 66.9%.
- Differences Between Groups:
- In all years, patients age 65 and over were less likely than patients ages 35-64 to report that it was very important for them to get their own medical information electronically.
- In all years except 2014, residents of nonmetropolitan areas were less likely than residents of metropolitan areas to report that it was very important for them to get their own medical information electronically.
Patients Who Found It Important To Get Their Own Medical Information Electronically
Patients who reported that it was very important for them to get their own medical information electronically, by race/ethnicity and education, 2008 and 2012-2014
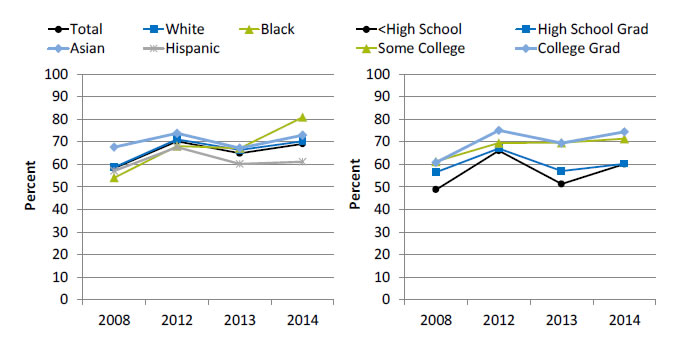
Left Chart:
| Race/Ethnicity | 2008 | 2012 | 2013 | 2014 |
|---|---|---|---|---|
| Total | 58.3 | 70.3 | 64.9 | 69.1 |
| White | 58.8 | 71.1 | 66.4 | 70.3 |
| Black | 54.1 | 68.1 | 67.2 | 80.9 |
| Asian | 67.6 | 73.8 | 67.2 | 73 |
| Hispanic | 57.1 | 67.6 | 60.2 | 61.2 |
Right Chart:
| Education | 2008 | 2012 | 2013 | 2014 |
|---|---|---|---|---|
| <High School | 48.8 | 66.1 | 51.3 | 60.1 |
| High School Grad | 56.5 | 67.1 | 57.1 | 60.3 |
| Some College | 61.3 | 69.5 | 69.6 | 71.4 |
| College Grad | 60.8 | 75.1 | 69.5 | 74.5 |
Source: Health Information National Trends Survey. Iterations included in this chart are HINTS 3, HINTS 4 Cycle 1, and HINTS 4 Cycle 2. Available at http://hints.cancer.gov/.
Note: White, Black, and Asian are non-Hispanic. Hispanic includes all races.
- Importance: The 2009 U.S. Health Information Technology for Economic and Clinical Health (HITECH) Act called for the creation of a meaningful use incentive program to provide financial support to providers and health systems that adopt electronic health record technologies. Stage 2 of the meaningful use incentive program requires the active engagement of patients and their families with patient portal technology in managing their own health information and care coordination (Ford, et al., 2016).
- Trends:
- From 2008 to 2014, the percentage of patients who reported that it was very important for them to get their own medical information electronically increased:
- From 58.8% to 70.3% for Whites.
- From 54.1% to 80.9% for Blacks.
- From 67.6% to 73.0% for Asians.
- From 57.1% to 61.2% for Hispanics.
- From 2008 to 2014, the percentage of patients who reported that it was very important for them to get their own medical information electronically increased:
- From 60.8% to 74.5% for college graduates.
- From 61.3% to 71.4% for patients with some college education.
- From 56.5% to 60.3% for high school graduates.
- From 48.8% to 60.1% for patients with less than a high school education.
- From 2008 to 2014, the percentage of patients who reported that it was very important for them to get their own medical information electronically increased:
- Differences Between Groups:
- In 2013, Black patients were more likely than White patients to report that it was very important for them to get their own medical information electronically.
- In 2013 and 2014, Hispanic patients were less likely than White patients to report that it was very important for them to get their own medical information electronically.
Patients Who Found It Important for Doctors To Be Able To Share Their Medical Information With Other Providers Electronically
Patients who reported that it was very important that doctors and other health providers be able to share their medical information with other providers electronically, by age and residence location, 2008 and 2012-2014
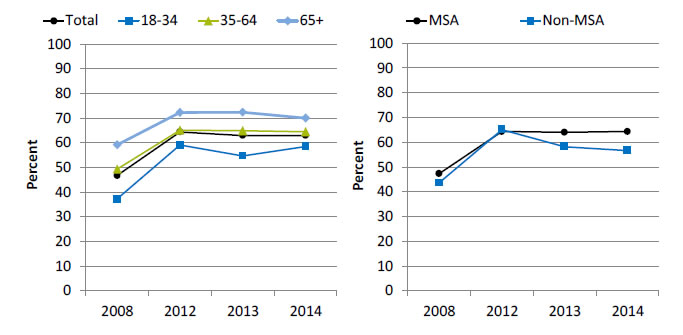
Left Chart:
| Age | 2008 | 2012 | 2013 | 2014 |
|---|---|---|---|---|
| Total | 46.7 | 64.4 | 63 | 63 |
| 18-34 | 37.2 | 59.1 | 54.7 | 58.5 |
| 35-64 | 49.3 | 65.1 | 64.9 | 64.5 |
| 65+ | 59.2 | 72.3 | 72.4 | 70 |
Right Chart:
| Location | 2008 | 2012 | 2013 | 2014 |
|---|---|---|---|---|
| MSA | 47.3 | 64.3 | 64 | 64.3 |
| Non-MSA | 43.6 | 65.1 | 58.2 | 56.6 |
Key: MSA = metropolitan statistical area.
Source: Health Information National Trends Survey. Iterations included in this chart are HINTS 3, HINTS 4 Cycle 1, and HINTS 4 Cycle 2. Available at http://hints.cancer.gov/.
- Importance: Richer information flowing between and within practices can enhance primary care provider decisionmaking and improve care coordination (Cross, et al., 2015).
- Trends:
- From 2008 to 2014, the percentage of patients who reported that it was very important that health providers be able to share their medical information with other providers electronically increased from 46.7% to 63.0%.
- From 2008 to 2014, the percentage of patients of metropolitan areas who reported that it was very important that health providers be able to share their medical information with other providers electronically increased from 47.3% to 64.3%. The percentage for residents of nonmetropolitan areas increased from 43.6% to 56.6%.
- Differences Between Groups:
- In all years, patients ages 18-34 were less likely than patients age 65 and over to report that it was very important that health providers be able to share their medical information with other providers electronically.
- In 2013 and 2014, patients in metropolitan areas more likely than patients in nonmetropolitan areas to report that it was very important that health providers be able to share their medical information with other providers electronically.
Patients Who Found It Important for Doctors To Be Able To Share Their Medical Information With Other Providers Electronically
Patients who reported that it was very important that doctors and other health providers be able to share their medical information with other providers electronically, by race/ethnicity and education, 2008 and 2012-2014
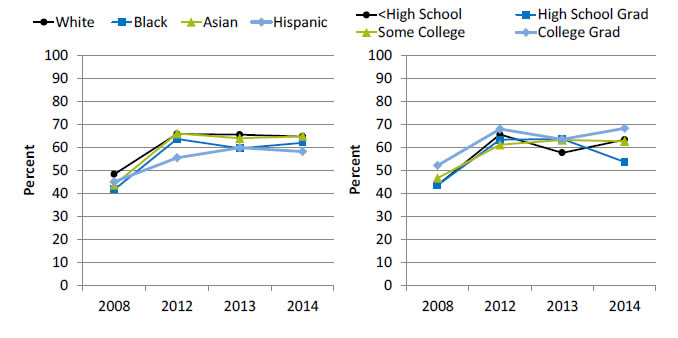
Left Chart:
| Race/Ethnicity | 2008 | 2012 | 2013 | 2014 |
|---|---|---|---|---|
| White | 48.4 | 65.9 | 65.6 | 64.8 |
| Black | 41.8 | 63.7 | 59.7 | 62.1 |
| Asian | 43.8 | 66.1 | 64 | 64.9 |
| Hispanic | 45.1 | 55.6 | 59.9 | 58.3 |
Right Chart:
| Education | 2008 | 2012 | 2013 | 2014 |
|---|---|---|---|---|
| <High School | 43.7 | 65.7 | 57.7 | 63.4 |
| High School Grad | 43.7 | 63.4 | 63.7 | 53.7 |
| Some College | 46.8 | 61.2 | 63.3 | 62.7 |
| College Grad | 52.2 | 68.1 | 63.6 | 68.4 |
Source: Health Information National Trends Survey. Iterations included in this chart are HINTS 3, HINTS 4 Cycle 1, and HINTS 4 Cycle 2. Available at http://hints.cancer.gov/.
Note: White, Black, and Asian are non-Hispanic. Hispanic includes all races.
- Importance: Richer information flowing between and within practices can enhance primary care provider decisionmaking and improve care coordination (Cross, et al., 2015).
- Trends:
- From 2008 to 2014, the percentage of patients who reported that it was very important that health providers be able to share their medical information with other providers electronically increased:
- From 48.4% to 64.8% for Whites.
- From 41.8% to 62.1% for Blacks.
- From 43.8% to 64.9% for Asians.
- From 45.1% to 58.3% for Hispanics.
- From 2008 to 2014, the percentage of patients who reported that it was very important that health providers be able to share their medical information with other providers electronically increased:
- From 52.2% to 68.4% for college graduates.
- From 46.8% to 62.7% for patients with some college.
- From 43.7% to 53.7% for high school graduates.
- From 43.7% to 63.4% for patients with less a high school education.
- From 2008 to 2014, the percentage of patients who reported that it was very important that health providers be able to share their medical information with other providers electronically increased:
- Differences Between Groups:
- From 2012 to 2014, Hispanic patients were less likely than White patients to report that it was very important that health providers be able to share their medical information with other providers electronically.
Hospitals With Computerized Systems That Allow Electronic Clinical Documentation
Hospitals with computerized systems that allow electronic clinical documentation, by component, 2011-2013
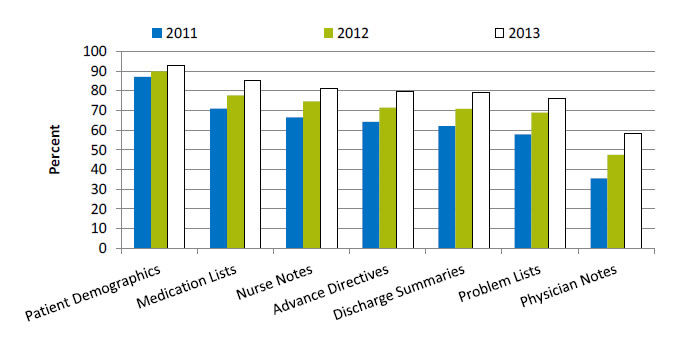
| Component | 2011 | 2012 | 2013 |
|---|---|---|---|
| Patient Demographics | 87.1 | 89.9 | 93 |
| Medication Lists | 71 | 77.7 | 85.4 |
| Nurse Notes | 66.5 | 74.6 | 81.4 |
| Advance Directives | 64.3 | 71.5 | 79.7 |
| Discharge Summaries | 62.1 | 70.9 | 79.1 |
| Problem Lists | 58 | 68.9 | 76.2 |
| Physician Notes | 35.5 | 47.5 | 58.4 |
Source: American Hospital Association, Information Technology Supplement, 2013.
- Importance: Compared with paper, electronic provider documentation allows faster and more complete access to the patient record and may improve communication among members of the health care team. Some evidence exists that electronic documentation may be associated with improved patient outcomes and decreased costs (Hripcsak, et al., 2011).
- Overall Rate: In 2013, 52.4% of hospitals had a computerized system for electronic clinical documentation, an increase from 29.6% in 2011 (data not shown).
- Trends:
- From 2011 to 2013, among hospitals with computerized systems that allow electronic clinical documentation, each component improved as follows:
- Patient demographics, 87.1% to 93.0%.
- Medication lists, 71.0% to 85.4%.
- Nursing notes, 66.5% to 81.4%.
- Advance directives, 64.3% to 79.7%.
- Discharge summaries, 62.1% to 79.1%.
- Problem lists, 58.0% to 76.2%.
- Physician notes, 35.5% to 58.4%.
- From 2011 to 2013, among hospitals with computerized systems that allow electronic clinical documentation, each component improved as follows:
Hospitals With Computerized Systems That Allow Electronic Clinical Documentation With a Component for Discharge Summaries
Hospitals with computerized systems that allow electronic clinical documentation with a component for discharge summaries, by hospital control and hospital type, 2013
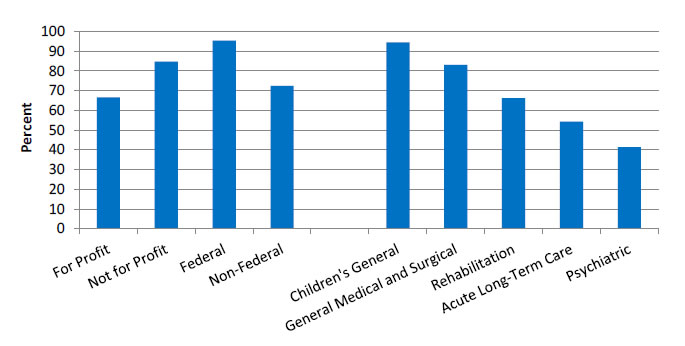
- For Profit - 66.6.
- Not for Profit - 84.7.
- Federal - 95.5.
- Non-Federal - 72.5.
- Children's General - 94.5.
- General Medical and Surgical - 83.
- Rehabilitation - 66.2.
- Acute Long-Term Care - 54.3.
- Psychiatric - 41.3.
Note: Non-Federal refers to government hospitals.
- Importance: Compared with paper, electronic provider documentation allows faster and more complete access to the patient record and may improve communication among members of the health care team. Some evidence exists that electronic documentation may be associated with improved patient outcomes and decreased costs.
- Differences:
- In 2013, 66.6% of for-profit hospitals, 84.7% of not-for-profit hospitals, 95.5% of hospitals run by the Federal Government, and 72.5% of non-Federal hospitals and had a computerized system for electronic clinical documentation with a component for discharge summaries.
- In 2013, 94.5% of children’s general, 83.0% of general medical and surgical, 66.2% of rehabilitation, 54.3% of acute long-term care, and 41.3% of psychiatric hospitals had a computerized system for electronic clinical documentation with a component for discharge summaries.
Hospitals With Computerized Systems That Allow Results Viewing
Hospitals with computerized systems that allow results viewing, by component, 2012-2013
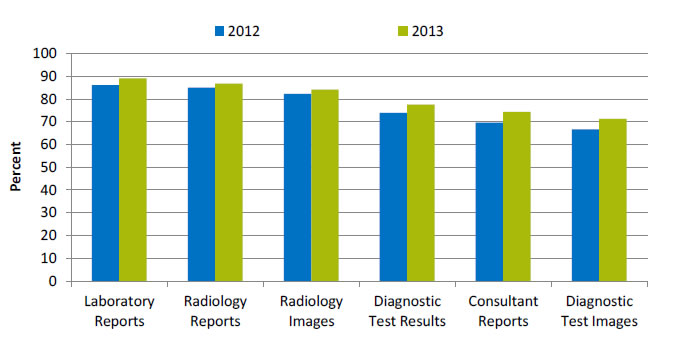
| Component | 2012 | 2013 |
|---|---|---|
| Laboratory Reports | 86.2 | 89.1 |
| Radiology Reports | 85 | 86.8 |
| Radiology Images | 82.3 | 84.2 |
| Diagnostic Test Results | 73.9 | 77.5 |
| Consultant Reports | 69.6 | 74.4 |
| Diagnostic Test Images | 66.7 | 71.3 |
Source: American Hospital Association, Information Technology Supplement, 2012.
- Importance: Use of EHRs directly affects the communication and management of laboratory information in patient care, particularly results reporting and test order management (Henricks, 2011).
- Overall Rate: In 2013, 64.1% of hospitals had a computerized system that allows results viewing, an increase from 58.2% in 2012 (data not shown).
- Trends:
- From 2012 to 2013, among hospitals with computerized systems that allow results viewing, the percentage of hospitals with the following components increased:
- Laboratory reports, from 86.2% to 89.1%.
- Radiology reports, from 85.0% to 86.8%.
- Radiology images, from 82.3% to 84.2%.
- Diagnostic test results, from 73.9% to 77.5%.
- Consultant reports, from 69.6% to 74.4%.
- Diagnostic test images, from 66.7% to 71.3%.
- From 2012 to 2013, among hospitals with computerized systems that allow results viewing, the percentage of hospitals with the following components increased:
Hospitals With Computerized Systems That Allow Results Viewing With a Component for Diagnostic Test Results
Hospitals with computerized systems that allow results viewing with a component for diagnostic test results, by hospital type and bed size, 2013
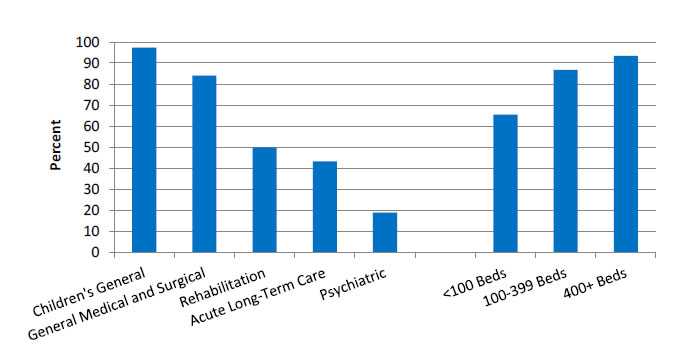
- Children's General - 97.3.
- General Medical and Surgical - 84.1.
- Rehabilitation - 50.
- Acute Long-Term Care - 43.2.
- Psychiatric - 18.8.
- <100 Beds - 65.5.
- 100-399 Beds - 86.8.
- 400+ Beds - 93.4.
- Importance: Use of EHRs directly affects the communication and management of laboratory information in patient care, particularly reporting results and test order management (Henricks, 2011).
- Differences:
- In 2013, 97.3% of children’s general, 84.1% of general medical and surgical, 50.0% of rehabilitation, 43.2% of acute long-term care, and 18.8% of psychiatric hospitals had a computerized system for results viewing with a component for diagnostic test results.
- In 2013, among hospitals with computerized systems for results viewing, the percentage with a component for diagnostic test results was highest in hospitals with more than 400 beds (93.4%), followed by hospitals with 100-399 beds (86.8%), and hospitals with fewer than 100 beds (65.5%).
Hospitals With Computerized Systems That Allow Decision Support
Hospitals with computerized systems that allow decision support, by component, 2012-2013
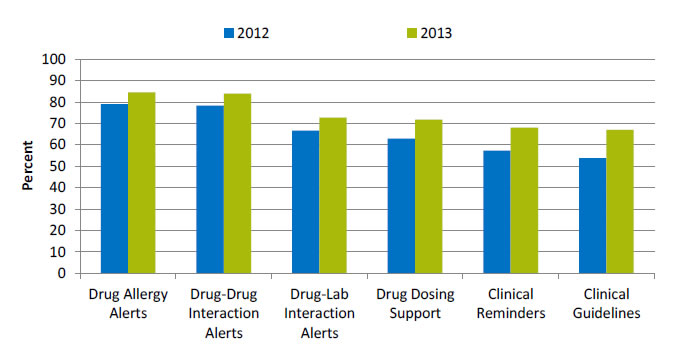
| Component | 2012 | 2013 |
|---|---|---|
| Drug Allergy Alerts | 79 | 84.5 |
| Drug-Drug Interaction Alerts | 78.3 | 83.9 |
| Drug-Lab Interaction Alerts | 66.6 | 72.7 |
| Drug Dosing Support | 62.9 | 71.8 |
| Clinical Reminders | 57.3 | 68.1 |
| Clinical Guidelines | 53.8 | 67 |
Source: American Hospital Association, Information Technology Supplement, 2012.
- Importance: Clinical decision support (CDS) systems, which provide appropriate, timely, patient-specific reminders and information, are essential to cope with the growth in medical knowledge. When implemented effectively, CDS has been shown to improve quality and can be particularly effective for increasing appropriate use of evidence-based preventive services (Wright, et al., 2015).
- Overall Rate: In 2013, 56.0% of hospitals had a computerized system for clinical decision support, an increase from 44.9% in 2012 (data not shown).
- Trends:
- From 2012 to 2013, among hospitals with computerized systems that allow clinical decision support, the percentage with the following components improved:
- Drug allergy alerts, from 79.0% to 84.5%.
- Drug-drug interaction alerts, from 78.3% to 83.9%.
- Drug-lab interaction alerts, from 66.6% to 72.7%.
- Drug dosing support, from 62.9% to 71.8%.
- Clinical reminders, from 57.3% to 68.1%.
- Clinical guidelines, from 53.8% to 67.0%.
- From 2012 to 2013, among hospitals with computerized systems that allow clinical decision support, the percentage with the following components improved:
Hospitals With Computerized Systems That Allow Decision Support With a Component for Clinical Guidelines
Hospitals with computerized systems that allow decision support with a component for clinical guidelines, by hospital control and hospital type, 2013
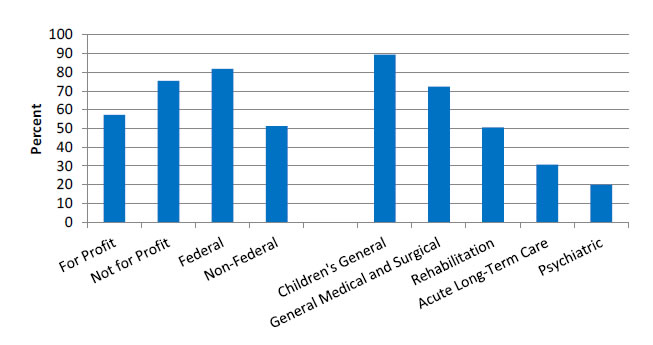
- For Profit - 57.3.
- Not for Profit - 75.4.
- Federal - 81.8.
- Non-Federal - 51.3.
- Children's General - 89.4.
- General Medical and Surgical - 72.4.
- Rehabilitation - 50.6.
- Acute Long-Term Care - 30.7.
- Psychiatric - 19.9.
Note: Non-Federal refers to government hospitals.
- Importance: CDS systems, which provide appropriate, timely, patient-specific reminders and information, are essential to cope with the growth in medical knowledge. When implemented effectively, CDS has been shown to improve quality and can be particularly effective for increasing appropriate use of evidence-based preventive services (Wright, et al.).
- Differences:
- In 2013, 57.3% of for-profit hospitals, 75.4% of not-for-profit hospitals, 81.8% of hospitals run by the Federal Government, and 51.3% of non-Federal hospitals had a component for clinical guidelines.
- In 2013, 89.4% of children’s general, 72.4% of general medical and surgical, 50.6% of rehabilitation, 30.7% of acute long-term care, and 19.9% of psychiatric hospitals had a component for clinical guidelines.
Hospitals With Computerized Systems That Allow Computerized Physician Order Entry
Hospitals with computerized systems that allow CPOE, by component, 2012-2013
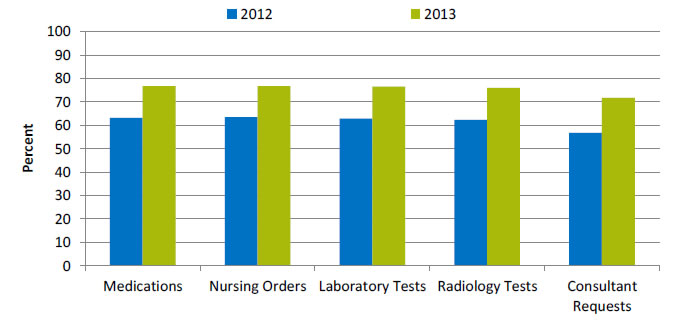
| Component | 2012 | 2013 |
|---|---|---|
| Medications | 63.2 | 76.8 |
| Nursing Orders | 63.6 | 76.8 |
| Laboratory Tests | 62.8 | 76.6 |
| Radiology Tests | 62.4 | 76 |
| Consultant Requests | 56.8 | 71.7 |
Key: CPOE = computerized provider order entry.
Source: American Hospital Association, Information Technology Supplement, 2013.
- Importance: CPOE is associated with a 13% to 99% reduction in medication errors and a 30% to 84% reduction in adverse drug events (ADEs) (Ammenwerth, et al., 2008).
- Overall Rate: In 2013, 69.9% of hospitals had a computerized system for CPOE, an increase from 55.2% in 2012 (data not shown).
- Groups With Disparities:
- From 2012 to 2013, among hospitals with computerized systems that allow CPOE, the percentage with the following components improved:
- Medications, from 63.2% to 76.8%.
- Nursing orders, from 63.6% to 76.8%.
- Laboratory tests, from 62.8% to 76.6%.
- Radiology tests, from 62.4% to 76.0%.
- Consultant requests, from 56.8% to 71.7%.
- From 2012 to 2013, among hospitals with computerized systems that allow CPOE, the percentage with the following components improved:
Hospitals With Computerized Systems That Allow Computerized Physician Order Entry With a Medication Component
Hospitals with computerized systems that allow CPOE with a component for medications, by hospital ownership and type, 2013
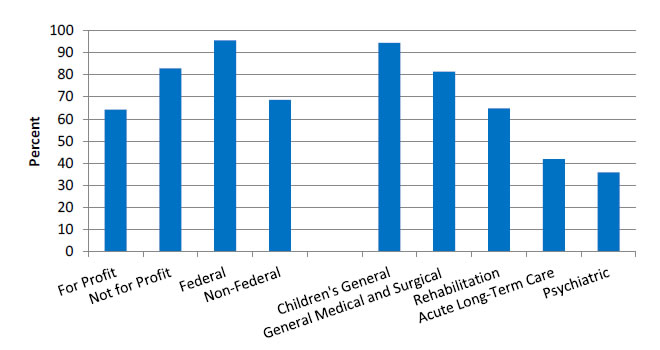
- For Profit - 64.3.
- Not for Profit - 82.9.
- Federal - 95.5.
- Non-Federal - 68.6.
- Children's General - 94.4.
- General Medical and Surgical - 81.4.
- Rehabilitation - 64.8.
- Acute Long-Term Care - 41.9.
- Psychiatric - 35.9.
Key: CPOE = computerized provider order entry.
Source: American Hospital Association, Information Technology Supplement, 2013.
Note: Non-Federal refers to government hospitals.
- Importance: CPOE is associated with a 13% to 99% reduction in medication errors and a 30% to 84% reduction in adverse drug events (ADEs) (Ammenwerth, et al., 2008).
- Differences:
- In 2013, 64.3% of for-profit hospitals, 82.5% of not-for-profit hospitals, 95.5% of hospitals run by the Federal Government, and 68.6% of non-Federal hospitals had a component for medications.
- In 2013, 94.4% of children’s general, 81.4% of general medical and surgical, 64.8% of rehabilitation, 41.9% of acute long-term care, and 35.9% of psychiatric hospitals had a component for medications.


