- Hospitalizations due to ambulatory care-sensitive conditions (ACSCs) such as hypertension and pneumonia should be largely prevented if ambulatory care is provided in a timely and effective manner.
- Evidence suggests that effective primary care is associated with lower ACSC hospitalization (also referred to as avoidable hospitalization) (Gao, et al., 2014).
Potentially avoidable hospitalization measures include:
- Potentially avoidable hospitalizations for acute and chronic conditions.
- Admissions with perforated appendix.
- Admissions with hypertension.
Potentially Avoidable Adult Hospitalizations
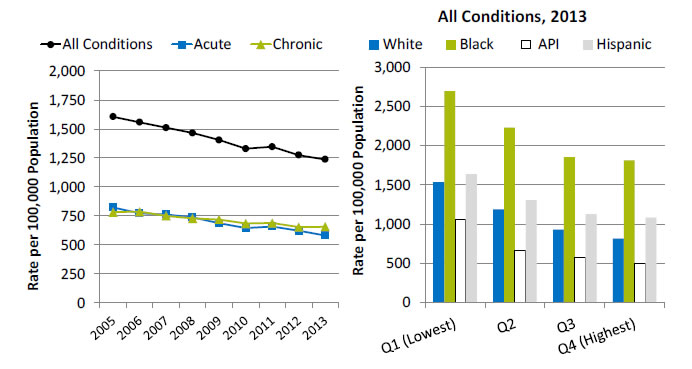
Potentially avoidable adult hospitalizations, by type of condition, 2005-2013, and by race/ethnicity, stratified by income, 2013

Left Chart:
| Conditions | 2005 | 2006 | 2007 | 2008 | 2009 | 2010 | 2011 | 2012 | 2013 |
|---|---|---|---|---|---|---|---|---|---|
| All Conditions | 1604.7 | 1556.8 | 1510.4 | 1464.3 | 1404.2 | 1329.4 | 1345.4 | 1274.1 | 1236.3 |
| Acute | 822.9 | 771.0 | 760.9 | 736.4 | 685.8 | 645.4 | 657.0 | 621.5 | 580.4 |
| Chronic | 781.8 | 785.9 | 749.5 | 728.0 | 718.4 | 684.0 | 688.4 | 652.6 | 655.9 |
Right Chart (All Conditions):
| Income | White | Black | API | Hispanic |
|---|---|---|---|---|
| Q1 (Lowest) | 1536.3 | 2695.9 | 1056.4 | 1641.5 |
| Q2 | 1187 | 2230.4 | 666.3 | 1309 |
| Q3 | 930.3 | 1855 | 580.2 | 1131.4 |
| Q4 (Highest) | 815.2 | 1810.9 | 504.2 | 1085 |
Key: API = Asian or Pacific Islander; Q = quartile of median household income of the patient's ZIP code of residence.
Source: Agency for Healthcare Research and Quality (AHRQ), Healthcare Cost and Utilization Project, Nationwide Inpatient Sample and AHRQ Quality Indicators, version 4.4, 2005-2013.
Note: For this measure, lower rates are better. White, Black, and API are non-Hispanic. Hispanic includes all races.
- Importance: Early intervention to prevent complications and address exacerbations of ambulatory care-sensitive conditions, such as diabetes, chronic obstructive pulmonary disease (COPD), asthma, and congestive heart failure, through good primary care may prevent the need for hospitalization.
- Trends:
- From 2005 to 2013, the rate of potentially avoidable hospitalizations for all conditions, excluding COPD, fell from 1,604.7 to 1,236.3 per 100,000 population.
- The rate for acute conditions decreased from 822.9 to 580.4 per 100,000 population, and the rate for chronic conditions, excluding COPD, fell from 781.8 to 655.9 per 100,000 population.
- Groups With Disparities:
- In 2013, in all income groups, rates of potentially avoidable hospitalizations for all conditions were higher for Blacks than Whites and lower for Asians and Pacific Islanders (APIs) than Whites.
- In 2013, rates if potentially avoidable hospitalizations for all conditions was 1536.3 per 100,000 population for Whites in the lowest income groups and 1810.9 per 100,000 population for Blacks in the highest income group.
Admissions With Perforated Appendix
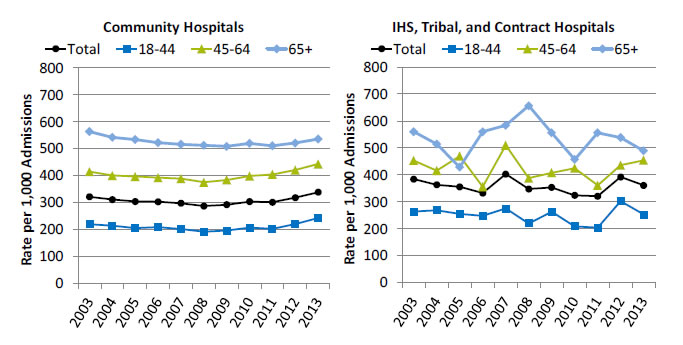
Admissions with perforated appendix in community hospitals and Indian Health Service (IHS), Tribal, and contract hospitals, by age, 2003-2013

Left Chart (Community Hospitals):
| Age | 2003 | 2004 | 2005 | 2006 | 2007 | 2008 | 2009 | 2010 | 2011 | 2012 | 2013 |
|---|---|---|---|---|---|---|---|---|---|---|---|
| Total | 321.6 | 311.5 | 303.9 | 303.4 | 297.2 | 287.3 | 292.1 | 303.8 | 301.3 | 318.1 | 338.4 |
| 18-44 | 219.8 | 214.1 | 205.5 | 208.7 | 201.8 | 191.5 | 196.1 | 206.9 | 202.4 | 220.0 | 242.4 |
| 45-64 | 414.8 | 400.3 | 397.0 | 392.4 | 389.1 | 375.4 | 384.0 | 398.7 | 404.5 | 421.0 | 443.2 |
| 65+ | 563.4 | 542.0 | 533.9 | 522.8 | 516.4 | 512.9 | 508.8 | 519.5 | 511.0 | 521.2 | 536.1 |
Source: Agency for Healthcare Research and Quality (AHRQ), Healthcare Cost and Utilization Project, Nationwide Inpatient Sample and AHRQ Quality Indicators, version 4.4, 2003-2013.
Right Chart (IHS, Tribal, and Contract Hospitals):
| Age | 2003 | 2004 | 2005 | 2006 | 2007 | 2008 | 2009 | 2010 | 2011 | 2012 | 2013 |
|---|---|---|---|---|---|---|---|---|---|---|---|
| Total | 384.4 | 363.3 | 355.8 | 332.6 | 402.7 | 347.7 | 353.4 | 324.1 | 321 | 392.1 | 360.8 |
| 18-44 | 263.6 | 268.7 | 254.8 | 247.8 | 275.4 | 219.8 | 263.5 | 208.9 | 204 | 302.2 | 253.4 |
| 45-64 | 453.2 | 415.9 | 469.8 | 356.2 | 509.7 | 387.9 | 407.9 | 424.6 | 361 | 436.1 | 454 |
| 65+ | 560 | 514.3 | 428.6 | 560 | 583.3 | 656.3 | 555.6 | 457.1 | 555.6 | 538.5 | 489.4 |
Source: Indian Health Service, Office of Information Technology/National Patient Information Reporting System, National Data Warehouse, Workload and Population Data Mart, 2003-2013.
- Importance: Appendicitis is the most common indication for an urgent intra-abdominal surgery. The misdiagnosis of appendicitis is costly in terms of patients’ pain and suffering, as well as in the cost to the hospital of extended treatments and care.
- Trends:
- From 2003 to 2013, the rate of perforated appendixes in community hospitals increased from 321.6 to 338.4 per 1,000 admissions.
- From 2003 to 2013, the rate of perforated appendixes in IHS hospitals decreased from 384.4 to 360.8 per 1,000 admissions.
- Groups With Disparities:
- In 2013, for IHS facilities, the rates of perforated appendixes for ages 45-64 and age 65 and over were higher than for those ages 18-44 (454.0 and 489.4 per 1,000 admissions, respectively, compared with 253.4 per 1,000 admissions).
- In all years, rates of perforated appendixes for males were higher than for females at non-IHS hospitals; rates were higher for males than for females in 9 of 11 years at IHS hospitals (data not shown).
Admissions With Hypertension
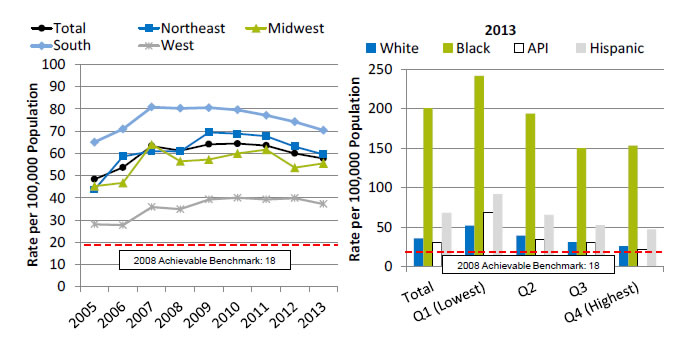
Admissions with hypertension, by region, 2005-2013, and race/ethnicity, stratified by income, 2013

Left Chart:
| Region | 2005 | 2006 | 2007 | 2008 | 2009 | 2010 | 2011 | 2012 | 2013 |
|---|---|---|---|---|---|---|---|---|---|
| Total | 48.4 | 53.7 | 63.4 | 61.2 | 64.1 | 64.4 | 63.6 | 60.1 | 57.8 |
| Northeast | 43.7 | 58.6 | 61.1 | 60.9 | 69.5 | 68.9 | 67.8 | 63.1 | 59.6 |
| Midwest | 45.3 | 46.8 | 64.1 | 56.5 | 57.3 | 60.0 | 61.7 | 53.7 | 55.6 |
| South | 65.1 | 71.0 | 80.9 | 80.3 | 80.6 | 79.6 | 77.2 | 74.3 | 70.5 |
| West | 28.1 | 27.7 | 35.9 | 35.0 | 39.3 | 40.0 | 39.3 | 39.9 | 37.3 |
Right Chart (2013):
| Income | White | Black | API | Hispanic |
|---|---|---|---|---|
| Total | 35.8 | 200.5 | 30.9 | 67.8 |
| Q1 (Lowest) | 51.9 | 241.3 | 68.3 | 91.6 |
| Q2 | 39.4 | 193.7 | 34.1 | 65.5 |
| Q3 | 31.1 | 150.1 | 30.1 | 52.4 |
| Q4 (Highest) | 25.9 | 153 | 21.8 | 47 |
2008 Achievable Benchmark: 18.
Key: API = Asian or Pacific Islander; Q = quartile of median household income of the patient's ZIP code of residence.
Source: Agency for Healthcare Research and Quality (AHRQ), Healthcare Cost and Utilization Project, Nationwide Inpatient Sample and AHRQ Quality Indicators, version 4.4, 2005-2013.
Note: For this measure, lower rates are better. White, Black, and API are non-Hispanic. Hispanic includes all races.
- Importance: Hypertensive emergency is a condition that affects approximately 1% of all patients with chronic hypertension (Kuppasani & Reddi, 2010). Among hypertensive individuals, in 2011-2012, only 51.9% had their blood pressure controlled to below 140/90 mmHg (Nwankwo, et al., 2013). Hypertension is an important risk factor for cardiovascular diseases, and uncontrolled hypertension is present in 69% of patients with a first myocardial infarction, 77% with a first stroke, and 74% with chronic heart failure (Aronow, 2012).
- Trends:
- From 2005 to 2013, the overall rate of avoidable admissions for hypertension increased from 48.4 to 57.8 per 100,000 population.
- From 2005 to 2013, rates of avoidable admission for hypertension got worse for residents of the Northeast, Midwest, and West. There were no statistically significant changes for residents of the South.
- Groups With Disparities:
- Overall in 2013, rates of avoidable admission for hypertension were higher for Blacks and Hispanics than for Whites (200.5 and 67.8, respectively, compared with 35.8 per 100,000 population). Rates were lower for API s compared with Whites (30.9 vs. 35.8 per 100,000 population).
- In 2013, in all income groups, rates of avoidable admission for hypertension were higher for Blacks and Hispanics than for Whites. There were no statistically significant differences by income between APIs and Whites.
- Achievable Benchmark:
- The 2011 top 4 State achievable benchmark was 18%. The top 4 States that contributed to the achievable benchmark are Montana, Oregon, Utah, and Vermont.
- No group is making progress toward the benchmark.


