National Healthcare Quality and Disparities Report
Adult Hospital Patients Who Reported Poor Communication With Doctors and Nurses
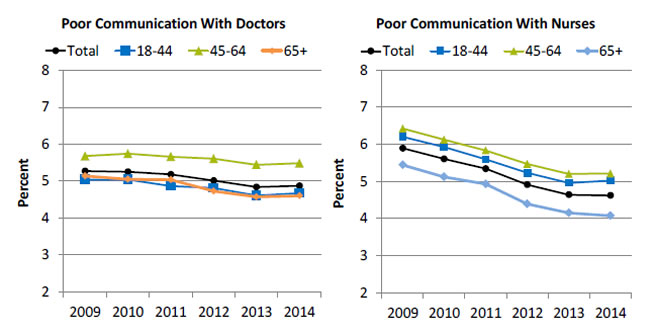
Adult hospital patients who reported poor communication with doctors and nurses, by age, 2009-2014

Left Chart (Poor Communication With Doctors):
| Age | 2009 | 2010 | 2011 | 2012 | 2013 | 2014 |
|---|---|---|---|---|---|---|
| Total | 5.3 | 5.3 | 5.2 | 5.0 | 4.8 | 4.9 |
| 18-44 | 5.0 | 5.0 | 4.9 | 4.8 | 4.6 | 4.7 |
| 45-64 | 5.7 | 5.7 | 5.7 | 5.6 | 5.4 | 5.5 |
| 65+ | 5.1 | 5.0 | 5.0 | 4.7 | 4.6 | 4.6 |
Right Chart (Poor Communication With Nurses):
| Age | 2009 | 2010 | 2011 | 2012 | 2013 | 2014 |
|---|---|---|---|---|---|---|
| Total | 5.9 | 5.6 | 5.3 | 4.9 | 4.6 | 4.6 |
| 18-44 | 6.2 | 5.9 | 5.6 | 5.2 | 5.0 | 5.0 |
| 45-64 | 6.4 | 6.1 | 5.8 | 5.5 | 5.2 | 5.2 |
| 65+ | 5.4 | 5.1 | 4.9 | 4.4 | 4.2 | 4.1 |
Source: Agency for Healthcare Research and Quality, Hospital CAHPS® (Consumer Assessment of Healthcare Providers and Systems) Survey, 2009-2014.
Note: For this measure, lower rates are better. Poor communication is defined as responded sometimes or never to the set of survey questions: "During this hospital stay, how often did doctors/nurses treat you with courtesy and respect?" "During this hospital stay, how often did doctors/nurses listen carefully to you?" and "During this hospital stay, how often did doctors/nurses explain things in a way you could understand?"
- Overall Rate: The percentage of patients reporting poor communication with doctors and nurses has decreased over time.
- Trends: From 2009 to 2014, the percentage of patients reporting poor communication significantly decreased among all age groups.
- Communication with doctors:
- 18-44 years: 5.0% to 4.7%.
- 45-64 years: 5.7% to 5.5%.
- 65 and over: 5.1% to 4.6%.
- Communication with nurses:
- 18-44 years: 6.2% to 5.0%.
- 45-64 years: 6.4% to 5.2%.
- 65 and over: 5.4% to 4.1%.
- Communication with doctors:
- Groups With Disparities:
- In 2014, hospital patients ages 45-64 years were significantly more likely to report poor communication with doctors compared with patients ages 18-44 years. There was no statistically significant difference between patients age 65 and over and those ages 18-44.
- In 2014, hospital patients age 65 and over were significantly less likely to report poor communication with nurses compared with patients ages 18-44 years. There was no statistically significant difference between patients ages 45-64 years and those ages 18-44.


