National Healthcare Quality and Disparities Report
- The increasing prevalence of chronic diseases has placed more responsibility on patients, since conditions such as diabetes and hypertension require self-management.
- Patients need to be provided with information that allows them to make educated decisions and feel engaged in their treatment.
- Treatment plans also need to incorporate patients’ values and preferences.
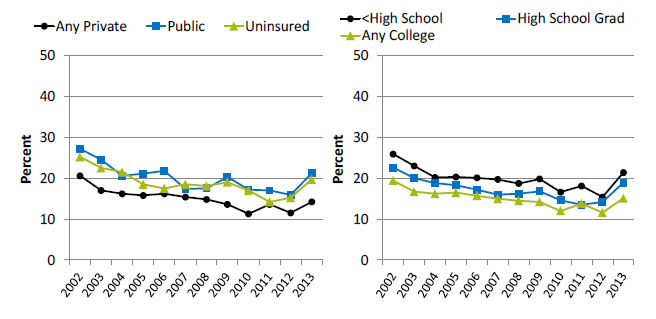
Providers Asking Patients To Assist in Making Treatment Decisions, by Insurance and Education
People with a usual source of care who sometimes or never asked the person to help make decisions when there was a choice between treatments, by insurance (under age 65) and education (age 18 and over), 2002-2013

Left Chart:
| Insurance | 2002 | 2003 | 2004 | 2005 | 2006 | 2007 | 2008 | 2009 | 2010 | 2011 | 2012 | 2013 |
|---|---|---|---|---|---|---|---|---|---|---|---|---|
| Any Private | 20.6 | 17 | 16.2 | 15.8 | 16.2 | 15.4 | 14.8 | 13.6 | 11.3 | 13.6 | 11.5 | 14.2 |
| Public | 27.2 | 24.5 | 20.6 | 21.1 | 21.8 | 17.4 | 17.5 | 20.3 | 17.2 | 17 | 15.9 | 21.2 |
| Uninsured | 25.2 | 22.5 | 21.5 | 18.5 | 17.5 | 18.5 | 18.1 | 19 | 17 | 14.2 | 15.2 | 19.7 |
Right Chart:
| Education | 2002 | 2003 | 2004 | 2005 | 2006 | 2007 | 2008 | 2009 | 2010 | 2011 | 2012 | 2013 |
|---|---|---|---|---|---|---|---|---|---|---|---|---|
| Less than High School | 25.9 | 23 | 20.2 | 20.3 | 20.1 | 19.7 | 18.7 | 19.8 | 16.6 | 18.1 | 15.4 | 21.4 |
| High School Grad | 22.6 | 20 | 18.8 | 18.3 | 17.2 | 16 | 16.2 | 16.8 | 14.6 | 13.5 | 14.2 | 18.9 |
| Any College | 19.4 | 16.7 | 16.2 | 16.5 | 15.7 | 15 | 14.5 | 14.2 | 12 | 13.8 | 11.6 | 15.1 |
Source: Agency for Healthcare Research and Quality, Medical Expenditure Panel Survey, 2002-2013.
Note: Less than high school refers to fewer than 12 years of education; high school graduate, 12 years of education; and any college, more than 12 years of education.
- Trends: From 2002 to 2013, the percentage of people with a usual source care who sometimes or never asked the person to help make treatment decisions significantly decreased for all insurance groups (under age 65) and education groups (age 18 and over).
- Insurance:
- Any private: 20.6% to 14.2%.
- Public: 27.2% to 21.2%.
- Uninsured: 25.2% to 19.7%.
- Education:
- Less than high school: 25.9% to 21.4%.
- High school graduate: 22.6% to 18.9%.
- Any college: 19.4% to 15.1%.
- Insurance:
- Groups With Disparities:
- In 2013, among adults ages 18-64, those who were uninsured and those with public insurance were more likely than those with private insurance to report that their health providers sometimes or never asked for their help to make treatment decisions.
- In 2013, adults with less than a high school education and high school graduates were more likely than those with any college education to report that their health providers sometimes or never asked for their help to make treatment decisions.
- In all years from 2002 to 2013, among adults age 18 and over, those with less than a high school education were significantly more likely than those with any college education to have a usual source of care who sometimes or never asked the person to help make treatment decisions.
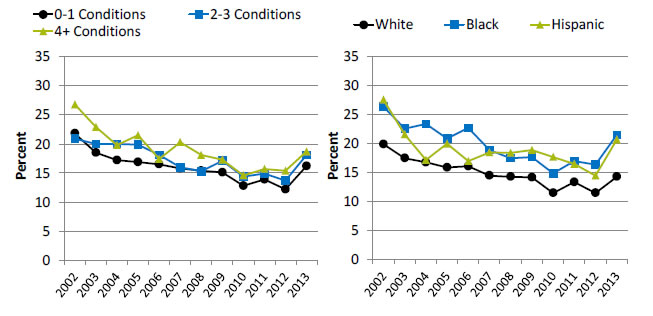
Providers Asking Patients To Assist in Making Treatment Decisions, by Number of Chronic Conditions and Ethnicity
People with a usual source of care who sometimes or never asked the person to help make decisions when there was a choice between treatments, by number of chronic conditions (age 18 and over) and ethnicity, 2002-2013

Left Chart:
| # of chronic conditions | 2002 | 2003 | 2004 | 2005 | 2006 | 2007 | 2008 | 2009 | 2010 | 2011 | 2012 | 2013 |
|---|---|---|---|---|---|---|---|---|---|---|---|---|
| 0-1 Conditions | 21.8 | 18.5 | 17.2 | 16.9 | 16.5 | 15.8 | 15.4 | 15.1 | 12.8 | 13.9 | 12.2 | 16.2 |
| 2-3 Conditions | 20.9 | 20 | 20 | 19.9 | 18.1 | 16 | 15.3 | 17.1 | 14.4 | 14.9 | 13.7 | 18.1 |
| 4+ Conditions | 26.8 | 22.9 | 19.8 | 21.5 | 17.4 | 20.3 | 18.1 | 17.3 | 14.6 | 15.7 | 15.4 | 18.7 |
Right Chart:
| Ethnicity | 2002 | 2003 | 2004 | 2005 | 2006 | 2007 | 2008 | 2009 | 2010 | 2011 | 2012 | 2013 |
|---|---|---|---|---|---|---|---|---|---|---|---|---|
| White | 19.9 | 17.5 | 16.8 | 15.9 | 16.1 | 14.5 | 14.3 | 14.2 | 11.5 | 13.4 | 11.5 | 14.3 |
| Black | 26.4 | 22.6 | 23.4 | 20.9 | 22.7 | 18.9 | 17.5 | 17.7 | 14.9 | 17 | 16.4 | 21.5 |
| Hispanic | 27.6 | 21.6 | 17.2 | 20 | 17 | 18.5 | 18.4 | 18.9 | 17.7 | 16.5 | 14.5 | 20.7 |
Source: Agency for Healthcare Research and Quality, Medical Expenditure Panel Survey, 2002-2013.
Note: For this measure, lower rates are better. White and Black are non-Hispanic. Hispanic includes all races.
- Trends: From 2002 to 2013, the percentage of people with a usual source of care who sometimes or never asked the person to help make treatment decisions significantly decreased for all chronic condition and ethnicity groups.
- Number of chronic conditions:
- 0-1 chronic conditions: 21.8% to 16.2%.
- 2-3 chronic conditions: 20.9% to 18.1%.
- 4+ chronic conditions: 26.8% to 18.7%.
- Ethnicity:
- Whites: 19.9% to 14.3%.
- Blacks: 26.4% to 21.5%.
- Hispanics: 27.6% to 20.7%.
- Number of chronic conditions:
- Groups With Disparities:
- In 2013, among adults age 18 and over with a usual source of care, people with 4 or more chronic conditions were significantly less likely than those with 0 or 1 condition to be involved in their treatment decisions.
- In all years from 2002 to 2013, among people with a usual source of care, Blacks were more likely than Whites to be involved in their treatment decisions.
- In all but 2 years from 2002 to 2013, among people with a usual source of care, Hispanics were more likely than Whites to be involved in their treatment decisions.


