National Healthcare Quality and Disparities Report
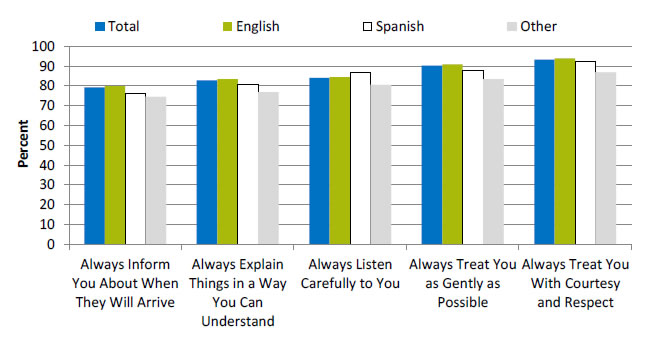
Provider-Patient Communication Among Adults Receiving Home Health Care, by Language
Provider-patient communication among adults receiving home health care, by language spoken at home, 2014

| Language | Always Inform You About When They Will Arrive | Always Explain Things in a Way You Can Understand | Always Listen Carefully to You | Always Treat You as Gently as Possible | Always Treat You With Courtesy and Respect |
|---|---|---|---|---|---|
| Total | 79.2 | 82.7 | 84.0 | 90.1 | 93.2 |
| English | 79.8 | 83.4 | 84.4 | 90.7 | 93.9 |
| Other | 74.4 | 76.7 | 80.4 | 83.3 | 86.8 |
| Spanish | 76.1 | 80.6 | 86.6 | 87.6 | 92.4 |
Source: Centers for Medicare & Medicaid Services, Home Health Care CAHPS® (Consumer Assessment of Healthcare Providers and Systems) Survey, 2014.
Denominator: Adults who had at least two visits from a Medicare-certified home health agency during a 2-month look-back period.
Note: Patients receiving hospice care and those who had "maternity" as the primary reason for receiving home health care are excluded.
- Groups With Disparities:
- In 2014, compared with English speakers, adults speaking Spanish or another language at home were significantly less likely to:
- Always be informed about when their provider would arrive.
- Always have things explained in a way that was easy to understand.
- Always be treated as gently as possible.
- Always be treated with courtesy and respect.
- Adults speaking a language other than English or Spanish were less likely than adults speaking English at home to report that home health providers always listened carefully to them.
- Adults speaking Spanish at home were more likely than adults speaking English at home to report that home health providers always listened carefully to them.
- In 2014, compared with English speakers, adults speaking Spanish or another language at home were significantly less likely to:
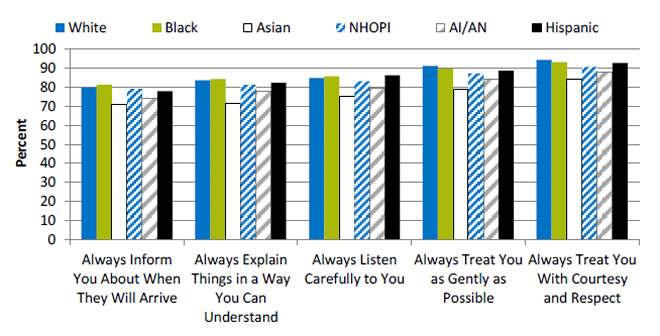
Provider-Patient Communication Among Adults Receiving Home Health Care, by Race/Ethnicity
Provider-patient communication among adults receiving home health care, by race/ethnicity, 2014

| Race / Ethnicity | Always Inform You About When They Will Arrive | Always Explain Things in a Way You Can Understand | Always Listen Carefully to You | Always Treat You as Gently as Possible | Always Treat You With Courtesy and Respect |
|---|---|---|---|---|---|
| AI/AN | 73.8 | 77.6 | 79.1 | 84.2 | 87.7 |
| Asian | 70.9 | 71.6 | 75.1 | 78.8 | 83.8 |
| Black | 81.2 | 84.1 | 85.6 | 89.6 | 92.9 |
| NHOPI | 79.0 | 81.1 | 82.9 | 87.0 | 90.5 |
| White | 79.7 | 83.5 | 84.7 | 91.0 | 94.1 |
| Hispanic | 77.8 | 82.1 | 86.1 | 88.4 | 92.6 |
Key: AI/AN = American Indian or Alaska Native; NHOPI = Native Hawaiian or Other Pacific Islander.
Source: Centers for Medicare & Medicaid Services, Home Health Care CAHPS® (Consumer Assessment of Healthcare Providers and Systems) Survey, 2014.
Denominator: Adults who had at least two visits from a Medicare-certified home health agency during a 2-month look-back period.
Note: Patients receiving hospice care and those who had "maternity" as the primary reason for receiving home health care are excluded.
- Groups With Disparities: In 2014, among home health care patients, compared with Whites:
- Asians and American Indians and Alaska Natives (AI/ANs) were significantly less likely to always be informed about when their provider would arrive.
- Asians, AI/ANs, and Native Hawaiians and Other Pacific Islanders (NHOPIs) were significantly less likely to always have things explained in a way that was easy to understand.
- Asians, AI/ANs, and NHOPIs were significantly less likely to always be listened to carefully. Hispanics were more likely to always be listened to carefully.
- Blacks, Asians, NHOPIs, AI/ANs, and Hispanics were significantly less likely to always be treated as gently as possible.
- Blacks, Asians, NHOPIs, AI/ANs, and Hispanics were significantly less likely to always be treated with courtesy and respect.


