Mindfulness: Engaging Frontline Providers in Antimicrobial Stewardship
Slide Presentation
Slide 1

Mindfulness: Engaging Frontline Providers in Antimicrobial Stewardship
CAPT Arjun Srinivasan, MD
Associate Director for Healthcare
Associated Infection Prevention Programs
Division of Healthcare Quality Promotion
Scott Flanders, MD
Professor of Medicine
Director, Hospital Medicine Program
Director, Hospital Medicine Safety Consortium
University of Michigan
Images: Photos of the 2 presenters.
Slide 2
Learning Objectives
- Identify the barriers and facilitators to engaging frontline providers in antibiotic stewardship
- Describe how to integrate antimicrobial prescribing into unit culture
- Discuss the importance of improving antibiotic use at the national level
Slide 3

Antibiotic Stewardship: Why We Must, How We Can
CAPT Arjun Srinivasan, MD
Associate Director for Healthcare
Associated Infection Prevention Programs
Division of Healthcare Quality Promotion
Image: Photo of Dr. Srinivasan. On bottom right of slide is the CDC logo.
Slide 4
Polling Question
“Does your hospital currently have an antibiotic stewardship program?”
__ Yes
__ No
Slide 5
Why We Have to Improve Antibiotic Use
- Antibiotics are unlike any other drug, in that the use of the agent in one patient can compromise its efficacy in another.
- A lot of in-patient antibiotic prescriptions are unnecessary or sub-optimal.
- We are running out of antibiotics.
- We won’t get new ones soon.
- Antibiotic overuse contributes to huge threats to the safety of our patients.
Slide 6
Antibiotic Misuse Adversely Impacts Patients - C. difficile
- Antibiotic exposure is the single most important risk factor for the development of Clostridium difficile:
1. Hensgens MPJ Antimicrob Chemother. 2011 Dec 6.
2. Chang HT et al. Infect Control Hosp Epidemiol 2007; 28:926–931.
Slide 7
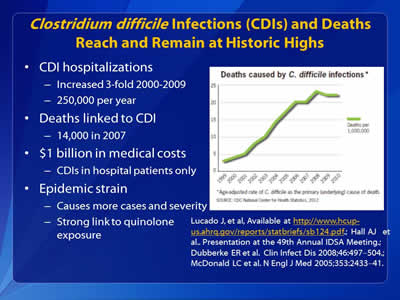
Clostridium difficile Infections (CDIs) and Deaths Reach and Remain at Historic Highs
- CDI hospitalizations:
- Increased 3-fold 2000-2009
- 250,000 per year
- Deaths linked to CDI:
- 14,000 in 2007
- $1 billion in medical costs:
- CDIs in hospital patients only
- Epidemic strain:
- Causes more cases and severity
- Strong link to quinolone exposure
Lucado J, et al, Available at http://www.hcup-us.ahrq.gov/reports/statbriefs/sb124.pdf.; Hall AJ et al.. Presentation at the 49th Annual IDSA Meeting.; Dubberke ER et al. Clin Infect Dis 2008;46:497–504.; McDonald LC et al. N Engl J Med 2005;353:2433–41.
Slide 8

Antibiotic Misuse Adversely Impacts Patients - Adverse Events
- In 2008, there were 142,000 visits to emergency departments for adverse events attributed to antibiotics.
Shehab N et al. Clinical Infectious Diseases 2008;15:735-43.
Slide 9

Antibiotic Exposure Increases the Risks of Resistance
| Pathogen and Antibiotic Exposure | Increased Risk |
|---|---|
| Carbapenem Resistant Enterobactericeae and Carbapenems | 15 fold 1 |
| ESBL producing organisms and Cephalosporins | 6-29, fold 3, 4 |
Patel G et al. Infect Control Hosp Epidemiol 2008;29:1099-1106.
Zaoutis TE et al. Pediatrics 2005;114:942-9.
Talon D et al. Clin Microbiol Infect 2000;6:376-84.
Slide 10
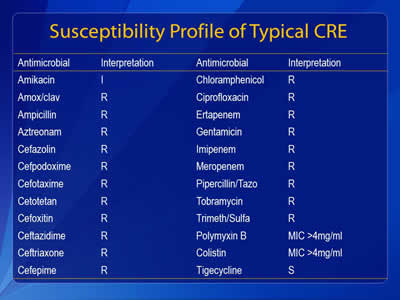
Susceptibility Profile of Typical CRE
| Antimicrobial | Interpretation |
|---|---|
| Amikacin | I |
| Amox/clav | R |
| Ampicillin | R |
| Aztreonam | R |
| Cefazolin | R |
| Cefpodoxime | R |
| Cefotaxime | R |
| Cetotetan | R |
| Cefoxitin | R |
| Ceflazidime | R |
| Ceftazidime | R |
| Ceftriaxone | R |
| Cefepime | R |
| Chloroamphenicol | R |
| Ciprofloxacin | R |
| Ertapanem | R |
| Gentamicin | R |
| Imipenem | R |
| Meropenem | R |
| Pipercillin/Tazo | R |
| Tobramycin | R |
| Trimeth/Sulfa | R |
| Polymyxin B | MIC >4mg/ml |
| Colistine | MIC >4mg/ml |
| Tigecycline | S |
Slide 11
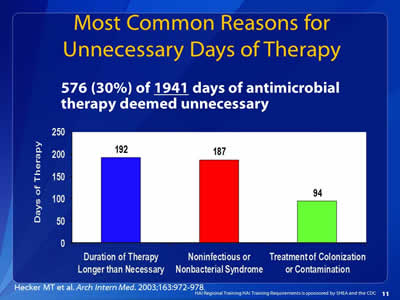
Most Common Reasons for Unnecessary Days of Therapy
576 (30%) of 1941 days of antimicrobial therapy deemed unnecessary
Image: Bar chart showing the most common reasons for unnecessary days of therapy:
Duration of Therapy Longer Than Necessary: 192
Noninfectious or Nonbacterial Syndrome: 187
Treatment of Colonization or Contamination: 94
Hecker MT et al. Arch Intern Med. 2003;163:972-978.
Slide 12
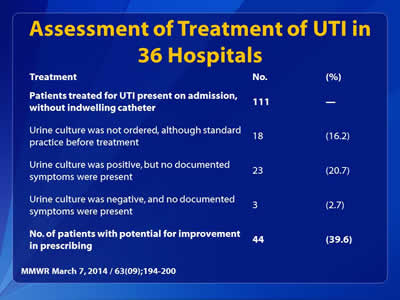
Assessment of Treatment of UTI in 36 Hospitals
| Treatment | No. | (%) |
|---|---|---|
| Patients treated for UTI present on admission, without indwelling catheter | 111 | - |
| Urine culture was not ordered, although standard practice before treatment | 18 | (16.2) |
| Urine culture was positive, but no documented symptoms were present | 23 | (20.7) |
| Urine culture was positive, but no documented symptoms were present | 3 | (2.7) |
| No. of patients with potential for improvement in prescribing | 44 | (39.6) |
MMWR March 7, 2014 / 63(09);194-200
Slide 13
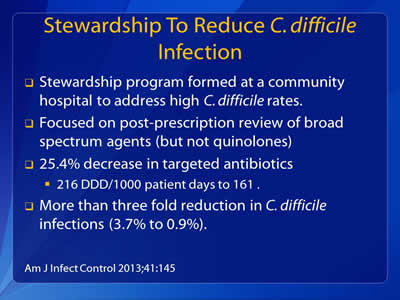
Stewardship To Reduce C. difficile Infection
- Stewardship program formed at a community hospital to address high C. difficile rates.
- Focused on post-prescription review of broad spectrum agents (but not quinolones)
- 25.4% decrease in targeted antibiotics:
- 216 DDD/1000 patient days to 161.
- More than three fold reduction in C. difficile infections (3.7% to 0.9%).
Am J Infect Control 2013;41:145
Slide 14
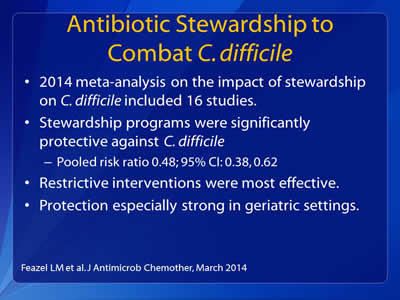
Antibiotic Stewardship to Combat C. difficile
- 2014 meta-analysis on the impact of stewardship on C. difficile included 16 studies.
- Stewardship programs were significantly protective against C. difficile:
- Pooled risk ratio 0.48; 95% CI: 0.38, 0.62
- Restrictive interventions were most effective.
- Protection especially strong in geriatric settings.
Feazel LM et al. J Antimicrob Chemother, March 2014
Slide 15

P. aeruginosa Susceptibilities Before and After Implementation of Antibiotic Restrictions
(CID 1997;25:230)
Image: Bar chart showing susceptibilities before and after implementation of antibiotic restrictions for 5 antibiotics: Ticar/clav, Imipenem, Aztreonam, Cefta and Cipro. Results show increases for all of them (p<0.01 for all increases).
Slide 16
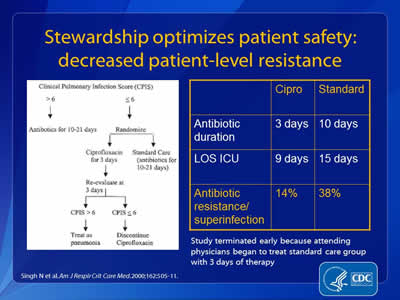
Stewardship Optimizes Patient Safety: Decreased Patient-level Resistance
Image on left side of slide: Decision tree on whether to use ciprofloxacin or discontinue it.
| Cipro | Standard | |
|---|---|---|
| Antibiotic duration | 3 days | 10 days |
| LOS ICU | 9 days | 15 days |
| Antibiotic resistance/superinfection | 14% | 38% |
Study terminated early because attending physicians began to treat standard care group with 3 days of therapy.
Singh N et al. Am J Respir Crit Care Med. 2000;162:505-11.
Slide 17
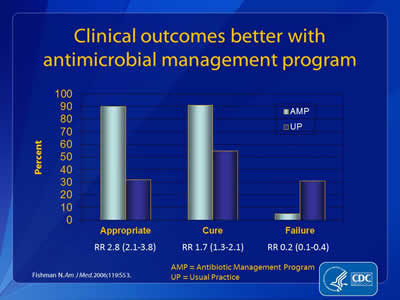
Clinical Outcomes Better With Antimicrobial Management Program
Image: Bar chart showing results of better antimicrobial management.
| Outcome | AMP | UP |
|---|---|---|
| Appropriate (RR 2.8 (2.1-3.8)) | 90% | 31% |
| Cure (RR 1.7 (1.3-2.1)) | 90% | 55% |
| Failure (RR 0.2 (0.1-0.4)) | 5% | 30% |
AMP = Antibiotic Management Program
UP = Usual Practice
Fishman N. Am J Med. 2006;119:S53.
Slide 18
What is “Antibiotic Stewardship”?
- Ensuring that every patient gets:
- An antibiotic only when one is needed
- The right agent
- At the right dose
- For the right duration
Slide 19
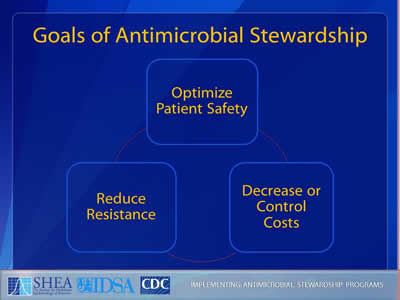
Goals of Antimicrobial Stewardship
- Optimize Patient Safety
- Reduce Resistance
- Decrease or Control Costs
Images: Logos of SHEA (The Society for Healthcare Epidemiology of America), IDSA, and CDC are shown on the bottom of the slide.
Slide 20
Goals of Stewardship
- Reducing antibiotic use and saving money are NOT the primary goals of antibiotic stewardship.
- They simply happen to be desirable side effects.
Slide 21

Changing the Way We Think About Antibiotic Stewardship
- A lesson learned from experience with infection control.
- Infection prevention works best when it’s viewed as everyone’s responsibility with healthcare epidemiology and infection control as a resource to help.
- Stewardship should be the same- it’s not something someone does “to you” or “for you.”
Slide 22
Re-Thinking the Model
- The goal of the stewardship program is not to dictate antibiotic choices.
- It’s to ensure that there are systems and support to help every provider use antibiotics optimally.
- For this to work, every provider has to play a role in stewardship.
Slide 23

Changing the Way We Think About Antibiotic Stewardship
- We need other groups to assume leadership roles in stewardship:
- Hospitalists- pneumonia, urinary tract infections, skin and soft tissue infections
- Intensivists- antibiotic use in critical care
- Surgeons- surgical prophylaxis and surgical site infections
- Stewardship efforts are most effective when they are a partnership between the stewardship team and clinicians.
Slide 24
Core Elements for Antibiotic Stewardship Programs
- Leadership commitment from administration
- Single leader responsible for outcomes
- Single pharmacy leader
- Antibiotic use tracking
- Regular reporting on antibiotic use and resistance
- Educating providers on use and resistance
- Specific improvement interventions
Slide 25
Interventions to Improve Use
- Ultimately, specific interventions to improve the use of antibiotics are where the rubber meets the road for stewardship programs.
Slide 26

Stewardship Opportunities in UTI
| Study | Patient Population | Lack of Adherence to Guidelines |
|---|---|---|
| Dalen, 2005 | Ottawa Hospital: 29 patients with catheter associated ASB | 52% prescribed antimicrobials inappropriately |
| Gandhi, 2009 | U Michigan: 49 patients with UTI diagnosed |
32.6% did not meet criteria for UTI (most due to lack of symptoms) |
| Cope, 2009 | Houston VA: 164 episodes of catheter associated ASB | 32% prescribed antimicrobials inappropriately |
Dalen DM et al. Can J Infect Dis Med Microbiol. 2005;16:166.
Gandhi T et al. Infect Control Hosp Epidemiol. 2009;30:193.
Cope M et al. Clin Infect Dis. 2009;48:1182
Slide 27
Improving UTI Treatment
- Hospital conducted a simple educational campaign on when and when not to send urine cultures and when and when not to treat positive urine cultures.
- Significant drop in number of patients who got inappropriate empiric therapy: 13% post intervention vs. 31% pre-intervention.
Slide 28
CAUTI and Antibiotic Stewardship: A Perfect Combination
Efforts at CAUTI prevention often entail:
- Improving urine culturing practices:
- Only send cultures when there is a real suspicion of a UTI.
- Send the cultures the right way
- Eliminating treatment of asymptomatic bacteruria.
- These are certainly goals shared by the stewardship team.
Slide 29

Engaging Frontline Providers in Antimicrobial Stewardship: Barriers and Facilitators
Scott A. Flanders, M.D.
Professor of Medicine
Director, Hospital Medicine Program
Director, Hospital Medicine Safety Consortium
University of Michigan
Image: Logo of the University of Michigan Health System on bottom right side of slide.
Slide 30
Why Frontline Providers?
- Stewardship team has limited reach
- “Top-down” initiatives important, but only step 1:
- Formulary restriction
- Data Monitoring
- Many practices needing change are hard to spot from “behind the front”:
- Treatment of asymptomatic bacteriuria!
- Prolonged treatment duration
- Not everyone has a robust stewardship program
Slide 31
Who Should We Engage?
- Groups where “culture” drives practice:
- Intensive Care Units
- Urology
- Orthopedic surgery, etc.
- Non-physician team members:
- PAs, NPs, nursing, clerical assistants
- Patients:
- Infection prevention (hand hygiene, device use)
- Indication, duration
- HOSPITALISTS
Slide 32
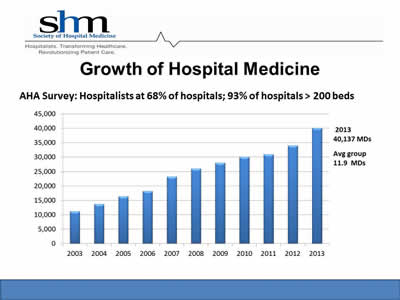
Growth of Hospital Medicine
AHA Survey: Hospitalists at 68% of hospitals; 93% of hospitals > 200 beds
Image: Bar chart showing growth of hospitalists from 2003 (~10,500) to 2013 (~40,000)
2013: 40,1347 MDs
Average group: 11.9 MDs
Logo SHM (Society of Hospital Medicine) at top of slide.
Slide 33
The “Culture” of Antibiotic Overuse
- Hospitalized patients are ill:
- Early, appropriate antibiotics are life saving
- “Chagrin” factor:
- Avoid chagrin of not treating an infection
- Overuse viewed as better than underuse
- Individual vs. Society:
- Physicians prioritize individual patient needs
- Good News!
- You can have your cake and eat it too!
- You can meet all the “needs” of physicians AND improve the way antibiotics are used
Slide 34
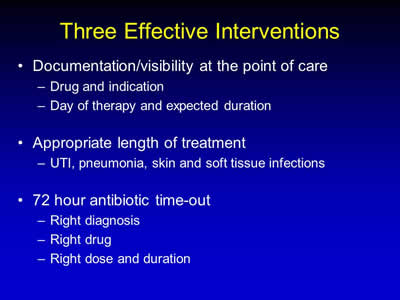
Three Effective Interventions
- Documentation/visibility at the point of care:
- Drug and indication
- Day of therapy and expected duration
- Appropriate length of treatment:
- UTI, pneumonia, skin and soft tissue infections
- 72 hour antibiotic time-out:
- Right diagnosis
- Right drug
- Right dose and duration
Slide 35
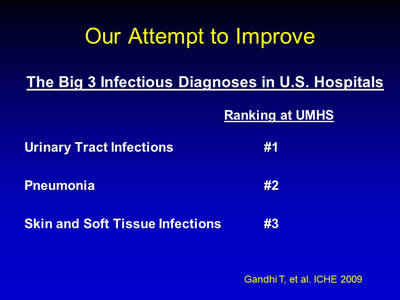
Our Attempt to Improve
The Big 3 Infectious Diagnoses in U.S. Hospitals
Ranking at UMHS
Urinary Tract Infections: #1
Pneumonia: #2
Skin and Soft Tissue Infections: #3
Gandhi T, et al. ICHE 2009
Slide 36
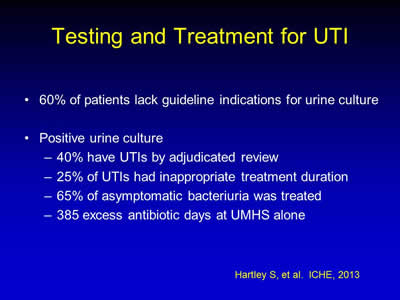
Testing and Treatment for UTI
- 60% of patients lack guideline indications for urine culture
- Positive urine culture:
- 40% have UTIs by adjudicated review
- 25% of UTIs had inappropriate treatment duration
- 65% of asymptomatic bacteriuria was treated
- 385 excess antibiotic days at UMHS alone
Hartley S, et al. ICHE, 2013
Slide 37
Polling Question
Does your hospital have guidelines that describe appropriate criteria for ordering urine cultures?
- Yes
- No
Slide 38
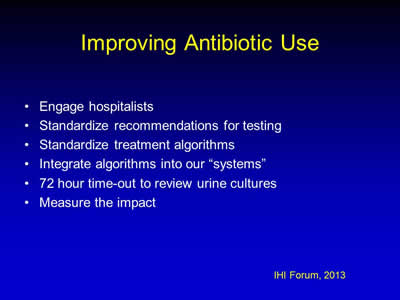
Improving Antibiotic Use
- Engage hospitalists
- Standardize recommendations for testing
- Standardize treatment algorithms
- Integrate algorithms into our “systems”
- 72 hour time-out to review urine cultures
- Measure the impact
IHI Forum, 2013
Slide 39
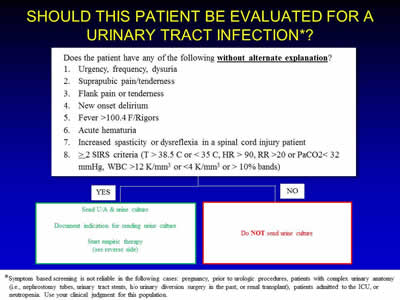
Should This Patient Be Evaluated For a Urinary Tract Infection?*
*Symptom based screening is not reliable in the following cases: pregnancy, prior to urologic procedures, patients with complex urinary anatomy (i.e., nephrostomy tubes, urinary tract stents, h/o urinary diversion surgery in the past, or renal transplant), patients admitted to the ICU, or neutropenia. Use your clinical judgment for this population.
Image: Flowchart showing criteria for whether a patient should be evaluated for a urinary tract infection.
Slide 40
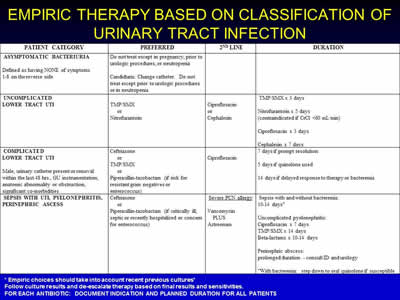
Empiric Therapy Based on Classification of Urinary Tract Infection
Image: Chart showing patient categories and preferred classification, including preferred therapies.
* Empiric choices should take into account recent previous cultures*
Follow culture results and de-escalate therapy based on final results and sensitivities..
For each antibiotic: document indication and planned duration for all patients
Slide 41
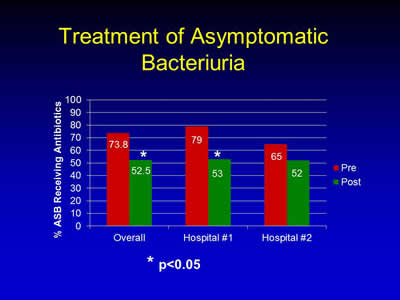
Treatment of Asymptomatic Bacteriuria
Image: Bar chart showing the percent ASB receiving antibiotics before and after intervention.
| Pre | Post | |
|---|---|---|
| Overall | 73.8% | 52.5% |
| Hospital #1 | 79% | 53% |
| Hospital #2 | 65% | 52% |
* p<0.05
Slide 42
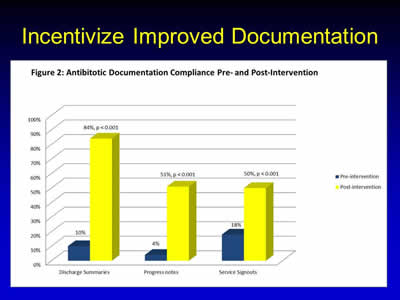
Incentivize Improved Documentation
Image: Bar graph showing antibiotic documentation compliance with increased post-intervention. Variables include percent of discharge summaries, progress notes, and service signouts.
Slide 43
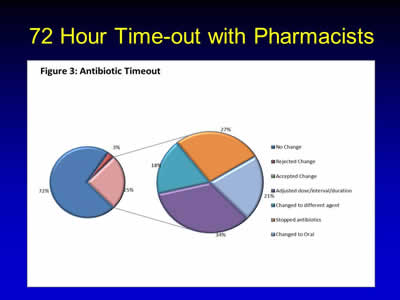
72 Hour Time-out with Pharmacists
Image: Two pie charts showing the effect of an antibiotic timeout with pharmacists -one before intervention, and one after. Results show a lower rate of prescription or adjusted dosages.
Slide 44
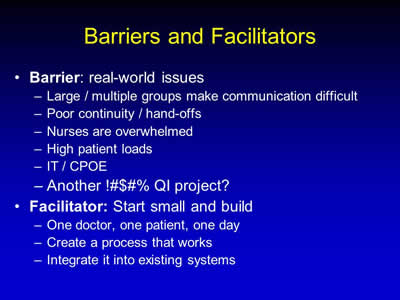
Barriers and Facilitators
- Barrier: real-world issues:
- Large / multiple groups make communication difficult
- Poor continuity / hand-offs
- Nurses are overwhelmed
- High patient loads
- IT / CPOE
- Another !#$#% QI project?
- Facilitator: Start small and build:
- One doctor, one patient, one day
- Create a process that works
- Integrate it into existing systems
Slide 45
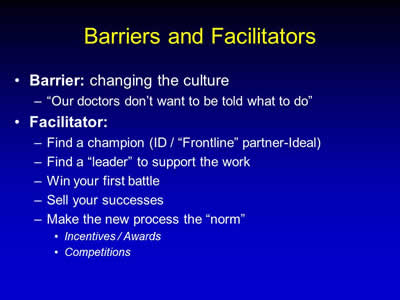
Barriers and Facilitators
- Barrier: changing the culture:
- “Our doctors don’t want to be told what to do”
- Facilitator:
- Find a champion (ID / “Frontline” partner-Ideal)
- Find a “leader” to support the work
- Win your first battle
- Sell your successes
- Make the new process the “norm”
- Incentives / Awards
- Competitions
Slide 46

Thank you!
Questions?
Slide 47
Funding
Prepared by the Health Research & Educational Trust of the American Hospital Association with contract funding provided by the Agency for Healthcare Research and Quality through the contract, “National Implementation of Comprehensive Unit-based Safety Program (CUSP) to Reduce Catheter-Associated Urinary Tract Infection (CAUTI), project number HHSA290201000025I/HHSA29032001T, Task Order #1.”


