Sustaining Change
Slide Presentation
Slide 1

Sustaining Change
Eugene S. Chu, MD, FHM
Director of Hospital Medicine
Boulder Community Health
Associate Clinical Professor of Medicine
University of Colorado School of Medicine
Image: On bottom left of every slide is the CUSP symbol.
Slide 2
Learning Objectives
- Differentiate between implementation and sustainment.
- Identify key elements in sustainment of process improvement initiatives.
- Recognize the patient care unit’s readiness for sustainment.
- Describe the steps to sustainment.
Slide 3

Acknowledgements
Sarah Krein, PhD, RN
Research Associate Professor
Division of General Medicine
University of Michigan
Mohamad Fakih, MD, MPH
Medical Director
Infection Prevention and Control
St. John Hospital and Medical Center
Images: Photos of Drs. Krein and Fakih.
Slide 4
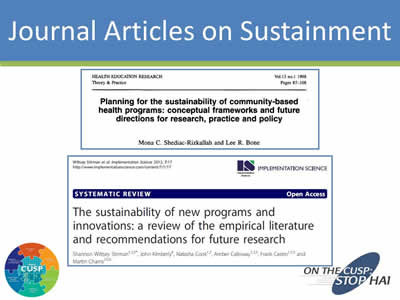
Journal Articles on Sustainment
Images: Screen shots from the title and author sections of 2 journal articles.
Slide 5
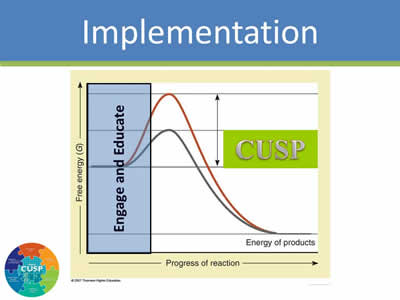
Implementation
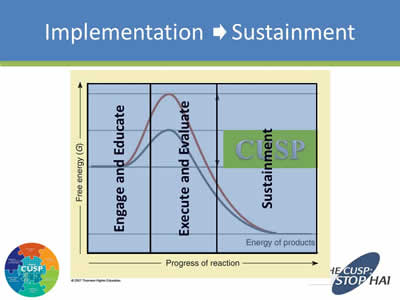
Image: Chart showing progress from Engaging and Education to implementation of CUSP. Two lines go up and slowly go down.
Slide 6
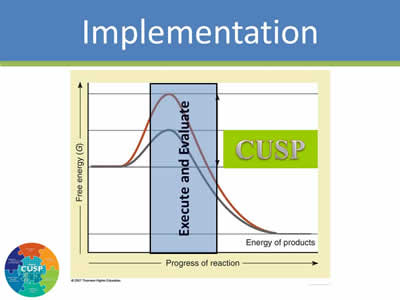
Implementation
Image: Chart showing progress with Execute and Evaluate in the middle of chart to implementation of CUSP. Two lines go up and slowly go down.
Slide 7
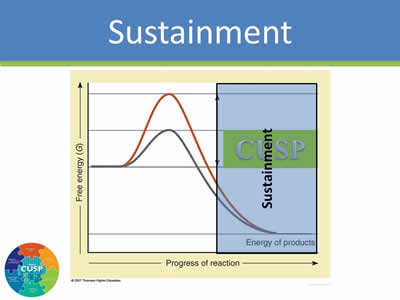
Sustainment
Image: Chart showing progress with Sustainment at the end of chart to implementation of CUSP. Two lines go up and slowly go down.
Slide 8
Implementation
Technical Socio-Adaptive
Slide 9
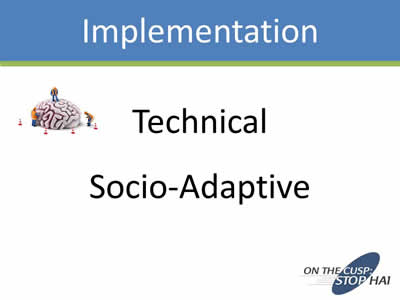
Implementation
Technical Socio-Adaptive
Image: On top left side of slide is an image of a brain with three little people around it, with one of them standing on top.
Slide 10
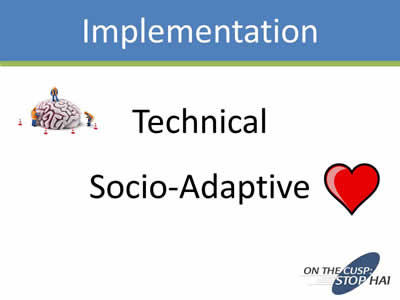
Implementation
Technical Socio-Adaptive
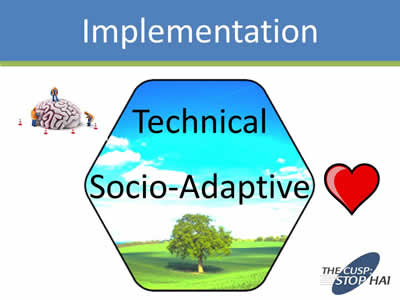
Image: On top left side of slide is an image of a brain with three little people around it, with one of them standing on top, and to the right is a red heart.
Slide 11
Implementation
Same slide as slide 10, only there is a picture of a tree in the middle of a field as background to the words Technical Socio-Adaptive.
Slide 12
Culture
…the shared set of social values and beliefs, both explicit and implicit, that guides actions and decisions within the organization
Slide 13
Culture
A coherent culture is one in which there is widespread agreement around core values and beliefs.
Slide 14
“I know it when I see it.”
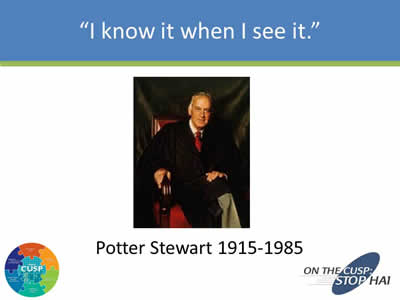
Potter Stewart 1915-1985
Image: Portrait of Potter Stewart.
Slide 15
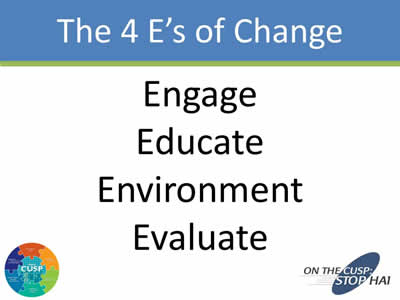
The 4 E’s of Change
Engage
Educate
Environment
Evaluate
Slide 16
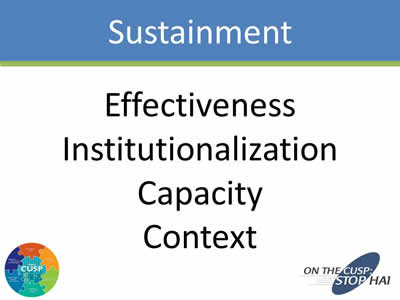
Sustainment
Effectiveness
Institutionalization
Capacity
Context
Slide 17
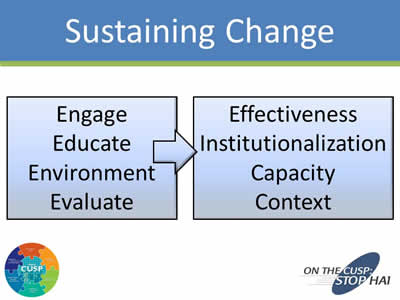
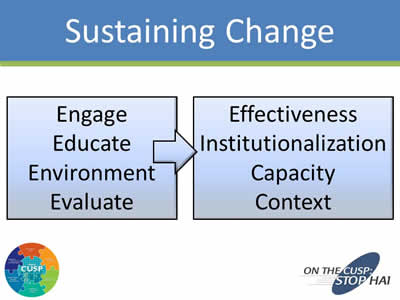
Sustaining Change
Engage
Educate
Environment
Evaluate
leads to:
Effectiveness
Institutionalization
Capacity
Context
Slide 18
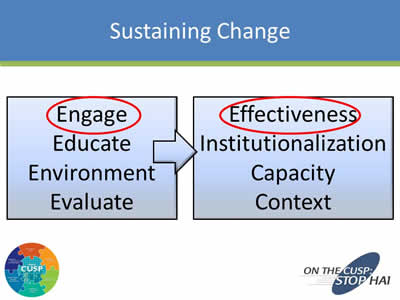
Sustaining Change
Same slide as slide 17, only the words Engage and Effectiveness are circled.
Slide 19
Engage
Vision
Passion
Finances
Slide 20

Passion
Image: Elderly man in hospital bed getting an IV.
Slide 21
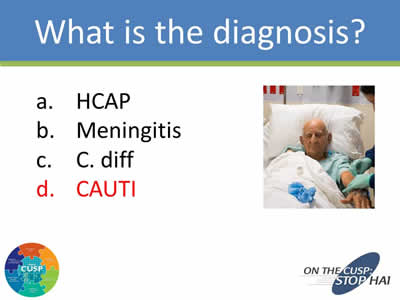
What is the diagnosis?
- HCAP
- Meningitis
- C. diff
- CAUTI
Image: Same elderly man as on slide 20.
Slide 22
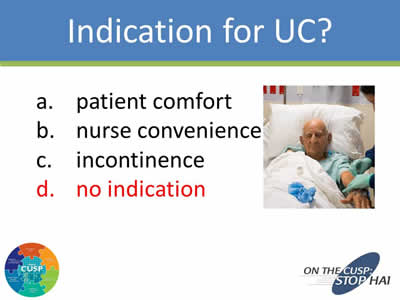
Indication for UC?
- Patient comfort
- Nurse convenience
- Incontinence
- No indication
Slide 23

Passion
Image: Elderly woman with the hand of a health professional on her shoulder.
Image: Small drawing to the right showing a woman with a book opening imagining scenes from a fairy tale.
Slide 24
What did the staff do with Mrs. B’s urinary catheter?
- Change it to an antimicrobial coated catheter.
- Leave it in, it’s more convenient for everyone.
- Change it out every 3 weeks.
- Wait until she fell asleep to take it out.
Slide 25
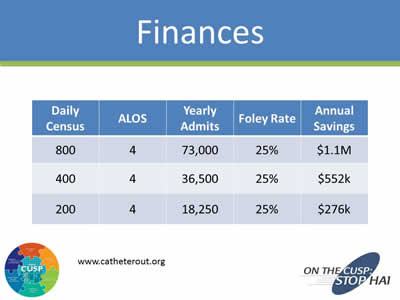
Finances
| Daily Census | ALOS | Yearly Admits | Foley Rate | Annual Savings |
|---|---|---|---|---|
| 800 | 4 | 73,000 | 25% | $1.1M |
| 400 | 4 | 36,500 | 25% | $552k |
| 200 | 4 | 18,250 | 25% | $276k |
Slide 26
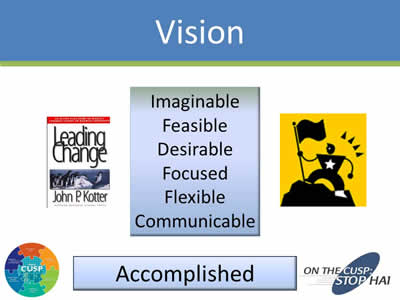
Vision
Imaginable
Feasible
Desirable
Focused
Flexible
Communicable
Accomplished
Images: To the right of the text is the image of a stick figure holding a flag on top of a hill. On the left is the cover of the book "Leading Change" by John P. Kotter.
Slide 27
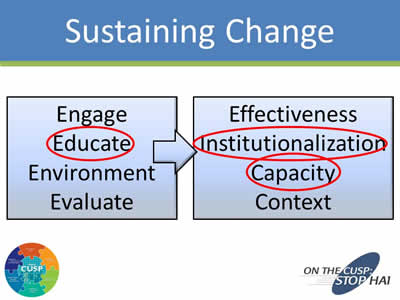
Sustaining Change
Same slide as slide 17, only the words Educate, Institutionalization, and Capacity are circled.
Slide 28
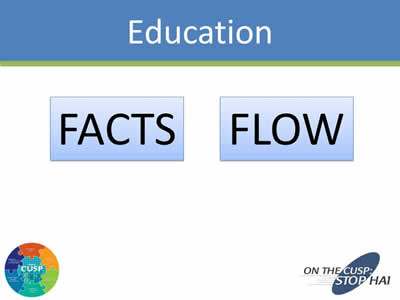
Education
FACTS
FLOW
Slide 29
Facts
HICPAC guidelines
Appropriate
Inappropriate
CAUTI rates, definitions
UC utilization
Cost/CAUTI
Slide 30
Flow
Skin care
Bladder scanner
Condom cath
Female urinals
Aseptic Insertion Technique
Maintenance Technique
Closed System
Slide 31
CAUTI definition changes 2015?
- Requirement for ≥ 100,000 CFU/ml organisms in urine culture
- Exclusion of non-bacteria as sole pathogens
- Use of same pathogen list for symptomatic UTI (SUTI) and asymptomatic bacteremic UTI (ABUTI)
- All of the above
Slide 32
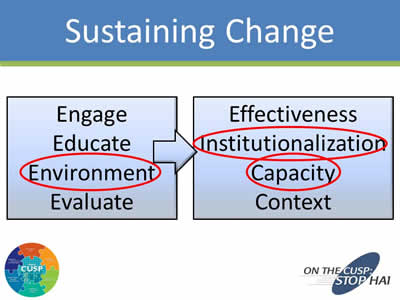
Sustaining Change
Same slide as slide 17, only the words Environment, Institutionalization, and Capacity are circled.
Slide 33
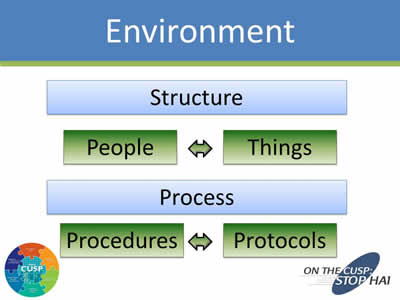
Environment
Structure
People ⇔ Things
Process
Procedures ⇔ Protocols
Slide 34

Structure: People
Image: Photo of smiling health professionals.
Slide 35
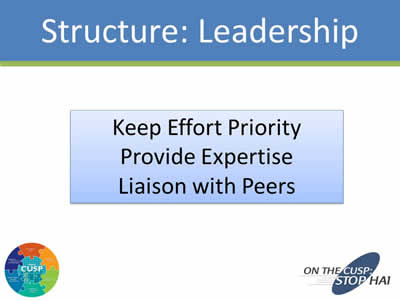
Structure: Leadership
Keep Effort Priority
Provide Expertise
Liaison with Peers
Slide 36
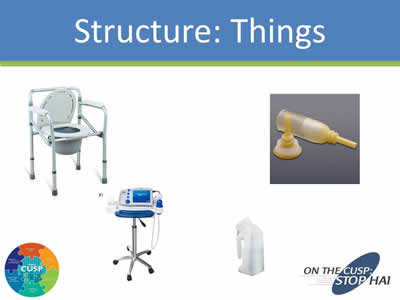
Structure: Things
Images: Photos of a hospital commode, a hospital monitor, a catheter tube, and a male urinal.
Slide 37
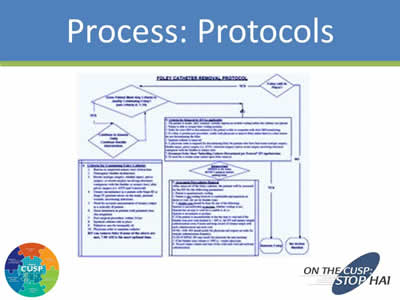
Process: Protocols
Image: Screen shot of the flowchart titled Foley Catheter Removal Protocol.
Slide 38
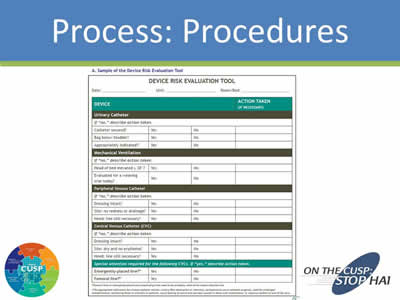
Process: Procedures
Image: Screen shot of the form titled Device Risk Evaluation Tool.
Slide 39
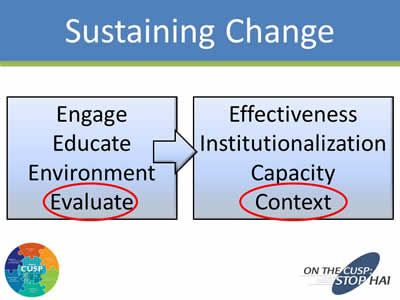
Sustaining Change
Same slide as slide 17, only the words Evaluate and Context are circled.
Slide 40
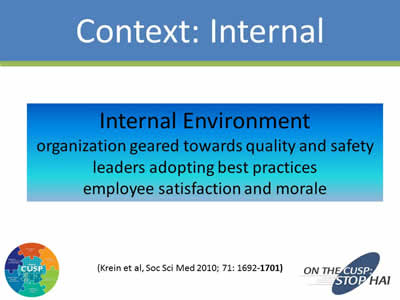
Context: Internal
Internal Environment: organization geared towards quality and safety. leaders adopting best practices, employee satisfaction and morale
(Krein et al, Soc Sci Med 2010; 71: 1692-1701)
Slide 41
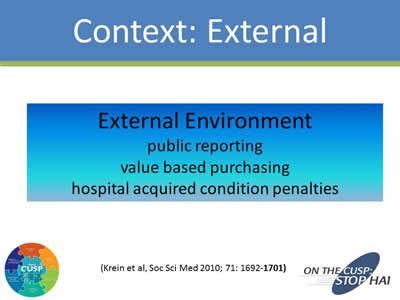
Context: External
External Environment: public reporting, value based purchasing, hospital acquired condition penalties
Slide 42
Evaluation
Use data to assess progress:
- Hospital Survey on Patient Safety
- Infection rates
- Process measures
- Organizational and team culture
Slide 43
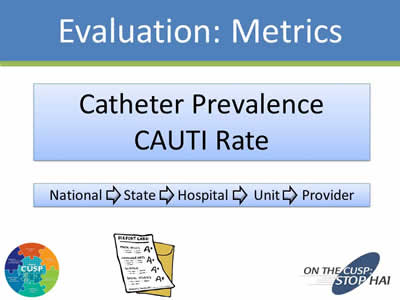
Evaluation: Metrics
Catheter Prevalence
CAUTI Rate
National → State → Hospital → Unit → Provider
Image: Cartoon of a report card with all A+'s.
Slide 44
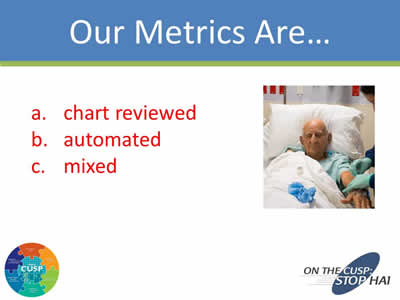
Our Metrics Are...
- chart reviewed
- automated
- mixed
Slide 45
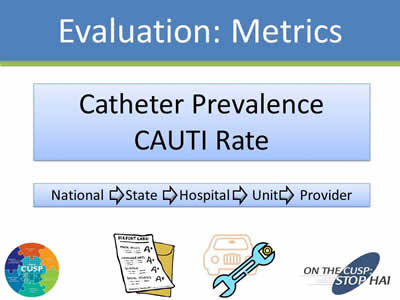
Evaluation: Metrics
Catheter Prevalence
CAUTI Rate
National → State → Hospital → Unit → Provider
Images: Cartoon of a report card with all A+'s and a wrench.
Slide 46

Don't Forget the Cookies
Image: Photo of a plate of cookies.
Slide 47
Implementation → Sustainment
Image: Line graph showing 2 bell curves and the first third of the chart is labeled Engage and Educate, the middle third is labeled Execute and Evaluate, and the last third is labeled Sustainment.
Slide 48
Sustaining Change
Same slide as Slide 17.
Slide 49
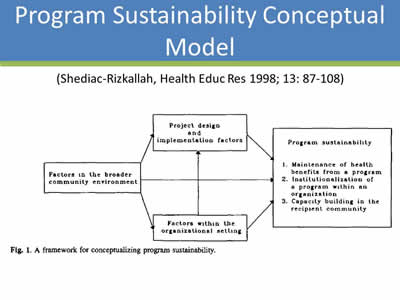
Program Sustainability Conceptual Model
(Shediac-Rizkallah, Health Educ Res 1998; 13: 87-108)
Image: Figure showing a framework for conceptualizing program sustainability. The three components that make-up Program Sustainability include: 1) Factors in the broader community environment 2) Factors within the organizational setting 3) Project design and implementaion factors. Program Sustainability is defined as: 1) Maintenance of health benefits from a program 2) Institutionalization of a program within an organization 3) Capacity building in the recipient community.
Slide 50
Thank you!
Questions?
Slide 51
Funding
Prepared by the Health Research & Educational Trust of the American Hospital Association with contract funding provided by the Agency for Healthcare Research and Quality through the contract, “National Implementation of Comprehensive Unit-based Safety Program (CUSP) to Reduce Catheter-Associated Urinary Tract Infection (CAUTI), project number HHSA290201000025I/HHSA29032001T, Task Order #1.”


