Build a Business Case for Quality Improvement: Facilitator Guide
AHRQ Safety Program for Mechanically Ventilated Patients
Slide 1: Build a Business Case for Quality Improvement
Say:
This slide set introduces building a business case for quality improvement.
Slide 2: Learning Objectives
Say:
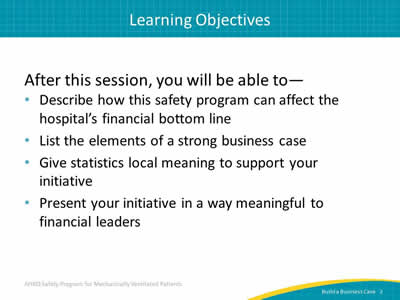
After reviewing this slide set, you will be able to describe how this safety program can affect the hospital’s financial bottom line, list the elements of a strong business case, and give statistics local meaning to support your initiative. You will also learn to present your initiative in a way meaningful to financial leaders.
Slide 3: Impact of Mechanical Ventilation
Say:
You may recall this information from the introductory slide set, Overview: Getting Patients Off the Ventilator Faster. Here are some background statistics regarding mechanical ventilation:
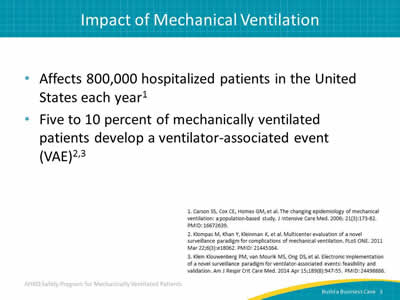
Eight hundred thousand patients receive mechanical ventilation in the United States each year, and 5 to 10 percent of these patients develop a VAE.
Slide 4: Impact of Mechanical Ventilation
Say:
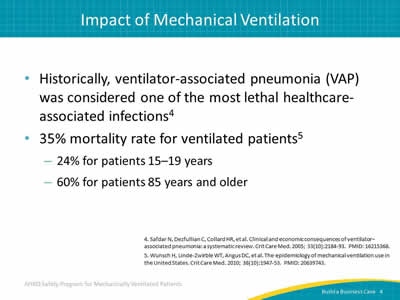
- Historically, VAP was considered by many researchers to be perhaps the most deadly healthcare-associated infection associated with mechanical ventilation.
- In fact, there is a 35 percent mortality rate for ventilated patients with VAP. Therefore, it carries significant impact for patients.
For every day a patient is on a ventilator, he or she accumulates a risk for developing a ventilator-associated event and/or VAP.
Slide 5: Impact of Mechanical Ventilated Patients
Say:
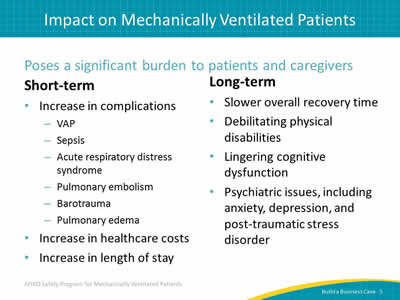
Complications from mechanical ventilation pose a significant burden on patients and their caregivers. In the short term, patients may experience VAP, sepsis due to the development of pneumonia, acute respiratory distress syndrome, pulmonary embolism, barotrauma, and pulmonary edema.
Over the long term, mechanically ventilated patients often experience slower overall recovery time, debilitating physical disabilities, lingering cognitive dysfunction, psychiatric issues such anxiety, chronic depression, and post-traumatic stress disorder. These patient outcomes stem from long intensive care unit or ICU stays with mechanical ventilation.
Slide 6: Financial Impact of Mechanical Ventilation
Say:
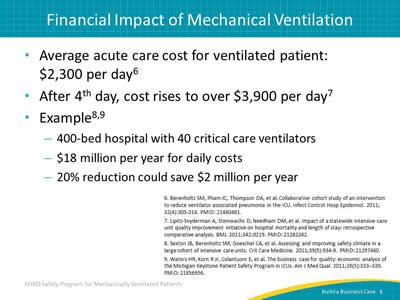
The average ICU cost for a ventilated patient is $2,300 per day, and that cost rises to over $3,900 per day after the fourth day. For example, a 400-bed hospital with 40 critical care ventilated patients on average per day spends $18 million every year. Reducing the ventilator days by 20 percent saves $2 million per year. That level of cost savings alone should resonate with your financial leaders.
Slide 7: Ventilator-Associated Events (VAEs) Attributable Hospital Mortality
Say:
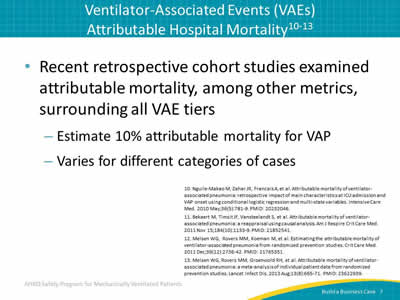
A recent retrospective cohort study conducted at an academic tertiary care center studied ventilator-associated event or VAE hazard ratios, antibiotic exposures, microbiology, attributable morbidity, and attributable mortality for all VAE tiers.
Compared with matched controls, VAEs were associated with more days to extubation, more days to hospital discharge, and higher hospital mortality risk.
Slide 8: VAPs Among Most Expensive HACs
Ask:
Do you know how much preventable healthcare-acquired conditions cost?
Say:
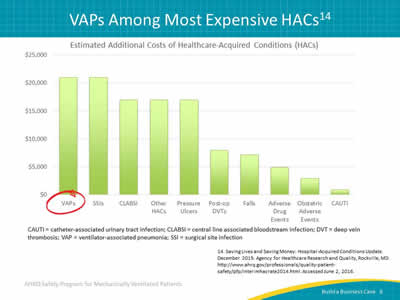
VAP and surgical site infections top the list at, on average, $21,000 in estimated additional costs. Central line associated bloodstream infections and pressure ulcers can add an estimated $17,000 to care delivery costs. Postoperative deep vein thromboses, patient falls, and adverse drug events also yield significant additional and unnecessary expenses. Especially for states moving to pay-for-performance financial models, hospitals cannot afford these complications.
Slide 9: What Do We Need To Do?
Say:
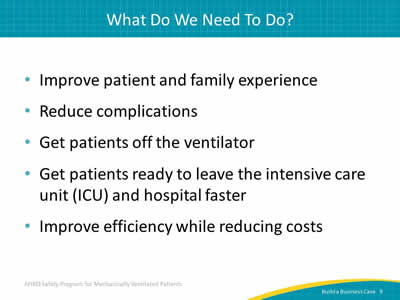
Today we have strong evidence regarding the therapies that mechanically ventilated patients need to improve patient and family experience, as well as to decrease the short-term and long-term complications. Evidence-based care practices improve patient outcomes and reduce complications by getting patients off the ventilator faster and safely getting them out of the ICU faster. Hospitals around the country are focused on improving efficiency and reducing unnecessary costs.
Slide 10: AHRQ Safety Program Goals
Say:
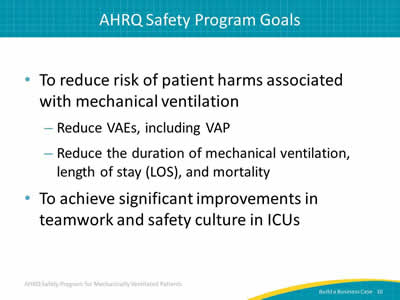
The goals of this safety program are simple, although accomplishing these goals is complex.
First, we must reduce the risk of patient harms associated with mechanical ventilation. Second, we need to improve the teamwork and safety culture in our ICUs. By getting patients off of the ventilator faster, you will reduce the risk of patient harms associated with mechanical ventilation. In addition, you will reduce the number of ventilator-associated events and the duration of mechanical ventilation, ICU and hospital length of stay (or LOS), and mortality. By improving teamwork and safety culture, you can realize the first goal and reduce risk of patient harms.
Slide 11: Ventilator-Associated Events Successes
Say:
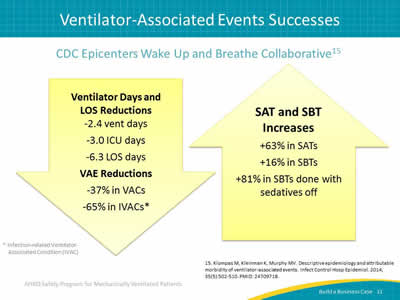
The 2015 CDC Epicenters Wake Up and Breathe collaborative implemented a coordinated approach to spontaneous awakening and breathing trials, or SATs and SBTs over a 19-month period. Providers stopped or minimized sedation (wake up), then administered SBTs (and breathe). SATs rose by 63 percent and SBTs rose by 16 percent; approximately 81 percent more of the SBTs were performed without sedatives.
Patients are often unable to complete SBTs due to sedation. If they don’t pass the SBT, they continue to receive mechanical ventilation. By reducing sedation, patients can participate in and pass the SATs. Next, patients receive SBTs. The sooner the patient can pass a spontaneous breathing trial, the sooner the patient gets off the ventilator and breathes independently.
Ask:
So, what were the findings of this collaborative?
Say:
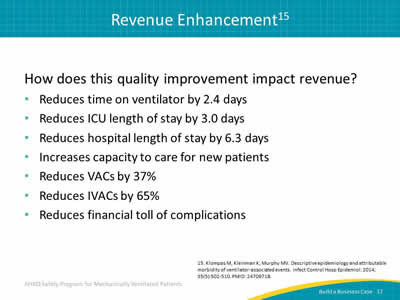
The coordination of SATs and SBTs resulted in a 2.4-day reduction in ventilator days, a 3.0-day reduction in ICU days, and a 6.3-day reduction in the total LOS in the hospital. These patients went home almost a week faster. In addition, they found a 37 percent reduction in ventilator-associated conditions and a 65 percent reduction in infection-related ventilator-associated conditions.
Slide 12: Why Build a Business Case?
Ask:
Why build a business case?
Say:
A business case will answer questions from your financial leaders, who will likely have many questions.
Ask:
Where will we get the money to pay for this?
Why should we devote our scarce resources to your program?
Can we afford these expense increases now?
Say:
Anticipate these questions and identify potential solutions.
Slide 13: The Basic Business Model
Say:
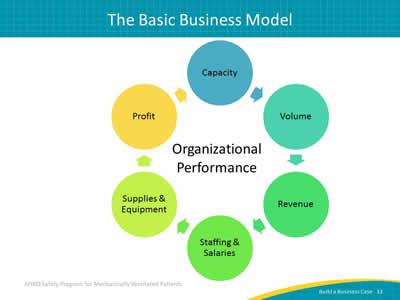
Let’s talk about a basic business model as an indicator of organization performance. The business model of health care essentially functions as a cycle. The cycle begins with generating patient volume, which ultimately leads to earning revenue. Revenue in turn funds the hiring of staff and the purchase of supplies and equipment. Remaining funds, called profits, are invested in programs to expand the workforce, purchase equipment, renovate facilities, and offer new service lines. Profits can also fuel capacity increases, allowing for the care of additional patients. To recap, capacity yields volume, which creates revenue. Revenue is spent on staff and supplies, hopefully yielding a profit. (It is immaterial here if your organization is a not-for-profit hospital.)
Slide 14: Focus for Business Case
Say:
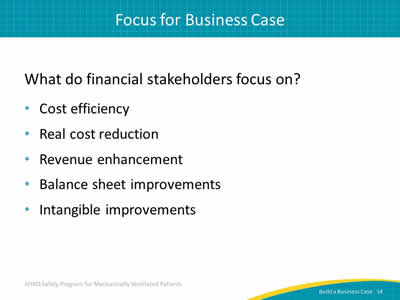
Financial stakeholders focus on several elements including cost efficiency, real cost reduction, revenue enhancement, balance sheet improvements, and intangible improvements.
Ask:
Can you share an example of a cost efficiency?
What about a real cost reduction?
Who can add a revenue enhancement?
Can you share an example of a balance sheet improvement?
Who can share an intangible improvement that matters to leaders?
Note:
Sample examples are listed below to prompt discussion if needed.
Cost efficiency: process improvement leads to faster medicine delivery with less errors
Cost reduction: reducing amount spent annually on laundry detergent
Revenue enhancement: shorter LOS increases patient throughput capacity
Balance sheet improvement: reduced liability like malpractice claims or increased capital equipment assets
Intangible improvement: higher staff engagement leads to less staff turnover and burnout.
Slide 15: Cost Efficiency
Say:
Let’s walk through each of the six parts of the basic business cycle.
Ask:
How can quality improvement make your institution more cost efficient?
Say:
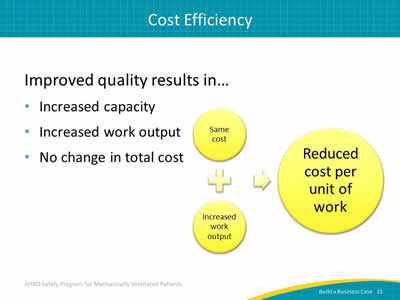
Improved quality can result in an increase in capacity and an increase in work output with little to no change in the total cost. This model is probably familiar to most health care workers, but it doesn’t always mean "do more with less." It means spending the same money better. For example, if your unit changed the duties of two technicians to better support the workload of night shift nurses, your unit could realize cost efficiencies.
Slide 16: Real Cost Reduction
Say:
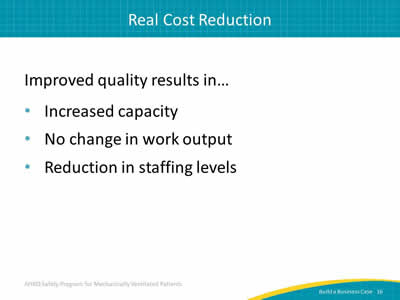
Improved quality not only has the potential to increase capacity, but can also remove change in work output as well reduce staffing levels.
Slide 17: Revenue Enhancement
Say:
Quality improvement initiatives impact revenue in several ways. For instance, let’s examine how improving the quality of care impacts VAP specifically. This may include a decrease in time the patients must spend on a ventilator, thus decreasing the time they spend in the ICU and in the hospital altogether. This results in a higher throughput in the intensive care unit, increasing the capacity for new patients. A successful initiative can significantly reduce VACs and infection-related VACs, thereby reducing the financial toll resulting from such complications.
Slide 18: Balance Sheet Improvements
Ask:
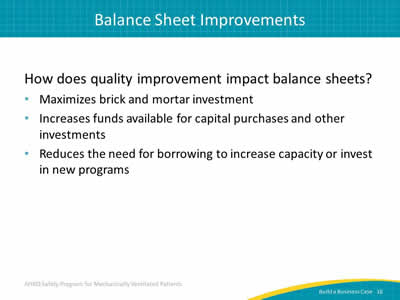
How can quality improvement impact balance sheets?
Say:
Quality improvement can maximize brick and mortar investment, or the physical buildings and facilities. It can also increase available funds to buy equipment and make other essential investments for the future of the hospital and the growth of patient care. When revenue funds capital growth, the hospital does not need to borrow funds for investments, directly reducing interest and other expenses.
Slide 19: Intangible Improvements
Say:
The parts of the basic business cycle addressed so far can be quantified.
Ask:
But what about those elements that cannot be quantified monetarily?
Say:
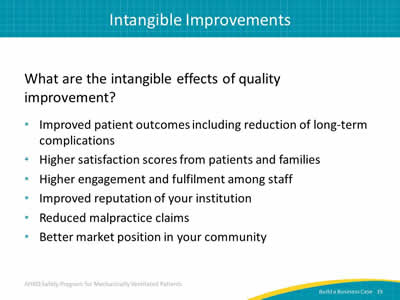
Quality improvement can also produce several intangible effects. For instance, as quality is improved, fewer malpractice claims may be filed. Patient satisfaction scores are likely to rise, fostering an improved reputation in the community. Staff satisfaction will grow as your institution improves reputation and market position. We know that patient experience and staff satisfaction have a real impact on the bottom line, but it is difficult to define the dollar value of those benefits.
Slide 20: Return on Investment
Ask:
What is return on investment?
Say:
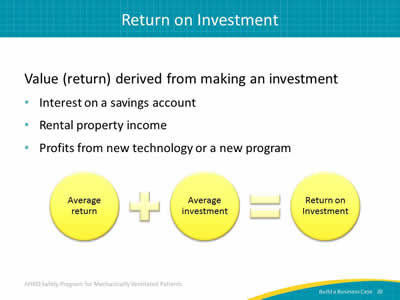
Return on investment, or ROI, is the value, or return, derived from making an investment. ROI is determined by average return and average investment. Your financial leaders want to know what they can expect to receive from their investment.
Ask:
How will your request benefit the organization?
Say:
Let’s say your unit needs another full-time nurse
Ask:
What happens with requests for additional staff?
Does anyone work for a hospital where they can ask for additional staff and, like magic, new staff arrive?
Say:
Of course not—that is not our reality in health care. However, if you can articulate why you need the additional staff and what you expect will improve, you have a better chance of achieving your goal. Share what you expect to gain from additional staff. For instance, perhaps the new nurse will allow a respected team member time to track compliance with evidence-based care, report the data to local staff and leadership, and ultimately save $500,000 while improving patient outcomes, boosting staff morale, and getting patients off the ventilator faster.
Ask:
Would your financial leaders be listening now?
Say:
Implementing the interventions in this safety program has significant benefits. Decreases in LOS and duration of mechanical ventilation have intangible cost benefits.
Slide 21: Understanding Your Target Audience
Say:
The chief financial officer, or CFO, is the principal business consultant to hospital leadership. The CFO, who typically has a degree in finance, understands how revenue is flowing and serves as the gatekeeper of hospital assets. The CFO focuses on the bottom line and tends to be the person executives look to for guidance. While a CFO is generally a “concrete thinker” with a significant level of financial expertise, he or she might be unaware of the clinical aspects of your work. Many executive suite officers are eager to hear from frontline clinicians and have great respect for the work they perform. Help them understand your needs in order for them to help you meet them.
Slide 22: Giving Statistics Local Meaning
Say:
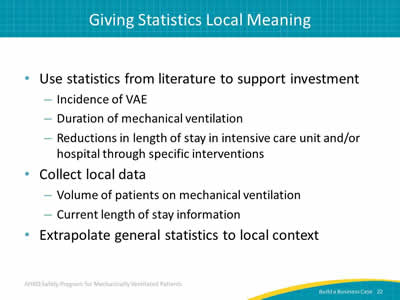
Give statistics local meaning to support your proposal. This process has three steps.
First, use statistics from literature to support investment. Examples include the incidence of ventilator-associated events, average duration of mechanical ventilation, reductions in length of stay in the ICU and the hospital through specific interventions.
Second, collect local data to make the proposal relevant. Identify the current volume of patients on mechanical ventilation, the current compliance rate for specific care processes, the average length of mechanical ventilation in your unit, or the average length of stay. Determine how your data compare with national and state averages.
Third, extrapolate the general statistics from the literature to your local context.
Ask:
If one study reduced a key measure significantly through an intervention, how would implementing that intervention impact your patients and your hospital?
Slide 23: Giving Statistics Local Meaning
Say:
Let’s walk through an example.
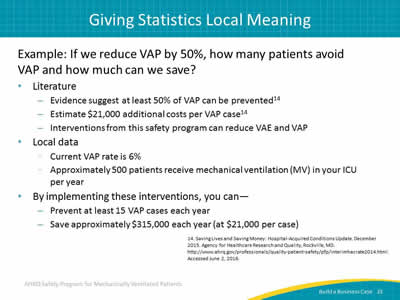
Evidence suggests that at least 50 percent of VAPs can be prevented.
Ask:
If we reduced our VAPs, how much could we save?
Say:
While there are many ventilator-associated complications, VAP is one of the most severe complications and is estimated to add $21,000 to the cost of care delivery.
Let’s say the current VAP rate is 6 percent in your unit and approximately 500 patients receive mechanical ventilation in your unit each year. By implementing these interventions, you could expect to prevent at least 15 VAP cases each year. Using the national average cost, you could save $315,000 each year.
Slide 24: Giving Statistics Local Meaning
Say:
Let’s try another example.
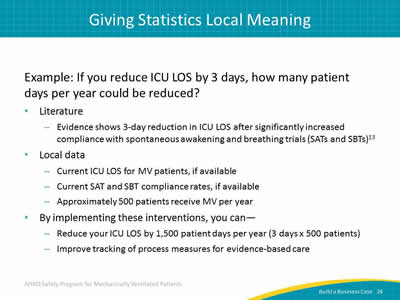
We want to get our patients off the ventilator faster. Earlier we discussed an intervention that reduced ICU length of stay or LOS by 3 days.
Ask:
If we reduced our ICU LOS by 3 days, how much could we save?
Say:
Collect all pertinent local data available. Let’s assume your unit treats approximately 500 patients receiving mechanical ventilation each year. If your average ICU LOS went down by 3.0 days, you would save 1,500 patient days per year. Saving 1,500 patient days per year increases capacity, reduces costs, enhances revenue, and improves patient outcomes.
Your financial leaders will ask you how you can reduce your ICU LOS.
Slide 25: Questions To Ask Your Leaders
Say:
So when your financial leaders ask you why they should accept your proposal, have a few questions of your own.
Ask:
Where will we get the money to pay for the patients with preventable healthcare-acquired infections?
How can we realize these savings and patient improvements?
Can we afford to ignore these patient and financial costs?
Would you want your parent, spouse, or child treated in a unit not practicing evidence-based care?
Slide 26: Making the Pitch
Say:
In presenting your business case to the CFO, start with the anticipated return on investment. Focus on revenue first, then share operating or investment costs. Be sure to come prepared with revenue and expense estimations. Finally, solidify your plan by providing solid real world application of how quality improvement is good for business.
Slide 27: Questions?

Ask:
Are there any questions?
Slide 28: References
Slide 29: References
Slide 30: References
Slide 31: References
