Deep-Rooting Your Data: Facilitator Notes
AHRQ Safety Program for Surgery
Slide 1: Deep-Rooting Your Data

Say:
This module focuses on the concept of deep-rooting and setting up sustainable interaction with your quality improvement data.
Slide 2: Learning Objectives
Say:
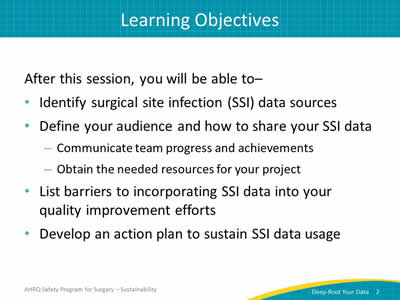
At the end of this session, you will be able to–
- Identify surgical site infection (SSI) data sources.
- Define your audience and method of sharing your SSI data.
- List barriers to incorporating SSI data into your quality improvement efforts.
- Develop an action plan to address barriers to sustaining the use of SSI data for quality improvement efforts.
Slide 3: SSI Data Sources
Say:
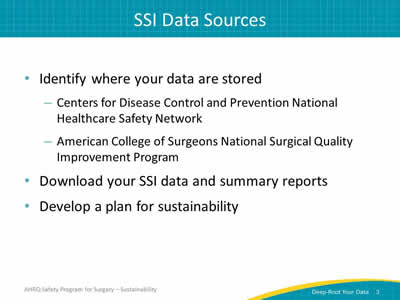
First, identify the sources for your rates of surgical site infections within your organization. The Centers for Disease Control and Prevention has the National Healthcare Safety Network or NHSN dataset, and the American College of Surgeons has the National Surgical Quality Improvement -Program or NSQIP data set. Both data sets provide SSI outcome data.
Ask:
Do you get data reports from your infection prevention department, through the NHSN portal, or through the NSQIP abstractor?
Who provides the reports?
How frequently are the reports available?
Say:
Many surgical teams are dependent on infection control practice or a hospital administrator to provide data. Be prepared to collaborate with multiple contacts to obtain your data.
After you have located the source of your SSI data, download the data and summary reports. Data from your local clinical setting should drive quality improvement efforts and your sustainability plan.
Slide 4: Process Versus Outcome Data
Say:
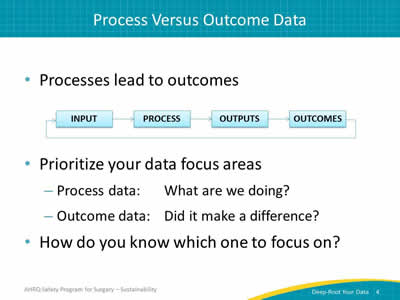
NHSN and NSQIP provide data on outcomes; it tells you whether your organization’s efforts worked.
Ask:
Did your efforts make a difference?
Did you reduce surgical site infections?
Say:
On the other hand, process measures data show how you are doing with the various activities that you’ve implemented. While outcome measures, like SSI rates, have a time lag, process measures are readily available. Process measures identify process compliance, such as hand hygiene.
Thus process measures, when coupled with outcome measures, may help identify which activities facilitated the change in SSIs. When you audit your practices and provide real time feedback to your unit, your frontline providers can act on that data. Review process measures to build momentum while your unit waits on outcome data.
Evaluate each intervention, whether it’s maintaining normoglycemia, maintaining normothermia, or using a bowel preparation. Each is a process measure, immediately available for feedback.
In summary, process data is what you do, and outcome data validates if it made a difference.
Slide 5: Process Data
Say:
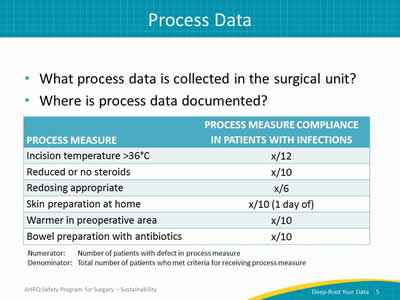
The process measures that your team has implemented will hopefully reduce or eliminate SSIs. This table lists several process measures.
Ask:
For example, how often were the designated anesthesia team members in the room along with the nursing team members?
How often were patients’ temperatures above 36 degrees Celsius at the time of incision?
Say:
When you collect data on your processes, compliance for each intervention is visible. Teams are sometimes surprised by the findings. You may find evidence that supports your suspicions. Armed with data, your team can isolate where system breakdowns occur. Low compliance rates point to inconsistent areas in the care delivery.
Share your data. Let your surgical staff know how many patients received the best practices of skin preparations or maintained normothermia. Use this data to eliminate variations in daily care practices and drive compliance.
Slide 6: Process Measure Examples
Say:
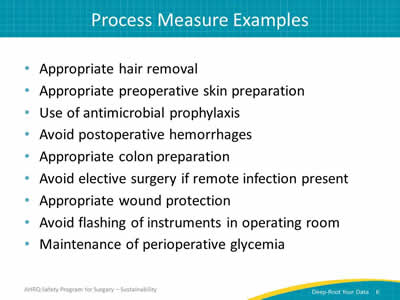
These are examples of process measures you can implement in your organization. Data collected will help determine the impact of one or more of these activities on your SSI rates.
Ask:
How often do you keep your patients’ temperature above 36 degrees at the time of incision?
Are you using either a reduced amount of steroids or no steroids?
Say:
Process measures provide many opportunities for evaluation. For instance, check how often patients are appropriately redosed with the antibiotic prophylaxis. Evaluate that your frontline staff are following the protocols; such as giving patients chlorhexidine wipes to use the night before and the morning of surgery.
Process measures can be evaluated in real time or after the case. After implementing interventions, it is easy to assume that the work is done. Many teams report that they build bundles, implement them, and expect that the new tasks be completed. But when they go back and look, they find it is not happening as expected.
Ask:
Where is the breakdown in your system?
Slide 7: Small Denominator Dilemma
Say:
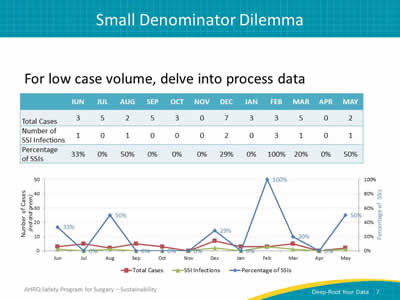
This graph illustrates using process measure data to understand outcome measure data. This artificial data set shows what happens when the case volume is low. Process data may aid your safety team’s understanding of their performance. Consider providing both data in one chart. Provide data collected for each month. This helps you to see trends and can help you make some connections between process and outcome data.
This graph shows you how to use the process measures to link with the outcome measures. Frequently, the volume of specific procedures may be low. If your surgical area only does between one and five colectomy cases per month, your rate could easily bounce between zero and 50 percent. It’s hard for providers, especially frontline providers unaccustomed to looking at data and evaluating numerators and denominators, to process these jumps.
When you include process measures with outcome data, it makes sense of your efforts. It also allows you more time to accumulate outcome data.
Another effective strategy is to sample a small group of patients. Providing immediate feedback to specific surgical areas, like preoperative staff members, raises awareness and ownership of the processes. Data that clinicians find meaningful will drive your quality improvement efforts.
Slide 8: Small Denominator Dilemma
Say:
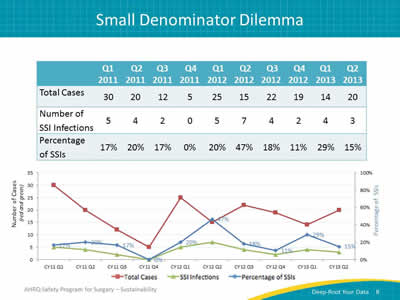
Quarterly data can smooth out the wild swings that can accompany a low case volume. You can also share data about individual cases that represent the infections. Examining these individual cases helps assess how often your organization complied with one or more process measures related to each case. So, rather than saying the SSI rate is 50 percent, perhaps share the five cases that developed SSI. Identify which process measures were not present on those cases and share with your frontline staff. Each case should be investigated to determine potential sources of infection.
Slide 9: Sample SSI Rate Report
Say:
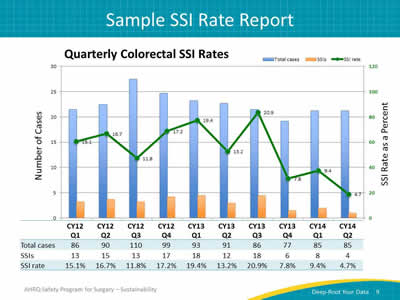
This is an example of what a hospital has done with its NSQIP data. It collects data from all patients undergoing colon and rectal procedures (colectomy and proctectomy). This chart combines these two surgeries, because they represent activities of largely the same surgeons doing both procedures. In this case, evaluating the data by quarter provides enough cases to observe trends.
Slide 10: Deep-Rooting Your Data: Data Sharing

Say:
Now let’s turn to the importance of sharing data.
Once teams have data readily available, we tend to have much more data than we appreciate. The hard part is often sharing data, not getting data. The same core team members grow accustomed to reviewing the data, usually a leadership committee or management. However, many teams find sharing the data broadly more difficult.
Ask:
How do you get your data out to the frontline staff and to all of the operating surgeons?
Say:
Sharing your data requires a plan.
Slide 11: Develop a Data Sharing Plan
Say:
You will need to develop a plan to share your data.
Ask:
Who is responsible for acquiring the data?
Who is responsible for analyzing the data?
Who is responsible for sharing the data with all surgical staff members?
Say:
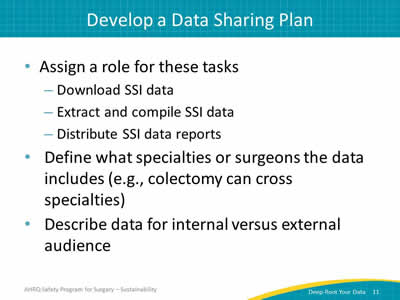
Assign a role for each component of data sharing. Ideally, one person should be assigned to manage the data. That person can download the SSI data, extract and compile it, and distribute the data reports on a regular basis.
For data to be meaningful, stakeholders must understand what it represents. Make sure your reports are clear with titles and labels that explain the information. Include service lines, providers, and time period.
Data needs and presentations will change for internal versus external audience members. Inpatient unit staff may prefer the patient names to remember the case and the resulting outcome. Connecting a person associated with the complication makes the story, or case, much more memorable. Patient identifiers add a deeper dimension to the discussion and invest caregivers in the data and prevention efforts. However, take care to keep any patient identification confidential.
An external audience can mean many things. Here, external could mean outside of your department or outside of your hospital. Patient identifiers would be inappropriate and irrelevant outside of your unit. As the needs of your audience shift, so should your reporting. Although case details matter to frontline staff, department leadership or the organization will likely be more interested in summary data and trends.
The point is to think of your audience and anticipate its questions and informational needs to prevent occurrence of SSIs or other undesired outcomes.
Slide 12: Orient the Audience

Say:
Tailor the data presentation to your audience. Recognize when your audience is new to viewing the data, and explain it in a way that makes sense to them. Be prepared to discuss exactly what the numerator and denominator represent.
If you are presenting a random sample of NSQIP data, make sure to explain that the data does not represent every patient undergoing colon surgery, but a sampling. Be clear about the specialties or surgeons the data includes.
Ask:
Who is your audience?
Say:
Based on your goals for sharing the data, identify what you want your audience to focus on.
Once you establish what your audience needs, you will be better equipped to meet those needs. If you need frontline staff to comply with a bundle, share compliance rates and outcome data. Make it clear that greater compliance leads to fewer infections. If you need protected time or approval to purchase new equipment, make the case for expected cost savings coupled with improved patient care backed with data.
Slide 13: Leverage Your Data
Say:
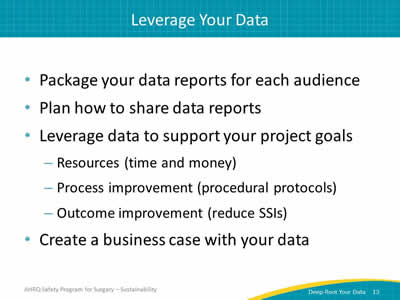
Package your data—frame it for your audience. Use your data to create a business case for getting necessary resources for your project.
Consider who needs to see your data reports and how you can reach those people. Never underestimate how little others know about the data. Share widely and share often.
Use data to justify additional resources. If you can show meaningful results to your leadership, it will be easier to build a business case for protected time for quality improvement on the unit.
The process for building a business case is far smoother in partnership with your administration. When you share data with administrators, you provide the necessary information to support your requests and accelerate your programs.
Slide 14: Barriers to Deep-rooting Your Data
Say:
So far, the hard part has been figuring out what to do with your data and sharing it with others. Unfortunately, there is no shortage of hurdles in health care. It is a challenge to get data to the front line and to build the habit of expecting data. It is a bigger challenge to act on that data.
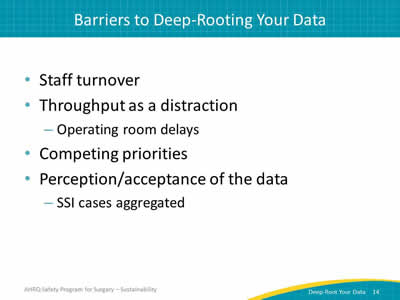
Staff turns over: promotions, relocations, transfer to other clinical areas. Your best quality improvement people get promoted. Your lead nurse moves out of state. The nurses in the operating room frequently change. Your senior executive takes on a new department. New residents flood your hallways.
Efficiency is emphasized. Throughput and competing priorities can divert attention from process and outcome data. Skepticism about the data, especially from the surgeons, can also present difficulties in achieving compliance and goals. Clinicians must value the data for it to be effective at changing behaviors.
Slide 15: Action Items
Say:
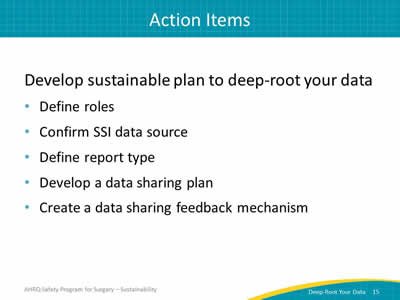
Develop a sustainable action plan to—
- Deep-root your data as an ongoing part of your quality improvement efforts
- Define who’s going to be responsible for compiling those reports
Use the same data source. If you’re going to use NHSN data, always use NHSN data. If you’re going to use NSQIP data, always use NSQIP data. Shifting between data sources will cause confusion among your audience. Remember your audience.
Standardize how you customize reports. Consistent reports are easier for staff to understand and act on. Create and follow a plan for sharing data.
Ask:
In what meetings will you share your data?
With whom will you share these data?
Who will explain the data?
How will you acquire feedback on your data?
Say:
This goes for both your outcome and process measures. Give your staff the opportunity to provide feedback on the data and the plan to communicate the data. Make sure that sharing the data opens up a two-way dialogue with your frontline providers.


