Deep-Rooting Your Data: Slide Presentation
AHRQ Safety Program for Surgery
Slide 1: AHRQ Safety Program for Surgery—Sustainability
Deep-Rooting Your Data
Slide 2: Learning Objectives
After this session, you will be able to–
- Identify surgical site infection (SSI) data sources.
- Define your audience and how to share your SSI data:
- Communicate team progress and achievements.
- Obtain the needed resources for your project.
- List barriers to incorporating SSI data into your quality improvement efforts.
- Develop an action plan to sustain SSI data usage.
Slide 3: SSI Data Sources
- Identify where your data is stored:
- Centers for Disease Control and Prevention National Healthcare Safety Network.
- American College of Surgeons National Surgical Quality Improvement Program.
- Download your SSI data and summary reports.
- Develop a plan for sustainability.
Slide 4: Process Versus Outcome Data
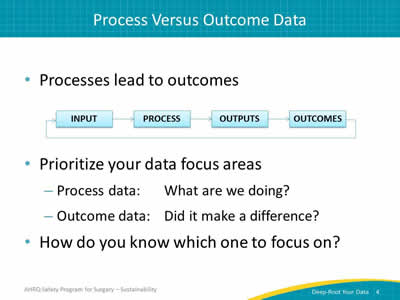
- Processes lead to outcomes.
- Prioritize your data focus areas.
- Process data: What are we doing?
- Outcome data: Did it make a difference?
- How do you know which one to focus on?
Image: Flowchart with four boxes: Input, Process, Outputs, Outcomes.
Slide 5: Process Data
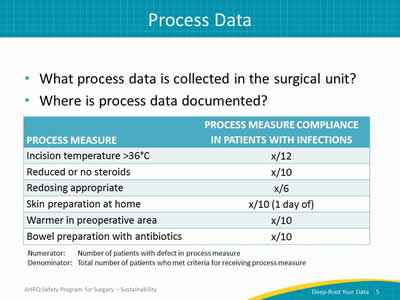
- What process data is collected in the surgical unit?
- Where is process data documented?
Image: Table with several process measures to evaluate compliance in patients with infections.
- Incision temperature >36°C.
- Reduced or no steroids.
- Redosing appropriate.
- Skin preparation at home.
- Warmer in preoperative area.
- Bowel preparation with antibiotics.
Numerator: Number of patients with defect in process measure.
Denominator: Total number of patients who met criteria for receiving process measure.
Slide 6: Process Measure Examples
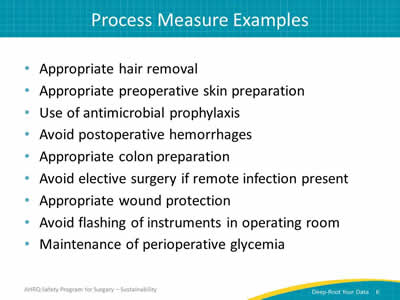
- Appropriate hair removal.
- Appropriate preoperative skin preparation.
- Use of antimicrobial prophylaxis.
- Avoid postoperative hemorrhages.
- Appropriate colon preparation.
- Avoid elective surgery if remote infection present.
- Appropriate wound protection.
- Avoid flashing of instruments in operating room.
- Maintenance of perioperative glycemia.
Slide 7: Small Denominator Dilemma
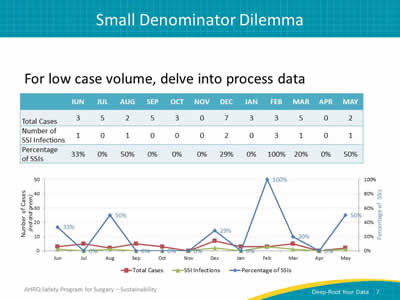
Image: Sample monthly data set to illustrate effects of low case volume. Table shows total case volume, number of surgical site infections (SSIs), and the percentage of SSIs. Line chart of total number of cases, SSI infections, and the percentage of SSIs per quarter.
Slide 8: Small Denominator Dilemma
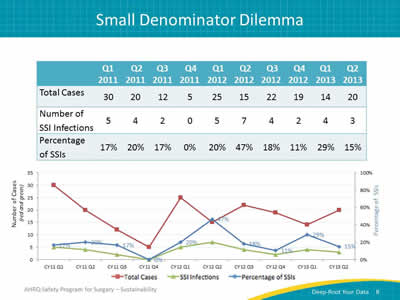
Image: Sample data set to illustrate effects of low case volume. Quarterly graph refines the wild variations in low-case volume monthly report. Table shows total case volume, number of surgical site infections (SSIs), and the percentage of SSIs. Line chart of total number of cases, SSI infections, and the percentage of SSIs per quarter.
Slide 9: Sample SSI Rate Report
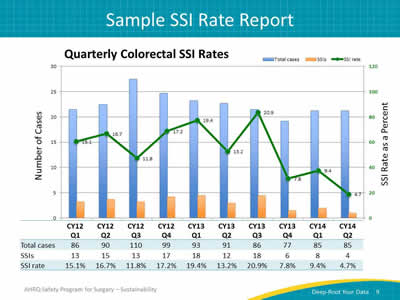
Image: Bar graph with total cases per quarter and total number of surgical site infections per quarter. Line includes the percentage of SSI cases per quarter. Results are not relevant to the discussion, although the trend is a reduction in surgical site infections while the colorectal case volume remains stable.
Slide 10: Deep-Rooting Your Data

Data Sharing
Slide 11: Develop a Data Sharing Plan
- Assign a role for these tasks–
- Download SSI data.
- Extract and compile SSI data.
- Distribute SSI data reports.
- Define what specialties or surgeons the data includes (e.g., colectomy can cross specialties).
- Describe data for internal versus external audience.
Slide 12: Orient the Audience

- Tailor your data presentation to your audience.
- Explain data in ways that make sense for your audience.
- Ask questions about your audience:
- What do I want them to focus on?
- How do I gauge the needs of my audience?
- Decide on detailed data versus summary data.
Slide 13: Leverage Your Data
- Package your data reports for each audience.
- Plan how to share data reports.
- Leverage data to support your project goals:
- Resources (time and money).
- Process improvement (procedural protocols).
- Outcome improvement (reduce SSIs).
- Create a business case with your data.
Slide 14: Barriers to Deep-rooting Your Data
- Staff turnover.
- Throughput as a distraction:
- Operating room delays.
- Competing priorities.
- Perception/acceptance of the data:
- SSI cases aggregated.
Slide 15: Action Items
Develop a Sustainable Action Plan to Deep-Root Your Data
- Define roles.
- Confirm SSI data source.
- Define report type.
- Develop a data sharing plan.
- Create a data sharing feedback mechanism.


